
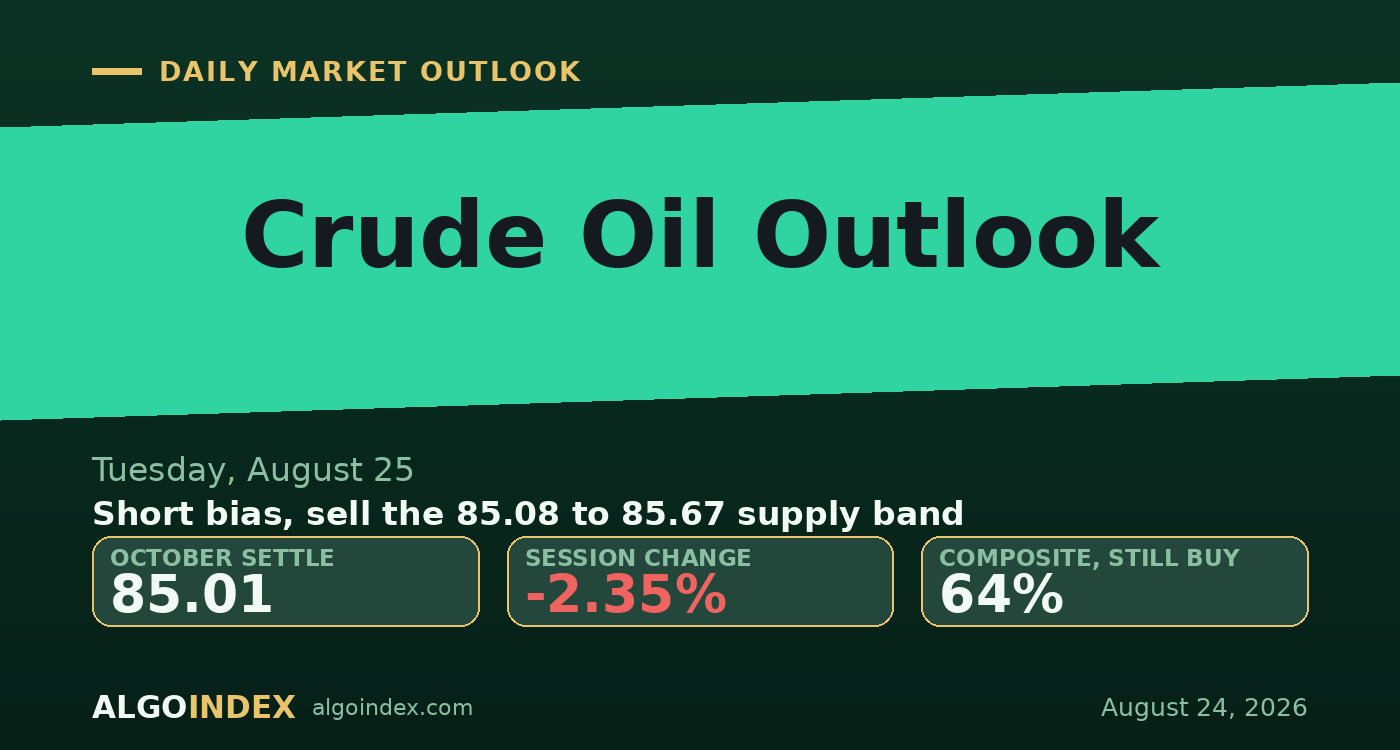
Crude settled Monday at 85.01, down 2.05 and off 2.35 percent, and this time the electronic close made the point sharper rather than softer. October gapped 56 cents under Friday's 87.06 settle, never traded back above its 86.50 open, and finished in the bottom third of the range. The last prints before the 17:00 break changed hands near 84.98, a few cents beneath the settle. Friday had closed above its settle; Monday closed below it. That flip isn't a rounding detail, it's a change of tone, and it says the selling wasn't a settlement quirk.
The driver was supply normalization, and it showed up before the day's headlines rather than after them. Word that about 40 tankers had cleared the Strait of Hormuz on Friday night with roughly 16 million barrels, plus a maritime threat downgrade for the Gulf of Oman, did the damage early: crude was already down 2.06 by 11:29, well before the Treasury Secretary spoke at 13:00. When the sanctions detail landed it stopped short of the major Chinese banks, a narrower result than feared, and the premium came out. The real signal came later. A missile-and-drone attack on a Saudi tanker off Yanbu and a refusal to rule out military force both crossed after the settle, and neither one drew a bid. A market that won't rally on that kind of news is signalling how little geopolitical premium it still wants to hold.
Supply normalizes while the trend refuses to break
The constructive case is structural and it's still standing. October sits above its 20, 50, 100 and 200-day averages, and the only line it lost Monday was the 5-day at 85.46. The directional readings back that up: positive direction beats negative direction on every window from 9 days to 100, the gap widens as the window shortens, and there's no inversion anywhere. Monday's 84.36 low retraced just 23 percent of the August run from 73.10 to 87.69, which is a shallow dip inside an advance, not the start of a rout. Even after a 2.35 percent down day the five-day change is still positive at 1.48 percent.
What's changed is momentum. Short-window stochastics are pinned near 90 while the fast line has crossed below the slow on both the 9 and 14-day settings, and a downward crossover from that far up the scale tends to lead multi-day corrections more often than one-day dips. The multi-indicator composite still reads 64 percent buy, but its three-day direction sub-reading has fallen to its weakest level. Then look at volatility. It's collapsed to about 27 percent over nine sessions against roughly 45 percent over twenty, the cleanest number in the set. A market letting that much air out while the geopolitical story cools is a market retiring a risk premium. Refining margins argue the pressure sits on the crude leg specifically, since cracks stay rich even as the barrel eases.
A shallow pullback that momentum has already turned
The plan sells strength, it doesn't chase weakness, because the counter-trend move is only two sessions old and the low held cleanly on its one test. Tuesday hands the market almost nothing: there's no inventory report and no energy release, so structure and Middle East headlines are the only two things that matter. Wednesday is where the week gets decided, with core inflation, growth data and the weekly crude report all stacked into one morning, so carrying real size into it is a poor use of risk. The overriding danger sits off the chart. The escalation track stayed busy all Monday and drew no response, but a market that ignores four headlines can lurch on the fifth, and the thin ground between about 82.5 and 81 means the first few dollars of any real break would travel fast.
Sell the confluence, respect 86.07, keep it small
The plan sells the 85.08 to 85.67 band, the overhead built by the second computed support at 85.08, the two-SD level at 85.09, the 85.46 five-day average and the one-SD line at 85.67, all of which were support on Monday and all of which failed. The stop is 86.15, just beyond the 86.07 first computed support that broke in the morning and was never retested from above, about 0.77 from a mid-zone entry near 85.38. Targets run to Monday's 84.36 low, then 83.77 where price crosses the nine-day average, then the 82.12 to 82.65 confluence band, for roughly 1 to 1.3, 1 to 2.1 and 1 to 3.5. A thirty-minute close above 86.07 reclaims the level and a move above the 86.57 high makes the gap-fill toward 87.06 the live scenario, so the short is simply wrong there. Any credible escalation, a strike on Iranian energy sites, a formal Hormuz restriction or a sanctions action naming Chinese refiners, voids the technical read at any price, which is why size stays built to survive being wrong overnight. performance methodology sets out how we grade the result.
Physical crude is moving through Hormuz again, the premium's coming out, and the market wouldn't bid even on a missile strike against a Saudi tanker. The trade is to sell the rally into the confluence, small, with an escalation headline the only thing that flips it.
A shallow pullback with momentum freshly rolled over is a sell into strength, not a grab at the low. Sell 85.38, respect 86.15, and keep the size small, because Wednesday's data wall is where this really gets decided.
This is the read our members get every session, before the bell, with the levels drawn and the setup defined. See how the same dealer-positioning work turns into systematic signals.
View pricingThe complete data picture
Every number behind Tuesday’s plan, charted first; the full numeric reference follows underneath.
Full numeric reference, every remaining figure from the review
| Average | Value | Settle vs |
|---|---|---|
| 5-day | 85.46 | below by 0.45 |
| 20-day | 80.97 | above by 4.02 |
| 50-day | 77.43 | above by 7.56 |
| 100-day | 79.88 | above by 5.11 |
| 200-day | 71.48 | above by 13.51 |
| Year-to-date | 74.72 | above by 10.27 |
| Level | Reference |
|---|---|
| 90.90 to 91.27 | fifty-two-week high and the strength-index 70 level, the far ceiling |
| 89.03 to 89.49 | upper four-way resistance grouping |
| 88.45 to 88.50 | one-SD and second computed resistance |
| 87.69 to 88.07 | the ceiling: one-month high, first computed resistance, derived target, thirteen-week high, and the heaviest overhead volume node |
| 87.06 | Friday's settle and the gap origin |
| 86.50 to 86.79 | gap-fill shelf: session open, high and central pivot |
| 86.07 | first computed support point, the level that defines the day |
| 85.46 | five-day average, the only average broken |
| 85.08 to 85.67 | sell-entry confluence: two-SD, second computed support, five-day and one-SD levels |
| 85.01 | October settle |
| 84.98 | electronic close, Tuesday's measured-from reference |
| 84.36 | session low and third computed support, target 1 |
| 83.31 to 83.77 | nine-day average cross and stochastic 70 level, target 2 zone |
| 82.12 to 82.65 | five-way band and 38.2% retracement of the August advance, target 3 |
| 80.40 to 80.97 | deepest support: twenty-day average, prior-week low and the dominant volume node |
| 73.10 | August 5 low, recovery base |
| Metric | Reading |
|---|---|
| Term structure | front-spread backwardation, a product-led bid beneath the barrel |
| Brent-WTI differential | Brent 92.17, 7.16 over WTI, both grades down an identical 2.35 percent |
| Gasoline crack | about 39.68 dollars per barrel on matched October contracts, historically rich |
| September product cracks | gasoline 3.2708 and diesel 4.2677 a gallon, wider still against 85.01 crude |
| Natural gas | September settled 2.7820, up 0.32 percent on heat forecasts, a move unrelated to crude |
| Open interest versus volume | 285,479 open against 194,389 traded, active two-way participation |
| Listed options surface | not available for crude |
| Cohort | Weekly change |
|---|---|
| Non-commercials | net long 122,090; 320,159 long vs 198,069 short, added 5,313 longs and covered 17,581 shorts |
| Managed money | net long 87,479; 195,538 long vs 108,059 short, added 4,984 longs and cut 2,579 shorts |
| Producers | added 19,134 shorts to 338,431 against 653,948 long, hedging the rally |
| Commercials | net short 153,087; added 20,927 shorts to 1,047,908 against 894,821 long (data Aug 18, stale, predates the high and the decline) |
| Input | |
|---|---|
| Dollar index | firmed about 0.15 percent to just under 99.00, a modest headwind |
| 10-year yield | 4.703 percent, down 0.019 on the Treasury buyback increase |
| Volatility index | 15.84, up 4.62 percent from a low base |
| Gold | 4,697.8, up 0.37 percent |
| Payrolls (prior) | minus 23,000 versus plus 80,000 forecast, a soft-demand signal |
| Retail sales (prior) | minus 0.6 percent versus plus 0.1 percent forecast |
| Crude inventories (prior) | a build of 4.405 million barrels, comfortable domestic supply |
| Brent crude | settled 92.17, down 2.22, an identical 2.35 percent decline |
| When | Event |
|---|---|
| Tue Aug 25 | no energy release; consumer confidence 90.2 and new home sales at 10:00, two-year auction 13:00, a structure-and-headlines session |
| Wed Aug 26 | core PCE 3.3 percent and GDP 1.5 percent at 08:30, weekly crude inventory 10:30 versus a prior 4.405 million build, semiconductor earnings 16:20, the week's real catalyst |
| Thu Aug 27 | jobless claims 08:30, seven-year note auction, central-bank symposium opens |
| Fri Aug 28 | benchmark payrolls revision 10:00 at 157,000 expected, final consumer sentiment, symposium continues |
The economic releases referenced above are published on the official government calendars below. Price levels are derived from standard technical and statistical methods, and the market read is AlgoIndex's own analysis. How we grade these calls is set out in our performance methodology.
- US Census Bureau, New Residential Construction (housing starts and building permits)
- US Bureau of Labor Statistics, Import and Export Price Indexes
- Federal Reserve, Industrial Production and Capacity Utilization (G.17)
- Federal Reserve, FOMC calendar and meeting minutes
- US Department of the Treasury, auction schedule and results
- AlgoIndex performance methodology



