
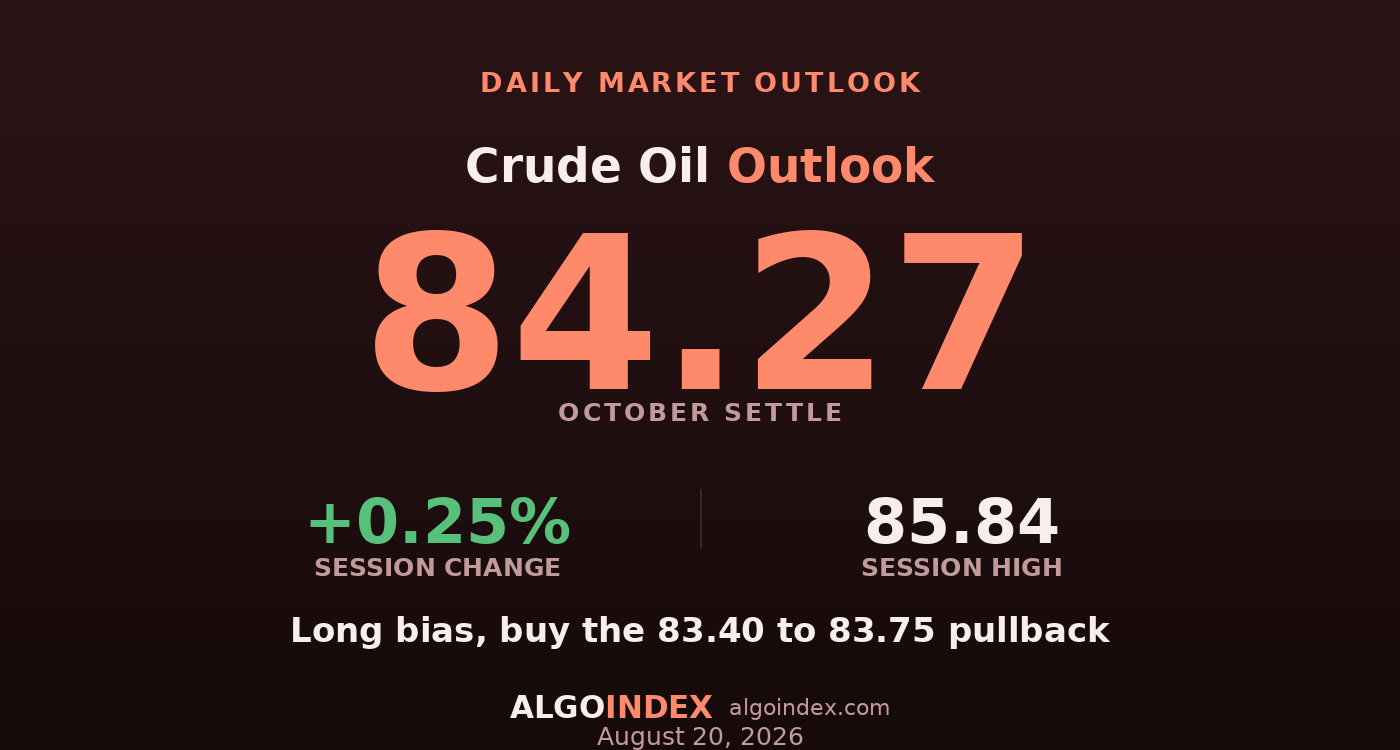
Crude finished a fourth straight advancing session, but how it finished matters more than that it did. The expiring September contract settled at 85.83, a four-week high, while October, the new benchmark on which every level here is quoted, closed at just 84.27, up 0.25 percent, within two cents of its own daily pivot. A session that was up 1.78 dollars at its best gave almost all of it back and ended exactly where the math said the market was balanced.
The settle and the electronic close disagree, and the direction flipped from the day before. Tuesday the strength came after the settle and crude traded higher into the evening; Wednesday the strength was struck into the settlement window and the drift afterward was lower, leaving the close well beneath the day's best. A move from close-above-settle to close-below-settle inside two sessions is a change of tone, and it's the first sign in this advance that supply-driven buying is meeting a seller.
Barrels that cannot move, and barrels piling up
The supply case is intact and getting louder. The Strait of Hormuz remains closed, the UAE cut all economic ties with Iran after accusing it of firing missiles at its territory, and the curve carries steep backwardation with the middle-distillate crack above 100 dollars. The trend readings confirm it, accelerating on every window with the positive directional line leading throughout and no inversion anywhere in the table.
The demand side is pulling the other way. The weekly inventory report printed a build of 4.4 million barrels against a 0.2 million forecast, the second outsized build in a row, and gasoline supplies rose as that product fell on a day crude rose. The market is being told at once that barrels cannot move and that barrels are piling up, which is exactly what a transit blockage looks like from inside the consuming country. And a chunk of Wednesday's gain was bought with a weaker dollar rather than tighter barrels, so a dollar bounce would remove more of this advance than it would have removed of Tuesday's.
A supply bid meeting a seller
The setup is a pullback purchase, and it isn't a breakout chase. Four advancing sessions into a bearish inventory surprise, a close beneath the session average price, short-window stochastics above 90, and a below-average range together describe a market that needs to digest before it extends. Crude carries no listed options surface, so the read comes from the physical complex: backwardation, a Brent premium above seven dollars, and a distillate crack above 100, all still pointing higher underneath the near-term fatigue. The overriding risk is a headline. A Hormuz reopening or a US-Iran understanding removes the supply premium in minutes, with the early-August move to 73 the benchmark for how fast that travels.
Buy the pullback, honor the base
The plan buys the 83.40 to 83.75 band on a pullback, the area formed by the session low at 83.45 and the pivot support just beneath, rather than chasing the ceiling that rejected twice. The stop is 82.90, below the entire immediate base at 83.00 and 83.21 but above the deeper 82.14 to 82.35 confluence, so it exits before the deeper band is tested, about 0.68 of risk from the middle of the entry. Targets run to the 84.53 pivot, then the 85.60 ceiling, then the 86.92 confluence. A sustained loss of 83.00 opens the transacted-business vacuum toward 82.35 and completes the four-session advance, and any credible Hormuz-reopening headline voids the long at any price, which is why size stays below normal. performance methodology sets out how we grade the result.
The strait is closed and the barrels are piling up at the same time, and crude gave back nearly two dollars of gain to close on its own pivot. The trade is the pullback into support, with the whole structure hostage to a headline.
An accelerating supply trend meeting its first seller is a buy on the dip, not a chase at the ceiling. Buy 83.50, honor 83.00, and respect the headline that no chart can price.
This is the read our members get every session, before the bell, with the levels drawn and the setup defined. See how the same dealer-positioning work turns into systematic signals.
View pricingThe complete data picture
Every number behind Thursday’s plan, charted first; the full numeric reference follows underneath.
Full numeric reference, every remaining figure from the review
| Average | Value | Settle vs |
|---|---|---|
| 5-day | 82.78 | above by 1.49 |
| 20-day | 80.64 | above by 3.63 |
| 50-day | 77.26 | above by 7.01 |
| 100-day | 79.65 | above by 4.62 |
| 200-day | 71.09 | above by 13.18 |
| Year-to-date | 74.50 | above by 9.77 |
| Level | Reference |
|---|---|
| 88.07 | one-month high, third pivot confluence |
| 86.92 to 87.02 | second pivot resistance, crossover stall |
| 85.60 to 85.84 | three-way ceiling band, target 2 |
| 85.15 to 85.28 | eighteen-day stall and projected target |
| 84.53 | derived pivot, target 1 |
| 84.27 | October settle |
| 84.06 | prior close, bias line |
| 83.40 to 83.75 | entry band, session low and first pivot support |
| 83.00 to 83.21 | second pivot support, invalidation base |
| 82.14 to 82.35 | three-way confluence, last defence |
| 80.49 to 80.82 | first true shelf, largest volume node |
| 73.10 | one-month low, recovery base |
| Metric | Reading |
|---|---|
| Term structure | backwardation, September 85.83 vs October 84.27 |
| Curve, December | more than 3 dollars beneath October |
| Brent-WTI differential | Brent 91.62, 7.33 over October |
| Distillate crack | above 101 dollars per barrel |
| Gasoline crack | about 50.88 dollars, gasoline down 1.41% |
| Listed options surface | not available for crude |
| Cohort | Weekly change |
|---|---|
| Commercials | net short 129,637; shorts -14,319 |
| Non-commercials | net long 99,196; shorts +19,252 |
| Managed money | added 8,078 shorts vs 1,036 longs |
| Swap dealers | shorts cut 18,146 to 578,142 (data Aug 11, stale) |
| Input | |
|---|---|
| Crude inventories | build 4.405M vs 0.2M forecast |
| Prior inventories | build of 17.423M barrels |
| Dollar index | 98.796, down 0.85%, 2.5-month low |
| 10-year yield | 4.655, down 1.13% |
| Gold | 4,545.3, up 2.82% |
| Retail sales | minus 0.6% vs plus 0.1% forecast |
| UAE-Iran | UAE cut all economic ties with Iran |
| When | Event |
|---|---|
| Thu Aug 20 | jobless claims and Philadelphia Fed 08:30, no energy release |
| Fri Aug 21 | global flash PMIs, US composite 09:45 |
| Tue Sep 9 | government short-term energy outlook |
| Sep 16 | Federal Reserve rate decision |
The economic releases referenced above are published on the official government calendars below. Price levels are derived from standard technical and statistical methods, and the market read is AlgoIndex's own analysis. How we grade these calls is set out in our performance methodology.
- US Census Bureau, New Residential Construction (housing starts and building permits)
- US Bureau of Labor Statistics, Import and Export Price Indexes
- Federal Reserve, Industrial Production and Capacity Utilization (G.17)
- Federal Reserve, FOMC calendar and meeting minutes
- US Department of the Treasury, auction schedule and results
- AlgoIndex performance methodology



