
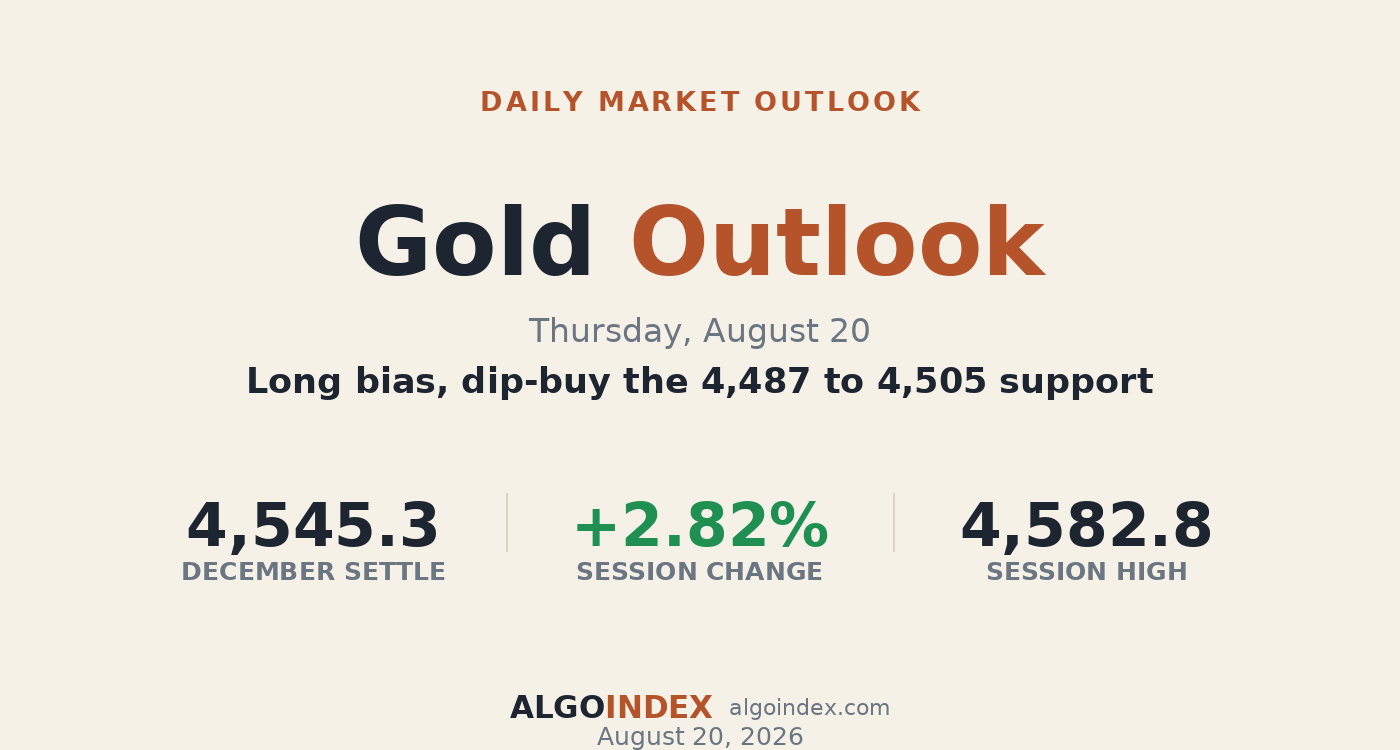
Gold delivered its most decisive session in weeks. The December contract settled at 4,545.3, up 2.82 percent, and the day was a one-way advance from a 4,378 open near the low to a 4,583 high, the strongest print in more than two months. This was an impulsive breakout out of a multi-week consolidation, not a two-sided grind.
The catalyst arrived on three fronts at once. The Treasury signaled larger long-end buybacks and issuance to relieve borrowing costs, which knocked the dollar down 0.85 percent and pulled the ten-year yield lower by more than a percent. A falling dollar and falling real yields are the two cleanest inputs into a gold bid, and the metal took both. Softer labor and consumption data kept investor demand firm, and the unresolved Iran situation supplied a background safe-haven premium.
A breakout that closed on its highs
The trend evidence is unambiguous. Spot sits above the five, twenty and fifty-day averages, it recaptured the 100-day, and the directional index reads a genuine impulse with the positive line dominating on the fast windows. The multi-indicator composite has firmed to a strong buy. It's a market that broke out on a clean macro catalyst and held the move.
The one detail that changes the read is where the day ended. The official settle at 4,545 was struck before the last headlines, and the post-settle electronic market pushed on to the 4,583 high, closing materially above the settle near 4,575 to 4,581. The buyers were still in control when the pit closed and didn't fade the move. The only caution is a stretched short-term momentum reading, the nine and fourteen-day stochastics pinned above 99, into a defined overhead band, which argues for buying a pullback rather than chasing the print.
Buy the retest, not the print
The plan doesn't chase an overbought breakout into resistance. It buys the first controlled pullback into former resistance that becomes support, the 4,487 to 4,505 band where the first standard-deviation level, the first pivot support and the prior-week high align, with the recaptured 100-day just beneath. The options proxy shows an implied-volatility percentile near the middle of its range, so the market isn't pricing panic even after a 2.8 percent day. The risk to the whole picture is a dollar rebound or a spike in real yields on the one o'clock inflation-protected auction, which is the one scheduled event that can undo the catalyst.
Dip-buy the breakout, or the clean break
The primary plan buys a pullback into the 4,487 to 4,505 band, the first-standard-deviation and pivot support that aligns with the prior-week high and the recaptured 100-day. The stop is below 4,420, beneath the 4,432 pivot and the previous close, so a held break there flips the breakout to a failure, about 76 points of risk. Targets run to the 4,542 recaptured shelf, then the 4,582 high, then the 4,609 level where relative strength reaches 70. There is a second way in. A clean, held break above 4,583 targets 4,591 then 4,609 with a stop back below 4,542, the higher-momentum entry taken only if the dollar and yields extend. A sustained loss of 4,420 voids the long, and a sharp dollar rebound on the auction argues for standing aside. performance methodology explains how we grade both paths.
Gold broke out on a falling dollar and falling real yields, and the electronic close finished above the settle. When the pit closes with buyers still bidding, the pullback is a purchase, not a fade.
A clean breakout that closes on its highs is a buy on weakness, and it's not a chase at the wall. The dip into 4,500 pays better than the print, and it risks less.
This is the read our members get every session, before the bell, with the levels drawn and the setup defined. See how the same dealer-positioning work turns into systematic signals.
View pricingThe complete data picture
Every number behind Thursday’s plan, charted first; the full numeric reference follows underneath.
Full numeric reference, every remaining figure from the review
| Average | Value | Settle vs |
|---|---|---|
| 5-day | 4,466.4 | settle above by about 79 |
| 20-day | 4,287.3 | above by about 258 |
| 50-day | 4,229.8 | above by about 315 |
| 100-day | 4,484.8 | recaptured, above by about 60 |
| 200-day | 4,625.1 | below by about 80, next test |
| Year-to-date | 4,690.2 | below |
| Level | Reference |
|---|---|
| 4,693.0 | 13-week high |
| 4,625.1 | 200-day average, next structural test |
| 4,609.1 | RSI-70 level |
| 4,591.2 | third pivot resistance |
| 4,582 to 4,585 | session high, one-month high, 1.618 projection |
| 4,545.3 | December settle |
| 4,540 to 4,542 | 1.272 projection, second pivot resistance |
| 4,487 to 4,505 | first-SD, first pivot support, prior-week high, entry |
| 4,484.8 | 100-day average, recaptured |
| 4,432.3 | daily pivot, healthy-versus-failed line |
| 4,378.0 | session low, first pivot support 4,371.6 |
| 4,322.5 | second pivot support, deeper reversion |
| Metric | Reading |
|---|---|
| Gold-ETF proxy last | 414.93, up 4.12% from 398.53 |
| Net call gamma | about minus 396 million |
| Put gamma | about plus 119 million |
| Put-to-call OI ratio | 0.46, call-heavy |
| Implied-vol rank | 27.92 percent |
| One-month implied vol | 21.87 percent vs realized 23.46 percent |
| High-vol reference | about 396 proxy, downside pivot |
| Heaviest dealer expiry | mid-September |
| Input | |
|---|---|
| Dollar index | down 0.85% to about 98.80 |
| 10-year yield | down 1.13% to about 4.655% |
| Retail sales | minus 0.6% vs positive forecast |
| Core CPI | in line, unthreatening |
| WTI crude | up about 1.05% near 85.83 |
| Volatility index | down 6.12% to about 14.88 |
| Bitcoin | up more than 7% |
| When | Event |
|---|---|
| Thu Aug 20 08:30 ET | jobless claims, regional manufacturing index |
| Thu Aug 20 11:10 ET | regional Fed speaker, swing factor |
| Thu Aug 20 13:00 ET | 30-year inflation-protected auction, real-yield event |
| Fri Aug 21 09:45 ET | flash purchasing-manager indices |
| Mid-September | next scheduled policy decision |
The economic releases referenced above are published on the official government calendars below. Price levels are derived from standard technical and statistical methods, and the market read is AlgoIndex's own analysis. How we grade these calls is set out in our performance methodology.
- US Census Bureau, New Residential Construction (housing starts and building permits)
- US Bureau of Labor Statistics, Import and Export Price Indexes
- Federal Reserve, Industrial Production and Capacity Utilization (G.17)
- Federal Reserve, FOMC calendar and meeting minutes
- US Department of the Treasury, auction schedule and results
- AlgoIndex performance methodology



