
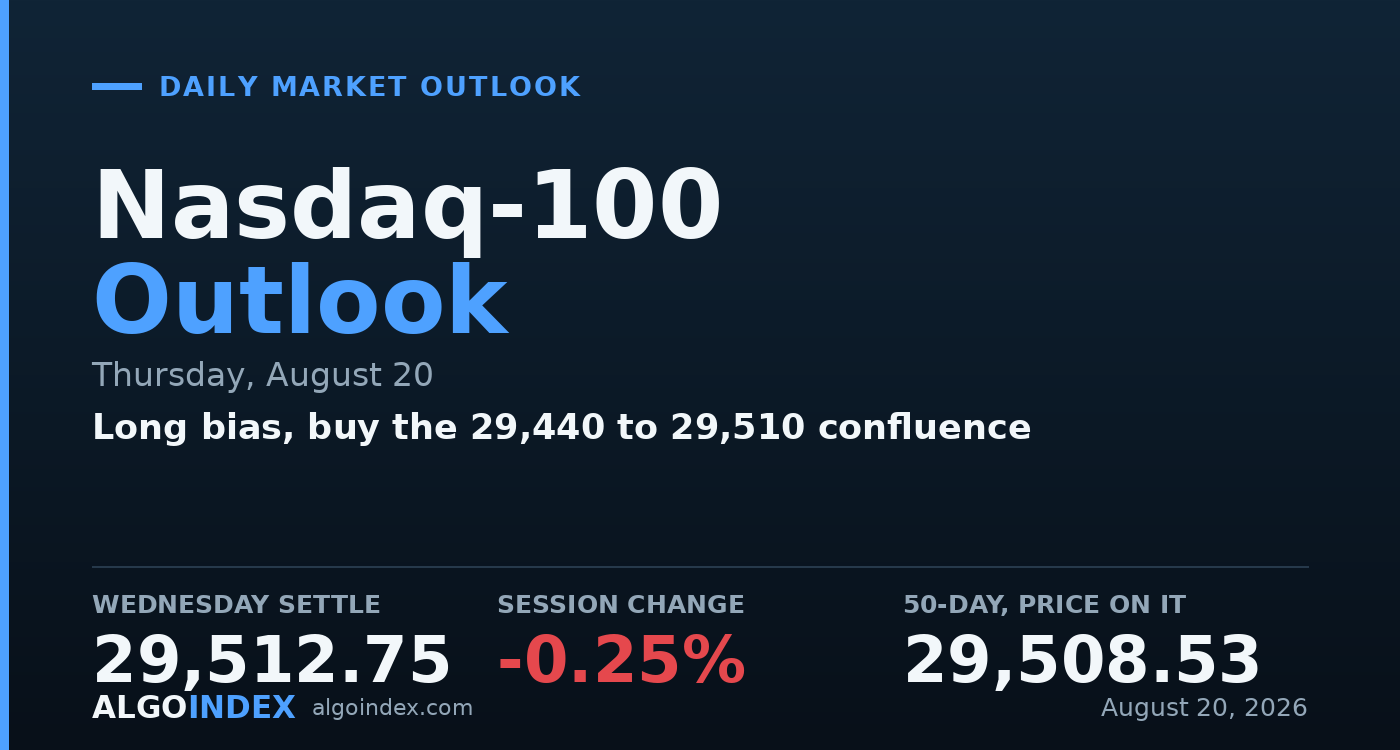
The Nasdaq 100 fell 0.25 percent on Wednesday to settle at 29,512.75, and where it settled matters more than that it fell. Three independent lines converge inside a ten-point band right here: the 50-day average at 29,508, the dealer gamma flip near 29,503, and the pivot equilibrium. Price closed sitting directly on top of them. Above that band the options environment dampens; below it, hedging turns pro-cyclical and amplifies whatever direction price takes.
The day itself was two-sided. The Treasury's buyback and issuance news knocked the dollar to a three-month low and pulled yields lower, and the broad market took the relief, with the S&P and Dow both up about 0.2 percent. But semiconductors fell about 2 percent for another session, and that single sector was enough to hold the Nasdaq negative while everything else rose. Money left the year's most crowded trade and went into healthcare and biotech instead.
Resting on the line that decides the session
The near-term picture is washed and constructive. The nine-day stochastic sits near 14, about as discharged as it gets, and the evening session has already reclaimed roughly 90 points off the settle. The macro backdrop, falling yields, a three-month low in the dollar, and a 6 percent drop in the volatility index, actively supports a recovery. The obstacle is confined to one sector, which is why this is a buy-the-confluence trade, and it's not a call on the whole market.
The reason it's conditional is the mechanics beneath the band. The index proxy carries a negative gamma notional while the broad market carries a positive one, which is the mechanical explanation for why the Nasdaq has travelled further than the S&P on identical news all week. Sitting on the flip, the market is balanced on the exact line between dampening and amplifying. Hold it and the recovery has room; lose it on soft data and the same short-gamma condition that cushions nothing turns the decline pro-cyclical.
One band, two environments
The whole trade is the band. Hold the 29,503 to 29,509 confluence and the path opens to the 29,610 retracement and the 29,687 inflection, where the environment turns dampening again. Lose it and the amplifying environment beneath takes over, with 29,460 then the 29,375 week low coming quickly. A skew reading near 80 shows that downside protection carries a premium. The setup remains inactive during the one o'clock auction. This is a location trade with a hard line, and it isn't a directional bet.
Buy the confluence, respect the line
The plan buys the 29,440 to 29,510 band, anchored on the 50-day and the gamma flip, and only while that band holds through the 08:30 data. The stop is 29,362, beneath the session and week low at 29,375 and the 40-day crossing, about 113 points from the entry midpoint. Targets run to the 29,610 retracement, then the 29,721 pivot just below the inflection, then the 29,842 reclaim line if chips stabilize. A fifteen-minute close beneath 29,375 kills the thesis and inverts it toward 29,340 and the 29,187 base, and a Philadelphia survey well beneath its 24.75 forecast voids the long in real time by validating the growth-deceleration read. performance methodology covers how we score it.
Three lines meet in a ten-point band and the market closed sitting on them. Above, the environment absorbs; below, it amplifies. Thursday's data decides which one Thursday gets.
A washed oscillator on a three-line confluence, with the evening already recovering, is a buy while the band holds. The whole trade is the line at 29,375.
This is the read our members get every session, before the bell, with the levels drawn and the setup defined. See how the same dealer-positioning work turns into systematic signals.
View pricingThe complete data picture
Every number behind Thursday’s plan, charted first; the full numeric reference follows underneath.
Full numeric reference, every remaining figure from the review
| Average | Value | Settle vs |
|---|---|---|
| 5-day | 29,905.00 | below by about 392 |
| 20-day | 29,171.68 | above by about 341 |
| 50-day | 29,508.53 | sitting on it, about 4 above |
| 100-day | 28,733.56 | above by about 779 |
| 200-day | 27,237.38 | above by about 2,275 |
| Year-to-date | 27,551.13 | above |
| Level | Reference |
|---|---|
| 31,100.00 | 52-week and 13-week high |
| 30,343.00 | prior month high, week high |
| 29,930 to 29,976 | second pivot and two-SD resistance |
| 29,842.66 | nine-day reclaim line |
| 29,721 to 29,757 | first pivot resistance, session high |
| 29,610.77 | 38.2% retracement, first shelf |
| 29,548.58 | pivot point, equilibrium |
| 29,503 to 29,509 | 50-day and gamma flip band, key line |
| 29,440 to 29,510 | primary long entry band |
| 29,375.75 | session low, week low, 40-day crossing |
| 29,187 to 29,312 | put side base and computed target |
| Metric | Reading |
|---|---|
| Proxy fund last | 716.08, down 0.21% |
| Gamma notional | negative 141.2 million, short gamma |
| Gamma tilt | 0.915, below neutral |
| Dealer gamma flip | 29,503 futures, price on it |
| Volatility inflection | 29,687 futures |
| Put side support base | 29,187 futures |
| Proxy put-to-call OI | 1.17, puts heavier |
| Implied-vol rank | 29.75 percent |
| Skew rank | 79.76 percent |
| Input | |
|---|---|
| Dollar index | 98.767, down 0.88%, three-month low |
| 10-year yield | 4.655%, down about 5 bp |
| Gold | above 4,500 cash, up strongly |
| Bitcoin | above 69,000, up more than 7% |
| Volatility index | 14.88, down 6.12% |
| S&P 500 / Dow | up 0.21% / up 0.22% |
| WTI crude | 84.38, effectively unchanged |
| When | Event |
|---|---|
| Thu Aug 20 | jobless claims and Philadelphia Fed 08:30, 30-yr TIPS 13:00 |
| Fri Aug 21 | flash PMIs 09:45, monthly options expiration |
| Tue Aug 26 | dominant chipmaker earnings, PCE week |
| Aug 27-29 | central-bank symposium |
The economic releases referenced above are published on the official government calendars below. Price levels are derived from standard technical and statistical methods, and the market read is AlgoIndex's own analysis. How we grade these calls is set out in our performance methodology.
- US Census Bureau, New Residential Construction (housing starts and building permits)
- US Bureau of Labor Statistics, Import and Export Price Indexes
- Federal Reserve, Industrial Production and Capacity Utilization (G.17)
- Federal Reserve, FOMC calendar and meeting minutes
- US Department of the Treasury, auction schedule and results
- AlgoIndex performance methodology



