
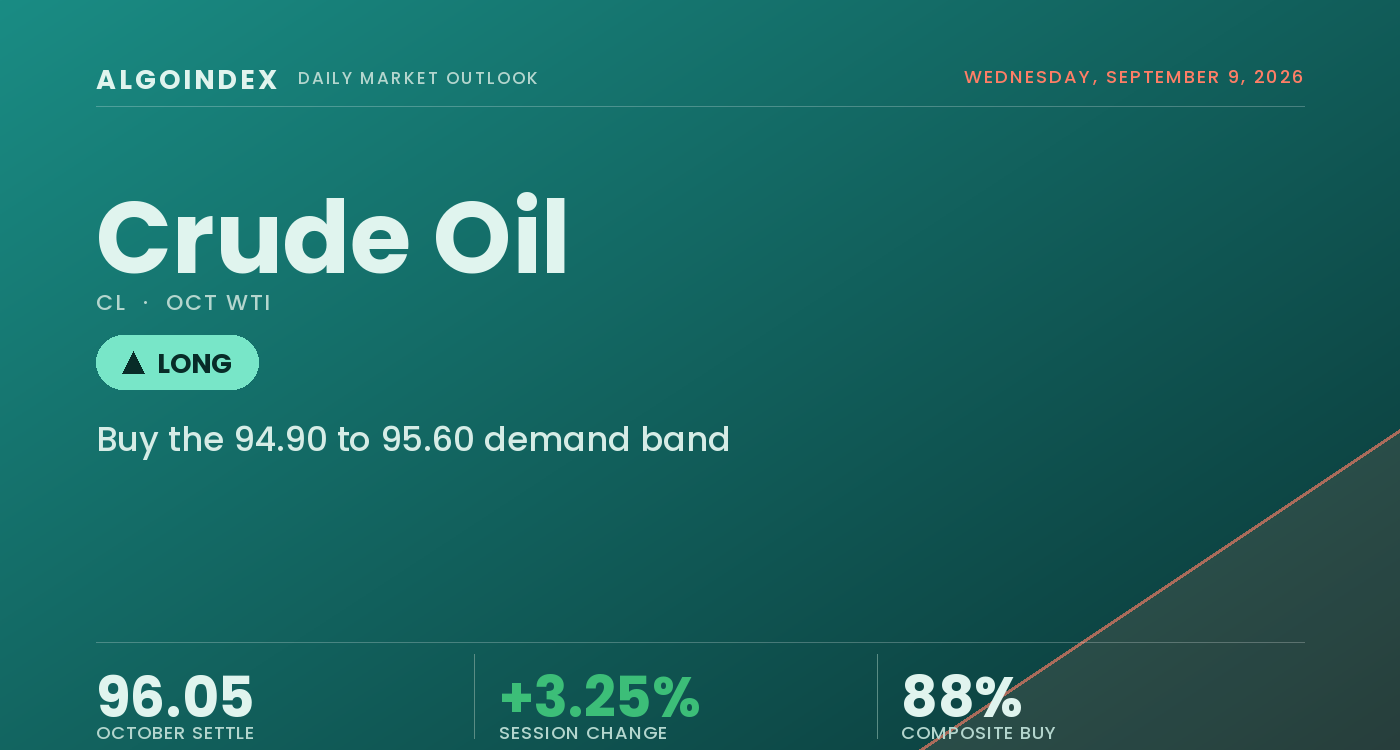
Crude oil settled Wednesday at 96.05, higher by 3.02 dollars or 3.25 percent from Tuesday's 93.03 close, on the fifth consecutive session of gains. The October contract opened at 94.31, already 1.28 above the prior settlement, and never filled the gap; the 93.76 low came early and held above the prior settlement, so at no point did the advance surrender its overnight gain, and the market pushed to a 96.93 high that is the highest price the October contract has traded before settling in the upper 72 percent of a 3.17 dollar range. Volume of roughly 297,000 contracts ran at about 120 percent of the 248,193 20-day average, so the advance carried participation rather than drifting higher on a thin book. A market that gaps up, defends the higher band for the entire session and settles near its high is being accumulated rather than distributed, and five straight up days with no lower low describe a trend rather than a reaction, the five-day change now plus 6.61 dollars or 7.33 percent.
The session's defining feature is a physical signal running well ahead of a stretched momentum profile, and where the contract traded after the settlement confirms it. WTI settled 96.05 at 02:31 PM ET, but the post-settlement quote near 05:07 PM ET read 96.65 bid at 96.71 offered, roughly 0.63 above the settlement and within 0.28 of the session high, and the market declined to sell into a brief run of de-escalation-flavoured headlines that crossed in the afternoon. The mechanical cause of the advance is supply risk rather than demand or the dollar, the dollar index closing essentially unchanged at 98.791, down 0.05 percent, on a sequence of reports covering strikes involving Iranian tankers and Saudi refining infrastructure. The structural contradiction into Thursday is between an unusually strong physical read and an unusually stretched one. The moving-average stack is in full bullish order, the multi-indicator composite reads 88 percent buy, and the front-month to second-month spread widened to plus 3.18 with a gain of 11.97 percent on the session, steep backwardation getting steeper. Against that, the 14-day relative strength reading is 75.74, the 9-day is 83.72, the 14-day stochastic sits at 91.96, and the settlement is 11.3 percent above the 20-day average, so the cost of chasing here is high, and the crude options market agrees with implied volatility on the oil index closing 49.85, up 2.59 percent.
Above every average with a composite at 88 percent buy, and stretched
The constructive read starts with location. The 96.05 settlement sits above every average in the study, the 5-day at 92.73, the 20-day at 86.32, the 50-day at 80.81, the 100-day at 81.11 and the 200-day at 73.06. The distance above the 20-day is 9.73 dollars, an extension of 11.3 percent, and the settlement stands 22.99 above the 200-day, an extension of 31.5 percent. The multi-indicator composite reads 88 percent buy overall, the short-term and medium-term groups both at 100 percent positive, the long-term group at 33 percent held back solely by the 50-day at 80.81 sitting marginally beneath the 100-day at 81.11, and the composite directional strength registers in the top 1 percent of its historical distribution. The 9-day directional index has reached 33.88 with the positive component at 38.54 against 10.69 negative, and the 14-day at 23.60 confirms trend conditions while still rising from a 20-day reading of 18.38, so the trend measure itself is strengthening rather than maturing. The swing sequence remains an unbroken series of higher highs and higher lows, the advance from the August 10 low at 76.80 having carried 20.13 dollars or 26.2 percent to the 96.93 high.
What argues the other way is the extension and the momentum. The settlement sits 9.73 dollars above the 20-day at a moment when the 14-day average true range is 3.43, so nearly three sessions of normal range separate spot from its own mean, and mean reversion does not require a bearish catalyst from here. Stochastics are the more emphatic warning, the raw reading above 99 percent across every period at 99.39 on the 9-day, 99.42 on the 14-day and 99.43 on the 20-day, with percent K at 91.96, so the contract is closing at the very top of its recent range on every lookback. The 9-day relative strength at 83.72 is well above the overbought line, with the 14-day at 75.74 also above it and the 20-day at 69.95 just beneath, readings that high describing a market with little unused upward momentum in the short run. The counterweight is that in an environment driven by supply headlines these oscillators are less predictive than usual, because a market repricing a physical risk does not mean-revert on an oscillator schedule; the reading defines the risk in a pullback, since the advance left almost no near-term support behind it until the prior settlement region.
The 95.45 to 95.58 confluence and the 96.93 high frame Thursday
Two structures frame the session. Beneath price, the recomputed 95.58 pivot and the 95.45 one standard deviation support sit on top of each other, forming a 95.45 to 95.58 confluence that is the tightest support structure on the board and the anchor for the plan, with the 94.23 to 94.31 area where the first pivot support meets the session open forming the lower boundary of a constructive pullback and the 93.76 session low beneath as the first genuine structural break. Overhead, the 96.68 post-settlement quote is the first price the contract must reclaim on the reopen, above it the 96.93 session high and new 52-week high form the immediate ceiling, and beyond that the 97.10 to 97.40 zone where the moving-average crossover stall, the 97.23 three standard deviation band and the recomputed first resistance stack into a triple confluence. Thursday is dense rather than empty. The producer-group monthly report at 08:00 AM ET, a European central bank decision at 08:15 AM ET and United States producer prices at 08:30 AM ET overlap into a disorderly block, and the delayed weekly government inventory report at 12:00 PM ET is the first-order event for crude specifically, consensus a 1.5 million barrel draw against a prior 4.450 million. Crude has no liquid options proxy, so positioning is read from the weekly commitments data, the steepening forward curve, the refined-product margins and the futures structure.
Buy the pullback into 95.45, respect 93.70, size for the headline
The plan buys the 94.90 to 95.60 band on a pullback, favouring the recomputed pivot and one standard deviation support confluence over a chase into the 96.68 post-settlement quote, and produces materially better geometry than paying the reopen. The stop is 93.70, beneath Wednesday's 93.76 session low, the level whose loss surrenders the entire unfilled gap from Tuesday's settlement and overruns the buyers who defended the day, a buffer of roughly 1.55 dollars from the entry midpoint that sits outside the 3.43 dollar average true range noise band. Targets step to 97.40, the recomputed first resistance and first mechanical objective above the 96.93 contract high, then 98.75, the recomputed second resistance inside the one average-true-range band, then 100.57, the recomputed third resistance at the round 100 dollar level only on momentum extending through target two on expanding volume, for reward-to-risk of roughly 1 to 1.4, 1 to 2.3 and 1 to 3.4 from the entry midpoint. The defining risk is two-sided and macro. A credible negotiation or ceasefire headline involving Iran removes this setup in real time regardless of price location, because the premium being traded is a supply-risk premium rather than a demand or inventory premium, and the eight-day-old speculative length would liquidate into that move. In the opposite direction, a strike on or closure affecting Persian Gulf maritime transit would gap the contract through every resistance level listed and make the entry zone unreachable, in which case the setup is void because the entry was never available and should not be chased. A crude build against the consensus draw at Thursday's 12:00 PM ET inventory report, particularly one paired with a distillate build, degrades the thesis without ending it and argues for reducing rather than exiting, while a settlement below 93.76 ends the thesis outright. Position sizing sits at one half to two-thirds of an equity-index equivalent given a 3.55 percent average true range as a share of spot and the two-sided overnight gap exposure. Our published performance methodology sets out how these calls are graded.
The contract gapped above the prior settlement, defended the higher band all session, printed a new 52-week high at 96.93 and settled 96.05 in the upper 72 percent of the range on volume above the average, then held 63 cents higher at a 96.68 post-settlement quote despite afternoon de-escalation language. Steep and steepening backwardation argues for buying a pullback into the 95.45 to 95.58 pivot confluence rather than chasing the post-settlement quote, sized for a two-sided supply catalyst on a Thursday carrying a central bank decision, producer prices and a delayed inventory count, and a durable de-escalation is the one development that flips the read.
A supply-tight market that holds above every moving average and prints a new 52-week high but sits with a 9-day relative strength index near 84 is a market to buy on a pullback rather than a print to chase. The plan favours the 94.90 to 95.60 band, respects 93.70 and keeps size measured, because the constraint can escalate or resolve on a single headline in either direction, with a European central bank decision, United States producer prices and a delayed weekly inventory count all landing on Thursday to resolve or extend it.
This is the read our members get every session, before the bell, with the levels drawn and the setup defined. See how the same dealer-positioning work turns into systematic signals.
View pricingThe complete data picture
Every number behind Thursday’s plan, charted first; the full numeric reference follows underneath.
Full numeric reference, every remaining figure from the review
| Average | Value | Settle vs |
|---|---|---|
| 5-day | 92.73 | above by 3.32 |
| 20-day | 86.32 | above by 9.73 |
| 50-day | 80.81 | above by 15.24 |
| 100-day | 81.11 | above by 14.94 |
| 200-day | 73.06 | above by 22.99 |
| Level | Reference |
|---|---|
| 101.76 | the projection of where the 14-day relative strength measure would reach 80 percent, an extension marker for a supply-shock continuation |
| 100.57 | the recomputed third resistance at the round 100 dollar level, the terminal objective for a strong continuation |
| 98.75 | the recomputed second resistance inside the one average-true-range envelope, target two, the objective a sustained advance works toward |
| 97.10 to 97.40 | the recomputed first resistance, the three standard deviation band at 97.23 and the moving-average crossover stall, a triple confluence and target one above the contract high |
| 96.93 | the session high and highest October contract trade, the immediate ceiling whose clean break on volume activates the upper ladder |
| 96.68 | the post-settlement electronic quote, the first reference the contract must reclaim on the reopen, within 28 cents of the high, not a closing price |
| 96.46 | the two standard deviation band, the first level a fading market would need to reclaim and the first it would lose |
| 95.45 to 95.58 | the one standard deviation support and the recomputed pivot stacked together, the tightest support confluence on the board and the anchor for the primary setup |
| 94.90 to 95.60 | the primary buy band and entry, a pullback into the pivot confluence rather than a chase of the post-settlement quote |
| 94.23 to 94.31 | the recomputed first support and the session open, the natural lower boundary of a constructive pullback |
| 93.76 | the session low and first genuine structural break level, a trade below it surrendering the entire gain from the open |
| 93.70 | the protective stop beneath the session low, total risk about 1.55 from the entry midpoint |
| 93.03 | Tuesday's settlement and the completion of the gap fill, a close back here erasing the day |
| 92.41 to 92.73 | the recomputed second support and the 5-day average, a support base and the first genuine mean reversion of the current leg |
| 91.06 | the recomputed third support, reachable only on a de-escalation headline or an inventory surprise of real size |
| 90.61 | the one standard deviation support band, the deepest level worth mapping for a single session, 5.44 beneath the settle |
| 86.32 | the 20-day moving average, 9.73 beneath the settle, the clearest mean-reversion reference |
| 80.81 to 81.11 | the 50-day and 100-day moving averages, the lone lagging crossover, a residue of the summer decline |
| 73.06 | the 200-day moving average, 22.99 beneath the settle, the plainest statement of how far this move has carried |
| Metric | Reading |
|---|---|
| Options surface | no liquid crude options proxy, the available exchange-traded fund surface is too thin and too impaired by curve costs to carry information, so positioning is read from the physical and futures complex and no level in this review is derived from an options surface |
| Crude volatility index | the oil volatility index closed 49.85, up 2.59 percent, a materially elevated reading that prices a wide two-way distribution rather than a directional certainty |
| Forward curve | the front-month to second-month spread widened to plus 3.18, a gain of 11.97 percent on the session, backwardation of a shape that says the physical market pays a premium for immediate barrels |
| Refining margins | the distillate margin computes near 105.59 dollars a barrel against a gasoline margin near 38.80, describing a system straining to produce middle distillates with distillate the tightest point in the barrel |
| Benchmark to WTI | the waterborne benchmark settled 101.21 against WTI 96.05, a 5.16 differential, the benchmark 3.36 percent gain edging WTI 3.25 percent, consistent with seaborne and Gulf-region supply risk |
| Historic volatility | 33.94 percent over 14 days against 31.41 percent over 20 and 22.55 percent over 9, so realised movement remains elevated across the medium windows |
| Product prices | front distillate at 4.8010 a gallon at the highest close since 2022, gasoline at 3.2106 down 1.29 percent and natural gas at 2.8220 down 3.22 percent, the gas divergence isolating the bid to oil-specific supply risk |
| Weekly turnover | volume of roughly 297,000 contracts at about 120 percent of the 248,193 20-day average confirms genuine participation rather than a thin drift higher |
| Cohort | Weekly change |
|---|---|
| Technical positioning | the multi-indicator composite reads 88 percent buy overall, the short-term and medium-term groups both at 100 percent positive with the long-term group at 33 percent held back solely by the 50-day at 80.81 against the 100-day at 81.11, price above every moving average, and the composite directional strength registering in the top 1 percent of its historical distribution |
| Directional spread | the 14-day directional index at 23.60 with the positive directional indicator 35.17 against 13.29 negative, a 21.88 spread better than two to one, and the 9-day reaching 33.88 with a 38.54 against 10.69 split, a trend strengthening rather than exhausting that qualifies the overbought oscillator readings |
| Managed money | a net long of 94,281 as of the week ended September 1, 205,300 long against 111,019 short at a 1.85 ratio, longs up 8,418 and shorts down 1,843, speculative length added into strength before the escalation sequence |
| Producer hedging | producers net long 309,402 and swap dealers net short 465,407, while commercials held 885,135 long against 1,041,140 short for a net short of 156,005, both sides reduced on the week |
| Positioning staleness | the report is current only to September 1, eight days old and predating the entire escalation sequence, so it describes the market posture before the move and actual current length is very likely higher than reported |
| Coverage note | crude carries no liquid options-positioning proxy, so positioning is built from the weekly commitments data, the front-to-second-month spread that widened to plus 3.18 and gained 11.97 percent on the session, the refined-product margins and the futures technical structure |
| Input | |
|---|---|
| Dollar index | 98.791, softer by 0.045 or 0.05 percent, effectively flat, which removes the usual inverse currency channel and leaves the entire 3.25 percent advance to be explained by the oil-specific supply story |
| Equity and volatility | the broad index settled 7,636.36 down 0.48 percent, technology off 0.30 percent, the industrial average off 0.77 percent and small caps off 1.37 percent, equity volatility up 4.84 percent to 16.47, while the energy sector proxy rose 0.83 percent, the internally consistent pattern for a supply-driven crude rally |
| Yields and auctions | the ten-year yield rose 1.11 percent to 4.845 and the ten-year auction cleared at a high yield of 4.834 percent against 4.683 percent previously with a bid-to-cover of 2.710 against 2.530, institutional commentary tying rising oil, food and metals prices directly to higher global yields |
| Precious metals | gold rose 0.49 percent and silver 2.46 percent alongside crude, a cross-asset picture of an inflationary supply shock rather than a growth impulse |
| Natural gas | settled 2.8220 for October, down 3.22 percent on forecasts for weaker domestic demand, the divergence arguing this is a crude and distillate supply event rather than a broad energy-complex rally |
| Global benchmark grade | the waterborne benchmark settled 101.21, up 3.29 or 3.36 percent, putting the benchmark to WTI differential at 5.16, the benchmark outpacing WTI consistent with risk concentrated in seaborne and Gulf-region supply |
| Product complex | distillate settled 4.8010 dollars a gallon for October, the highest close since 2022, while gasoline settled 3.2106 down 1.29 percent, putting the distillate margin near 105.59 dollars a barrel and the gasoline margin near 38.80, a refining-capacity signal rather than a crude-supply signal |
| Forward curve | the front-month to second-month spread widened to plus 3.18, a gain of 11.97 percent on the session, steep and steepening backwardation and the market clearest statement that near-term barrels are scarce |
| When | Event |
|---|---|
| Mon Sep 7 | the United States Labor Day holiday, no pit session, which shifted the weekly government inventory release from Wednesday to Thursday |
| Tue Sep 8 | the October contract advanced 1.55 to a 93.03 settlement and a new 52-week high at 94.73 on a compressed afternoon sequence of Middle East supply headlines |
| Wed Sep 9 | the fifth consecutive advance, a 3.02 or 3.25 percent gain to a 96.05 settlement and a fresh 52-week high at 96.93 on tanker and refinery supply headlines, the front-to-second-month spread steepening 11.97 percent to plus 3.18 |
| Thu Sep 10 | the dense session, the producer-group monthly report at 08:00 AM ET, a European central bank rate decision at 08:15 AM ET, United States producer prices at 08:30 AM ET and the delayed weekly crude inventory count at 12:00 PM ET against a prior 4.450 million barrel draw |
| Fri Sep 11 | the international energy agency monthly report at 04:00 AM ET and United States consumer prices at 08:30 AM ET, forecast 3.4 percent annually headline and 2.4 percent core, ahead of the September 16 policy meeting |
The economic releases referenced above are published on the official government calendars below. Price levels are derived from standard technical and statistical methods, and the market read is AlgoIndex's own analysis. How we grade these calls is set out in our performance methodology.
- US Bureau of Economic Analysis, Personal Income and Outlays (PCE)
- US Bureau of Economic Analysis, Gross Domestic Product
- US Bureau of Economic Analysis, release schedule
- US Census Bureau, Advance Durable Goods (M3) release schedule
- US Energy Information Administration, Weekly Petroleum Status Report
- US Department of the Treasury, auction schedule and results
- AlgoIndex performance methodology



