
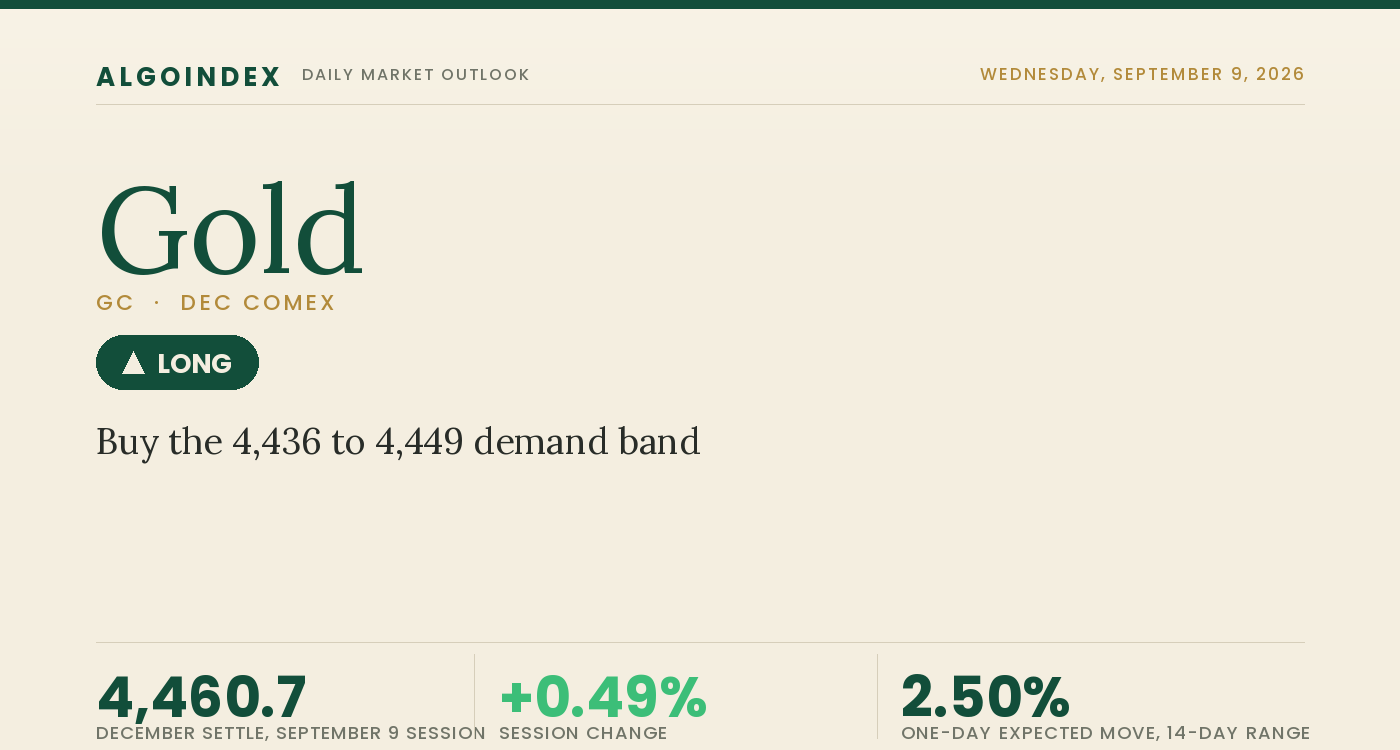
Gold turned in a firm reversal-and-recovery session on Wednesday, and the shape of the day mattered more than the headline number. The December contract settled at 4,460.7, higher by 21.7 points or 0.49 percent, after opening at 4,399.0 near the lower third of what became the day range and immediately probing lower to a 4,384.1 low, a level that sits just above the first computed support pivot at 4,383.7. From that early low the market found a persistent bid and climbed roughly 95 points to tag 4,479.0 at the high before easing modestly into the settlement, a close in the upper fifth of the range near 81 percent that marks a buyers-in-control finish rather than a mid-range drift. Session volume near 161,446 contracts and open interest near 314,070 point to normal participation behind the move rather than a thin advance. The notable feature of the day is that this strength was achieved against a backdrop that would ordinarily weigh on gold, with the ten-year yield pushing to a multi-year high near 4.85 percent and the dollar index firming modestly after recovering from a two-and-a-half-week low.
The advance sits inside a broader multi-month correction rather than a fresh breakout. The close leaves gold below its 5-day at 4,463.0, its 20-day at 4,522.5 and its 200-day at 4,646.1, yet comfortably above its rising 50-day at 4,312.6 and just above its 100-day at 4,444.0, a configuration that reads as a corrective consolidation between intermediate support and the falling shorter-term and longer-term averages. Price is working through the middle of a broad band bounded above near the summer high at 4,755.0 and far below at the 4,015.6 range low, roughly 23 percent under the 52-week high near 5,781.8. The multi-indicator composite reads a weak 8 percent buy overall, with the composite trend signal at buy, the short-term group at 20 percent sell and the long-term group at hold. The structural contradiction into Thursday is clean to state: the rate backdrop argues for pressure through the real-yield channel, yet price refused to break and closed near its high, treating the energy-led inflation impulse and the safe-haven bid as sufficient to absorb the rate pressure until the next inflation print resolves the question.
A firm reversal close that holds above the 50-day into an inflation-print Thursday
The daily picture is a corrective body that just posted a short-term higher low and a strong close. Gold settled at 4,460.7, above the rising 50-day at 4,312.6 and the 100-day at 4,444.0, while still below the 5-day at 4,463.0, the 20-day at 4,522.5 and the 200-day at 4,646.1. The settlement sits above the computed pivot at 4,436.3 and above the prior close at 4,439.0, both constructive markers, and the 4,384.1 session low against the prior session establishes the near-term line that bulls defended. The gap up to the 20-day at 4,522.5 frames the level that separates a corrective bounce from a genuine trend resumption, while the distance up to the 200-day at 4,646.1 frames how much overhead work a full recovery would require. Reclaiming 4,522 is the first technical signal that the correction is ending; losing 4,444 and then 4,312 would signal it has further to run.
Momentum is neutral rather than washed out, which leaves room for an upside swing. The 14-day relative-strength reading sits near 49.61, with the 9-day near 45.57 and the 20-day near 51.09, all grouped around the midline and offering no directional edge. The 14-day stochastic is in the lower third, a raw value near 27 percent with the smoothed lines near 29 and 33 percent, which leaves room to run higher without being overbought. The 14-day directional index near 21.91 sits just above the mark that separates trending from ranging, with the negative directional line at 20.45 marginally above the positive line at 19.31, a mild rangebound-to-soft lean rather than a decisive one. Historic volatility on the 14-day basis is about 23.4 percent. The net of these readings is a neutral-to-mildly-constructive picture that will take direction from the inflation catalyst rather than from present internals.
The 4,436 to 4,449 shelf and the 4,491 to 4,507 band frame Thursday
Two areas frame the session. Beneath the settle, the primary pullback-buy zone is the 4,436 to 4,449 shelf, where the computed pivot at 4,436.3 and the prior close at 4,439.0 sit under a shallow first shelf formed by the target-price marker at 4,452.4 and the relative-strength midline at 4,450.6, with the 100-day average at 4,444.0 supportive inside it. Below that, the one-standard-deviation support at 4,390.7 is the last cushion before the 4,384.1 session low and the first computed support at 4,383.7, the near-term line bulls defended; a decisive loss there negates the recovery and opens the two- and three-standard-deviation supports at 4,370.7 and 4,355.3 and then the one-month low at 4,329.2. Overhead, the first objective is the 4,491.5 first computed resistance, reinforced by the one-standard-deviation band at 4,487.3 and the 9-day crossing marker near 4,492.7, then the two-standard-deviation resistance at 4,507.3, the 20-day average at 4,522.5, the second computed resistance at 4,544.1 and the third at 4,599.3, with the one-month high at 4,755.0 the structural ceiling.
Buy the shelf, respect 4,378, trade the inflation print as the pivot
The plan buys a controlled pullback into the 4,436 to 4,449 shelf, where the computed pivot at 4,436.3 and the prior close at 4,439.0 converge under the 4,450 to 4,452 markers, rather than chasing strength into overhead resistance. Price closed in the upper fifth of the range, held above the rising 50-day and 100-day averages and posted a firm reversal off 4,384, and the energy-and-geopolitical bid favours accumulation into support. The stop is 4,378, below the 4,384 session low and the first computed support at 4,383.7, about 58 points from an entry near the 4,436 zone low. Targets run to 4,491 at the first computed resistance and one-standard-deviation band, then 4,507 at the two-standard-deviation resistance, then an extended 4,544 at the second computed resistance above the 20-day cap, worked only if momentum extends on volume, for reward-to-risk near 1 to 0.9, 1 to 1.2 and 1 to 1.8. One consideration governs the trade in real time. Thursday carries the August consumer-price report at 8:30 AM ET, the single most important input for the session, so the 9:30 AM ET cash open keys off the reaction to that number. A softer-than-expected core print eases the rate path, pressures the dollar and yields and supports a push through 4,491 toward 4,507 and the 20-day near 4,522; a hotter print lifts real yields and the dollar and pressures gold back toward 4,436 and then the 4,384 line, and a decisive move and hold below 4,384 negates the long thesis and opens 4,370, 4,355 and the 4,329 one-month low. A further sharp rise in the ten-year yield or a sudden geopolitical de-escalation would do the same. Our published record lays out how we grade these calls.
Wednesday turned in a firm reversal close: a 21.7-point advance to a 4,460.7 settlement in the upper fifth of the range, achieved against a ten-year yield pushing to a multi-year high near 4.85 percent and a firmer dollar, as an energy-led inflation impulse and a safe-haven bid absorbed the rate pressure. The close leaves gold above the rising 50-day and 100-day averages but below the 20-day and 200-day, and the 4,436 to 4,449 shelf is the pullback-buy zone. Buying a dip into that shelf toward the 4,491 first resistance and the 4,507 second target, with the August inflation report the first-order pivot, is the trade.
A firm reversal close that holds above the 50-day into an inflation-print Thursday. The edge is buying pullbacks into the 4,436 to 4,449 shelf toward 4,491 and 4,507, and a decisive loss of 4,384 is the line that negates the recovery and reopens the 4,329 one-month low.
This is the read our members get every session, before the bell, with the levels drawn and the setup defined. See how the same dealer-positioning work turns into systematic signals.
View pricingThe complete data picture
Every number behind Thursday’s plan, charted first; the full numeric reference follows underneath.
Full numeric reference, every remaining figure from the review
| Average | Value | Settle vs |
|---|---|---|
| 5-day | 4,463.0 | below by 2.3 |
| 20-day | 4,522.5 | below by 61.8 |
| 50-day | 4,312.6 | above by 148.1 |
| 100-day | 4,444.0 | above by 16.7 |
| 200-day | 4,646.1 | below by 185.4 |
| Level | Reference |
|---|---|
| 5,781.8 | 52-week high, a distant structural ceiling |
| 4,755.0 | one-month and 13-week high, the ceiling of the correction band |
| 4,678.5 | year-to-date average, well overhead |
| 4,646.1 | 200-day average, the intermediate ceiling |
| 4,599.3 | third computed resistance pivot, the extended target |
| 4,544.1 | second computed resistance pivot, the third target above the 20-day |
| 4,522.5 | 20-day average, the cap that separates a bounce from a trend resumption |
| 4,507.3 | two-standard-deviation resistance, the second target |
| 4,492.7 | 9-day average-crossing marker, top of the first resistance shelf |
| 4,491.5 | first computed resistance, the first upside objective |
| 4,487.3 | one-standard-deviation resistance band, part of the first shelf |
| 4,479.0 | session high, the day upside extreme |
| 4,463.0 | 5-day average, essentially on price |
| 4,460.7 | December settle |
| 4,452.4 | computed target-price marker, top of the shallow first shelf |
| 4,450.6 | 14-day relative-strength midline level, part of the shallow shelf |
| 4,444.0 | 100-day average, supportive just below price |
| 4,439.0 | prior settlement, directly above the pivot |
| 4,436.3 | computed pivot, base of the 4,436 to 4,449 pullback-buy shelf and first support |
| 4,390.7 | one-standard-deviation support, the last cushion before the low |
| 4,384.1 | session low, the line bulls defended and reversed from |
| 4,383.7 | first computed support pivot, overlapping the session low |
| 4,370.7 | two-standard-deviation support, the downside objective on a break |
| 4,355.3 | three-standard-deviation support, the deeper downside |
| 4,329.2 | one-month low, the structural support that confirms an extension |
| 4,312.6 | 50-day average, the rising trend-support anchor |
| 4,015.6 | 13-week range low, the far backstop |
| Metric | Reading |
|---|---|
| Gold-ETF proxy price | near 403.65, up about 0.98 percent from the prior 399.72, the positioning reference for the metal dated this session |
| Futures-to-proxy multiplier | about 11.05, so the 403.65 proxy area maps to the 4,460.7 futures zone |
| Call-side dealer gamma | about negative 452 million on the call side |
| Put-side dealer gamma | about positive 177 million, the smaller leg |
| Net configuration | net negative dealer gamma, a posture in which market-makers hedge with the direction of price rather than against it, which amplifies rather than dampens intraday moves, the options analogue of the two-way inflation-print risk |
| Options-implied one-day move | about 6.24 dollars on a base near 403.65, roughly 1.5 percent, into the September 17 top gamma and delta expiry that sits alongside next week policy meeting |
| Implied-volatility rank | near 35 percent, a middling reading, with one-month implied near 24.7 percent below one-month realized near 27.6 percent so options are not richly priced |
| Skew rank | near 78 percent, an elevated tilt pointing to firm demand for downside protection, with a put-to-call open-interest ratio near 0.48 that leans call-heavy on open interest |
| Input | |
|---|---|
| Dollar | the dollar index recovered from a two-and-a-half-week low to finish marginally higher, up about 0.06 percent, supported by the crude surge lifting inflation expectations and a smaller-than-expected long-end debt buyback announcement that prompted short covering |
| Real yields | the ten-year nominal yield rose to a multi-year high near 4.85 percent, with the future near 4.83, yet the energy-led jump in inflation expectations muted the rise in the inflation-adjusted yield, which is why gold could firm rather than break; a nominal-yield rise that outpaces inflation expectations is the cleanest bearish trigger |
| Fed and policy | rate pricing firmed from roughly 45 percent toward roughly 61 percent implied odds of a September increase, against a strong 162,000 employment print versus a 55,000 expectation and a sticky core gauge near 3.7 percent year over year, with the September 15 to 16 policy meeting the larger event on the horizon |
| Geopolitics | an active risk-off backdrop, with reports of a US strike destroying five Iranian tankers in response to attempts on a US Navy warship and Ukrainian long-range strikes on Siberian gas facilities, a standing source of safe-haven demand that helps explain the resilience against the rate headwind |
| Crude oil | front-month crude advanced about 3.25 percent to a multi-month high near 96 dollars and the international benchmark settled near 101 dollars, its highest close since late May, an inflationary impulse that lifts inflation expectations, caps the rise in real yields and supports gold as an inflation hedge |
| Central-bank demand | no fresh official-sector purchase data crossed the news feeds this session, so the structural-demand input is unchanged rather than new, a supportive longer-term backdrop that is neutral for Thursday specifically |
| Positioning | no fresh weekly positioning report crossed this session, with bank-desk commentary leaning toward carry and inflation-hedge themes remaining supported by high energy prices and elevated yields, consistent with continued two-way institutional interest rather than a one-directional unwind |
| Momentum composite | the multi-indicator composite reads a weak 8 percent buy overall, with the composite trend signal at buy, the short-term group at 20 percent sell, the medium-term group at 25 percent buy and the long-term group at hold, a neutral-to-mildly-constructive picture |
| When | Event |
|---|---|
| Wed Sep 9 | the reviewed session, gold up 0.49 percent to 4,460.7 in a firm reversal close as an energy-and-geopolitical bid absorbed a rate headwind |
| Wed night | Asian and overnight trade taking its cue from geopolitical headlines and the direction of the dollar and yields, with the recovery from 4,384 intact |
| Thu Sep 10 | the US August consumer-price report at 8:30 AM ET, the single first-order catalyst, with UK growth data overnight and a Treasury long-end buyback in the afternoon |
| Thu afternoon | the reaction band 4,491 to 4,507 on a constructive print, or the lower pivots toward 4,436 and 4,384 on a hot one |
| next week | the September 15 to 16 policy meeting, priced near a 61 percent chance of a further quarter-point increase |
| horizon | positioning drift into the policy event once Thursday inflation print clears |
The economic releases referenced above are published on the official government calendars below. Price levels are derived from standard technical and statistical methods, and the market read is AlgoIndex's own analysis. How we grade these calls is set out in our performance methodology.
- US Bureau of Economic Analysis, Personal Income and Outlays (PCE)
- US Bureau of Economic Analysis, Gross Domestic Product
- US Bureau of Economic Analysis, release schedule
- US Census Bureau, Advance Durable Goods (M3) release schedule
- US Energy Information Administration, Weekly Petroleum Status Report
- US Department of the Treasury, auction schedule and results
- AlgoIndex performance methodology



