
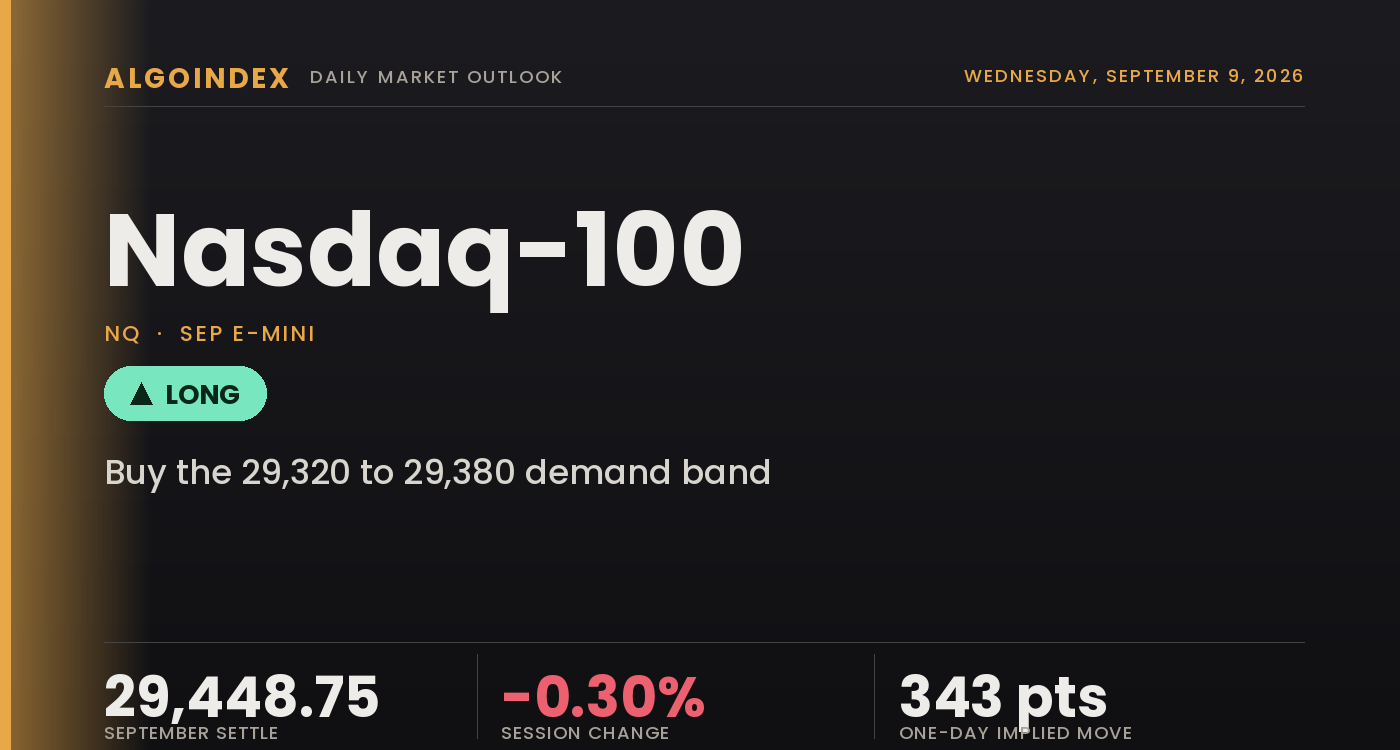
The September Nasdaq-100 settled Wednesday at 29,448.75, down 90.00 points or 0.30 percent from the prior 29,538.75 settlement, after failing an early probe to 29,633.75 and rotating back into the middle of its balance area. The session low of 29,333.00 arrived in the afternoon and the close finished at roughly 38 percent of the 300.75-point range, a weak close but not a decisive one. Volume of 492,284 ran slightly under the 505,583 twenty-day average, consistent with a market rotating rather than repricing. The cash index closed at 29,421.55, down 0.29 percent, placing the measured futures-to-cash basis at plus 27.2 points, the conversion used throughout this review. The dispersion around the session is what makes it worth studying: the S&P 500 fell 0.48 percent, the Dow fell 0.77 percent to a five-week low and small caps lost 1.3 percent, while the technology index was the strongest of the major benchmarks, an outperformance driven by semiconductor and artificial-intelligence sponsorship inside a rates-driven decline.
The dominant driver was not technology-specific. Crude surged more than 3 percent to its highest close since late May on escalating Middle East hostilities, and the resulting lift in inflation expectations pushed the ten-year yield to 4.85 percent, its highest in roughly two and three quarter years. Chipmakers and artificial-intelligence infrastructure names finished higher even as the broad market fell, and the Apple product event delivered a foldable handset and a two-nanometer processor with a materially larger on-device inference engine, so the index-level loss reads as a duration and rates story imposed from outside the sector rather than a demand signal from within it. Dealer positioning reinforces the point: the cash index carries the only positive gamma notional and the highest gamma tilt in the major complex at 1.438, which mechanically favors mean reversion inside the current band. Price sits four points beneath the 5-day average and 92.66 points beneath the 20-day while holding well above the 50-day, 100-day and 200-day, with a 14-day directional index of 12.19 and relative strength pinned near 50. The setup that follows leans long into the lower boundary of the corridor at reduced size.
Pinned below the 20-day, anchored above the long-end averages
The structural read starts with location, and it is constructive with one qualification. At 29,448.75 the contract sits above its 50-day average at 29,361.23 by 87.52 points, its 100-day at 29,332.61 by 116.14 points and its 200-day at 27,478.60 by 1,970.15 points, while sitting four points beneath the 5-day at 29,452.75 and 92.66 points beneath the 20-day at 29,541.41. Price is sandwiched between the 50-day beneath and the 20-day above, a 180-point band that contains the entire current balance area, and it is far above the 200-day, which places the structural trend firmly higher. The 20-day is the nearest structural ceiling and the single cleanest tell for Thursday: acceptance above 29,541 argues the September 2 low was the swing low and the balance resolves higher into the September 16 meeting, while continued rejection keeps the corridor intact. Settlement within one point of the 18-day crossing level at 29,449.69 is as neutral a mechanical read as this index produces.
Momentum is neutral without being stretched, which is itself the finding. Relative strength reads 50.22 on nine days, 50.41 on fourteen and 50.53 on twenty, as close to neutral as this indicator gets, and it removes momentum from the list of usable inputs for Thursday. Stochastics split by lookback: the 14-day fast line at 60.52 sits above its slow line at 56.30, a positive spread, while the 20-day fast line at 41.70 sits below its slow line at 43.42, short-horizon recovery inside intermediate-term weakness. Trend strength is the most decisive reading available and it says there is no trend, the directional index at 12.19 on the 14-day and 14.45 on the 9-day, both deeply beneath the level at which directional movement is considered meaningful, with the 14-day negative line marginally ahead at 21.17 against 20.15. The multi-indicator composite reads 56 percent constructive with a weak, weakest-near-term label, decomposed into a 20 percent short-term, 75 percent medium-term and 67 percent long-term reading, the fingerprint of a corrective pullback inside an intact uptrend.
The 29,297 to 29,333 lower boundary anchors Thursday
Two structures frame the session. Beneath the market, the band from 29,297 to 29,333 is the lower boundary of the corridor and the location of the entry, where Wednesday session low at 29,333.00, first pivot support at 29,309.92 and the modeled volatility threshold at 29,297 stack inside 36 points, with the 100-day average landing on the same price as the low and the 40-day crossing level at 29,234.83 the next shelf beneath. Overhead, the first task is a reclaim of the 29,472 pivot point and then the dense 29,527 to 29,541 band that pairs the primary gamma concentration with the 20-day average, above which the 29,611 first pivot resistance and the 29,634 session high convert the corridor from a range into a base. The producer-price release at 8:30 AM ET lands a full hour before the cash open, so the futures move happens in the pre-market and the 9:30 AM ET open inherits a level rather than creating one.
Buy the corridor boundary, scale at the magnets, size it down
The plan leans long into the 29,320 to 29,380 lower boundary of the corridor, where the 29,333 session low, the 29,310 first pivot support and the 29,297 modeled volatility threshold stack inside 36 points and form a defined band where a producer-price reaction can be absorbed with a tightly definable failure point, on the view that the only positive gamma notional in the major complex and continued semiconductor sponsorship absorb a first test before Friday consumer prices force a decision. The stop is 29,262, beneath the modeled volatility threshold and first pivot support, roughly 88 points from the 29,350 entry midpoint, because beneath that band the positive dealer positioning that underwrites the whole thesis stops functioning. Targets run to 29,472 at the computed pivot point and session mechanical mean, then 29,527 at the primary gamma concentration immediately beneath the 20-day average, then an extended 29,611 at first pivot resistance, taken only if the 20-day at 29,541 is reclaimed on volume and the core producer-price reading came in at or beneath consensus, for approximately 1 to 1.4, 1 to 2.0 and 1 to 3.0. A decisive acceptance beneath 29,270, fifteen minutes of trade below it after the cash open rather than a single wick, negates the thesis and reopens 29,235, then 29,171, then the 29,020 to 29,027 band. Three conditions void the setup in real time: a core producer-price reading of 0.4 percent monthly or higher that forces the ten-year above 4.90 percent, a failed thirty-year auction with a material tail, and crude decisively through the hundred-dollar level. Reduced size is appropriate, since the afternoon stacks corporate and rates catalysts together ahead of an after-close report and Friday consumer prices. Our published record lays out how these calls are graded.
A settle above the 50-day, 100-day and 200-day averages with the only positive gamma notional in the major index complex, yet trend strength close to absent, the settlement four points beneath the 5-day and 92.66 points beneath the 20-day, and a producer-price release expected to accelerate sharply landing before the open. The 29,297 to 29,333 lower boundary is the referee: a test that holds it works toward the 29,472 pivot and the 29,527 gamma concentration, while a sustained break of 29,270 opens 29,235 and the 28,927 September 2 low.
A market above its long-end stack but pinned inside a positive-gamma corridor is a lower boundary to lean into at the 29,320 to 29,380 band, not a settlement to chase. The edge is a hold of that band above the 29,262 stop, and the invalidation is a decisive acceptance beneath the 29,270 modeled volatility threshold into a directional environment.
This is the read our members get every session, before the bell, with the levels drawn and the setup defined. See how the same dealer-positioning work turns into systematic signals.
View pricingThe complete data picture
Every number behind Thursday’s plan, charted first; the full numeric reference follows underneath.
Full numeric reference, every remaining figure from the review
| Average | Value | Settle vs |
|---|---|---|
| 5-day | 29,452.75 | settle below by 4.00, 0.01 percent, a coin-flip distance at an index whose average daily range is 377 points |
| 20-day | 29,541.41 | settle below by 92.66, 0.31 percent, the nearest structural ceiling and the level whose reclaim flips the intermediate posture |
| 50-day | 29,361.23 | settle above by 87.52, 0.30 percent |
| 100-day | 29,332.61 | settle above by 116.14, 0.39 percent, landing on the same price as the session low |
| 200-day | 27,478.60 | settle above by 1,970.15, 6.69 percent, the widest gap in the stack |
| Level | Reference |
|---|---|
| 30,343.00 | one-month high set August 17, the objective for any sustained recovery, roughly 894 points above the settlement |
| 30,027.00 | 30,000 cash strike converted to the futures domain, a round-number magnet with meaningful positioning |
| 29,911.00 | third pivot resistance, the upper mechanical boundary of the standard set, a 462-point move that exceeds the 14-day true range |
| 29,802.18 | 38.2 percent retracement of the four-week high, the upper edge of a confluence band with second pivot resistance |
| 29,773.00 | second pivot resistance, the most credible upside objective on a strong session, within thirty points of the 38.2 percent retracement |
| 29,635.13 | 50 percent retracement of the four-week range, within one and a half points of the session high and the reason the probe stalled |
| 29,633.75 | Wednesday verified session high, the failed probe level and the single cleanest structural line in the near term |
| 29,611.00 | first pivot resistance, the extended third target, the first meaningful ceiling on any Thursday advance |
| 29,541.41 | 20-day moving average, the most important intermediate-term level, the ceiling for the current session and the reclaim that flips the posture from corrective to constructive |
| 29,527.00 | primary gamma concentration mapped to futures from the 29,500 cash concentration, the dominant hedging magnet and the second target, immediately beneath the 20-day average |
| 29,471.83 | computed pivot point, the session mechanical mean twenty-three points above settlement and the first target |
| 29,468.07 | 38.2 percent retracement from the four-week low, twenty points above the settlement, where price closed almost exactly on the shorter retracement pair |
| 29,452.75 | 5-day moving average, four points above the settlement, a coin-flip distance |
| 29,449.69 | 18-day average crossing level, within one point of the settlement, as neutral a mechanical read as this index produces |
| 29,448.75 | September settle, the reference point for the session |
| 29,426.75 | level associated with a 14-day relative-strength reading of 50, twenty-two points beneath the settlement |
| 29,424.25 | 9-day average crossing level, twenty-five points beneath the settlement, the first mechanical shelf and the top of the entry structure |
| 29,361.23 | 50-day moving average, 87.52 points beneath the settlement, the lower rail of the 180-point band that contains the current balance area |
| 29,333.00 | Wednesday session low, the reference low for the entire Thursday map and the anchor of the entry band |
| 29,332.61 | 100-day moving average, landing on the same price as the session low |
| 29,309.92 | first pivot support, twenty-three points beneath the session low, the mechanical extension of the downside and the most likely location for constructive engagement |
| 29,297.00 | modeled volatility threshold mapped to futures from the 29,270 cash level, the demarcation line between the mean-reverting environment above and a directional one below |
| 29,262.00 | protective stop, beneath the modeled volatility threshold and first pivot support, below which the positive dealer positioning underwriting the thesis stops functioning |
| 29,234.83 | 40-day average crossing level, a secondary mechanical shelf in play only after the modeled volatility threshold gives way |
| 29,171.00 | second pivot support, the mechanical downside objective on a producer-price shock, a 278-point move comfortably inside the implied one-day move |
| 29,088.50 | 50 percent retracement of the 13-week range, the level that separates a correction inside the July uptrend from something structurally more serious |
| 29,027.00 | put-side hedging boundary mapped to futures from the 29,000 cash boundary, where dealer flows have historically absorbed selling |
| 29,020.00 | modeled gamma-flip level mapped to futures from the 28,993 cash level |
| 28,927.25 | one-month low set September 2, the base of the ascending structure whose failure would invalidate it |
| 27,478.60 | 200-day moving average, 1,970.15 points beneath the settle, the widest gap in the stack |
| 27,201.50 | 13-week low set July 29, 2,247 points beneath the settle, a structural reference |
| Metric | Reading |
|---|---|
| Proxy and index surface | the proxy one-month implied volatility reads 18.32 percent against 12.81 percent realized, a premium of roughly 5.5 points, with an implied volatility rank of 23.27 percent low in its own year and a skew rank of 58.33 percent that is modestly elevated; the cash index shows a positive gamma tilt of 1.438, the highest of the six instruments surveyed, and positive gamma notional of 13.584 million dollars, the only positive reading in the set |
| Implied one-day move | about 343 points, 1.16 percent scaled to the futures settle, beneath the 377.57-point 14-day average daily range and well beneath the 438.84-point 14-day true range, with the proxy implying the same 1.16 percent on a 716.30 dollar price at 8.31 dollars |
| Dealer gamma, proxy | the fund gamma notional reads negative 271.663 million with a 0.839 tilt below the neutral 1.0, call gamma negative 217.97 million against put gamma negative 2.09 billion, so the fund complex is short gamma while the cash-index book is long, a divergence that argues for weighting the cash-index reading for futures purposes |
| Options volume skew | fund calls of 741,530 against 1.1 million puts, a put-to-call volume ratio of 1.48, with open interest of 5.262 million calls against 7.235 million puts for a ratio of 1.37 |
| Gamma references, futures domain | the primary gamma concentration maps to roughly 29,527, the modeled volatility threshold to roughly 29,297, the modeled gamma-flip level to roughly 29,020 and the put-side hedging boundary to roughly 29,027; the published call-side boundary at cash 29,275 sits beneath the close, atypical and recorded as observed, and no listed level depends on it |
| Flow composition | index options flow at negative 5 billion dollars of delta on the session, from negative 8 billion of put purchasing carried over and positive 2.5 billion of same-day expiry call buying, the composition that produces range-bound sessions |
| Expiry and basis | top gamma expiry September 17, the same date as the futures options expiration and one day before contract expiry September 18, with front open interest of 286,229 and the September futures at a measured 27.2-point premium to the cash index; the 25-delta risk reversal reads 0.00 for the fund against negative 0.048 for the cash index |
| Cohort | Weekly change |
|---|---|
| Dealers and intermediaries | 58,239 long against 137,013 short as of September 1, a net short of roughly 78,800 with 14,510 shorts added, the intermediating side absorbing the other side of the covering |
| Asset managers | 108,397 long against 36,520 short, a net long of roughly 71,900 that barely changed on the week, real money that never left |
| Non-commercial participants | 89,434 long against 63,544 short, a net long of roughly 25,900 after cutting 15,049 shorts |
| Leveraged funds | 55,361 long against 69,453 short, a net short of roughly 14,100 after cutting 23,620 shorts and adding 3,520 longs, a large short-covering event coinciding with the September 2 low |
| Open interest | front-contract open interest of 286,229 with the contract expiring September 18, so roll activity builds through the coming sessions and can distort volume readings |
| Positioning read | fast money covered aggressively into the early-September low, real money never left and dealers absorbed the other side, which caps the upside impulse while removing any forced-seller overhang beneath |
| Input | |
|---|---|
| Federal Reserve policy | the ten-year Treasury yield closed at 4.85 percent, its highest in roughly two and three quarter years, after Wednesday auction stopped at 4.834 percent against 4.683 percent previously with a 2.710 bid-to-cover; the September 16 policy decision and projection materials are the next scheduled resolution point |
| Rates and inflation | producer prices arrive Thursday with the headline annual rate forecast to accelerate from 4.7 to 5.3 percent and the core from 4.2 to 4.6 percent, monthly readings of 0.4 headline and 0.3 core, much of it energy pass-through; consumer prices arrive Friday with core debated between 0.2 and 0.3 percent monthly, one preview modeling 0.23 percent and an annual core of 2.4 percent |
| Semiconductor leadership | chipmakers and artificial-intelligence infrastructure names closed higher while the Dow fell to a five-week low and small caps lost 1.3 percent, a sector rotation into secular-growth semiconductors that carried the index to outperformance of nineteen basis points over the broad benchmark and a full percentage point over small caps |
| Mega-cap and AI capex | the Apple product event introduced a foldable handset, an iPhone 18 Pro line at 1,199 dollars with the Pro Max at 1,299 and a two-terabyte configuration at 3,199, and a two-nanometer processor with two neural engines and thirty-two cores that extends the capital-expenditure story into the handset cycle; a mega-capitalization social platform rose 7 percent on an autonomous agent launch with October call spreads up roughly 90 percent, and Thursday after the close a major enterprise-software report prints consensus 1.75 dollars per share on 19.13 billion dollars of revenue |
| Cross-asset and volatility | the volatility index closed at 16.46 and the volatility-of-volatility index rose six points to 95, its highest in more than a week, with 210,000 lots of short put open interest at the sixteen level and 422,000 lots of short call positioning at twenty; the proxy carries a one-month realized volatility of 12.81 against a one-month implied of 18.32, fixed-strike volatilities rose about one and a half points for Friday and large-cap at-the-money implied volatility for Friday sits at 15.1 percent, a 0.94 percent implied move on consumer price day |
| Geopolitical | Middle East hostilities escalated, with explosions reported at an Iranian oil terminal island, a Saudi refinery reported struck earlier in the week and Iranian officials restating a firm nuclear position; the administration stated it is not seeking a deal while leaving negotiation open, and both Brent and United States crude settled at their highest closes since May 22 on a move of more than 3 percent, transmitting into technology equities through inflation expectations and the long end |
| When | Event |
|---|---|
| Wed Sep 9 | the reviewed session, a 0.30 percent decline to 29,448.75 after a failed upside probe, the technology index the strongest of the major benchmarks on a rates-driven selloff led by long-end yields |
| Thu Sep 10 | the outlook session and the heaviest day, with the monthly energy report, the European central-bank decision at 8:15 AM ET with a hike to 2.65 percent forecast, United States producer prices and claims at 8:30 AM ET, a thirty-year auction at 1:00 PM ET and a major enterprise-software report after the close |
| Fri Sep 11 | United States consumer prices at 8:30 AM ET, forecast at 3.4 percent headline annually, 2.4 percent core annually and 0.2 percent core monthly, with consumer sentiment and inflation expectations at 10:00 AM ET |
| Sep 16 to 18 | the policy decision and projection materials September 16, index options expiry September 17 alongside a Japanese policy decision, and the September futures contract expiration September 18 |
| Read | the first-order confluence runs Friday through the middle of next week, which argues against committing full size to any directional position on Thursday and in favor of treating it as a positioning session inside a defined corridor |
The economic releases referenced above are published on the official government calendars below. Price levels are derived from standard technical and statistical methods, and the market read is AlgoIndex's own analysis. How we grade these calls is set out in our performance methodology.
- US Bureau of Economic Analysis, Personal Income and Outlays (PCE)
- US Bureau of Economic Analysis, Gross Domestic Product
- US Bureau of Economic Analysis, release schedule
- US Census Bureau, Advance Durable Goods (M3) release schedule
- US Energy Information Administration, Weekly Petroleum Status Report
- US Department of the Treasury, auction schedule and results
- AlgoIndex performance methodology



