
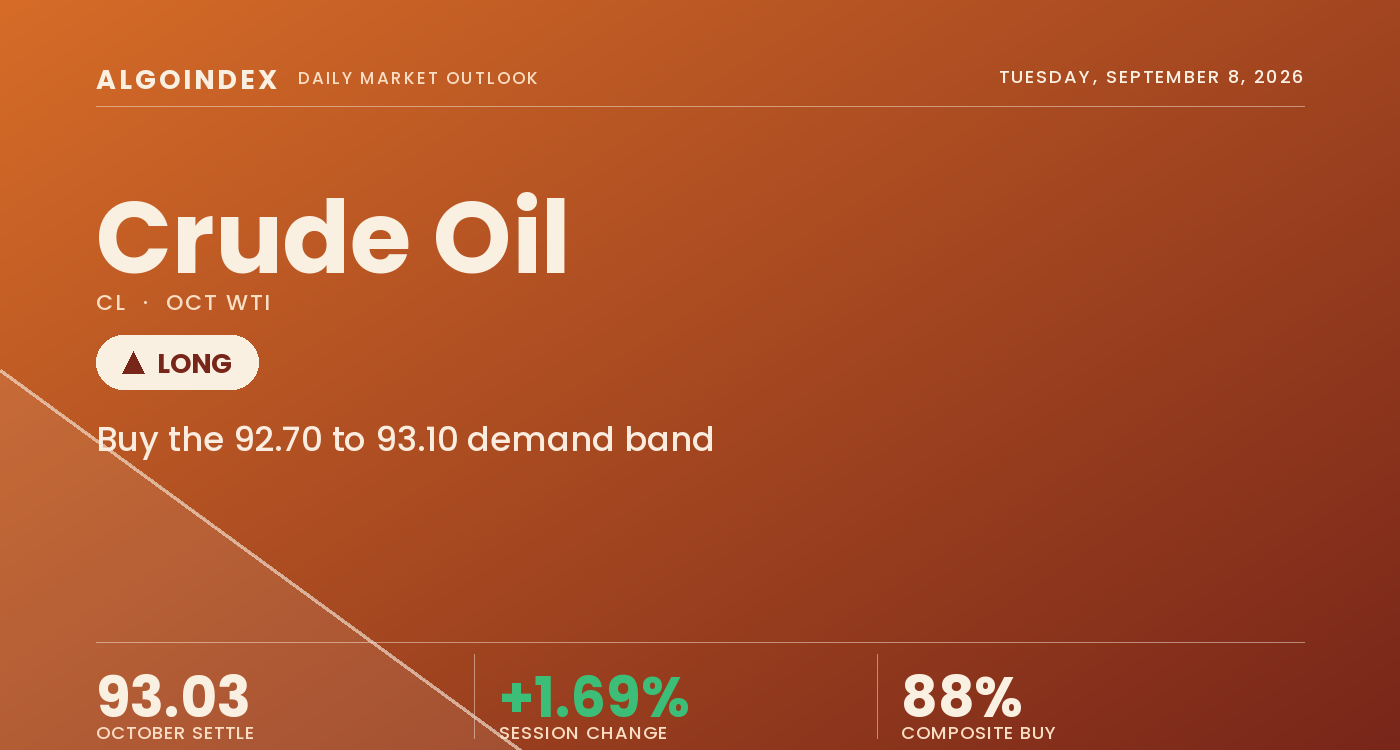
Crude oil settled Tuesday at 93.03, higher by 1.55 dollars or 1.69 percent from Monday's 91.48 close, and the settled figure understates the day. The October contract opened at 92.26, filled its opening gap to a 90.87 low that printed 61 cents beneath the prior settlement, then advanced 3.86 dollars off that low to a 94.73 session high before settling at 93.03, in the upper half of a wide range at 56 percent. The full range measured 3.86 dollars, or 4.15 percent of the settlement, above the 2 to 4 percent band that normally frames this contract, and volume of 403,395 contracts ran at 169 percent of the 20-day average, the participation signature a move of this size needs to be taken seriously rather than treated as a thin holiday-week extension. A market that fills its gap early, refuses the lower level for the rest of the day and settles in the upper half is being accumulated rather than distributed, and the accumulation began from beneath the prior close, which makes the turn more meaningful, not less.
The session's defining feature is the divergence between the settlement and where the contract traded after it. WTI settled 93.03 at 02:30 PM ET, but the post-settlement quote read at 04:55 PM ET was 94.28, with the day's 94.73 high standing above both. That later print is a post-settlement quote and not a closing price, since the electronic session runs to 05:00 PM ET, and it is used here only as a same-day marker of post-settlement direction. It stood 1.25 dollars above the settlement, so the settled print understates the market's verdict by roughly 1.3 percent, and the mechanical cause is visible in the news sequence, a compressed run of reports on strikes involving Iranian tankers and Saudi refining infrastructure that ran from 02:47 PM ET through 04:29 PM ET, entirely after the settlement window closed. The structural contradiction into Wednesday is between momentum and extension. Every trend measure is aligned higher, the moving-average stack in full bullish order, the multi-indicator composite at 88 percent buy against 32 percent sell a month ago, the front-to-second-month spread widened from 2.91 to 4.09 in a single session and the directional index confirming an accelerating advance. Against that, the 9-day relative strength index sits at 79.76 and the 14-day stochastic percent K at 90.27, both describing a contract that has already travelled a long way in a short time. Wednesday's own calendar is light for energy, with the weekly government inventory print pushed to Thursday behind the Monday holiday, which leaves the contract exposed primarily to headline flow rather than scheduled data.
Above every average with a composite at 88 percent buy, and stretched
The constructive read starts with location. The 93.03 settlement sits above every average in the study, the 5-day at 91.61, the 20-day at 85.62, the 50-day at 80.29, the 100-day at 80.94 and the 200-day at 72.88. The distance above the 20-day is 7.41 dollars, an extension of 8.7 percent, and the settlement stands 20.15 above the 200-day. The multi-indicator composite reads 88 percent buy overall, all six short-term components and all four medium-term components positive, the long-term group at 33 percent held back solely by the 50-day at 80.29 sitting fractionally beneath the 100-day at 80.94. The composite read 88 percent buy a day earlier, 48 percent a week ago and 32 percent sell a month ago, the whole signal set moving from bearish to strongly bullish inside thirty days. The 9-day directional index has reached 31.05 and the 14-day positive directional line leads the negative 33.30 to 14.46, a better than two-to-one spread and a trend gaining organisation, while the swing sequence remains an unbroken series of higher highs and higher lows, the advance from the 76.80 August low to the 94.73 high 17.93 dollars or 23.3 percent in twenty calendar days.
What argues the other way is the extension and the momentum. The settlement sits 7.41 dollars above the 20-day at a moment when the 14-day average true range is 3.40, so more than two sessions of normal range separate spot from its own mean, and mean reversion does not require a bearish catalyst from here. Stochastics are the more emphatic warning, the 14-day raw reading 95.37 with percent K at 90.27 and the 50-day raw reading 97.46, so the contract is closing at the top of its distribution on every window. The 9-day relative strength at 79.76 is well above the overbought line, with the 14-day at 72.30 also above it and the 20-day at 67.15 just beneath, readings that high describing a market with little unused upward momentum in the short run. Balanced against that, historic volatility of 32.34 percent on the 14-day window runs well beneath the 43.15 percent 50-day figure, so realised movement is picking up from a lull without yet matching the summer's turbulence, and the 90.87 low did not violate any prior swing low of consequence, the technical reason to read the early dip as a gap fill inside a trend rather than a change of character.
The 92.88 to 93.03 confluence and the 94.73 high frame Wednesday
Two structures frame the session. Beneath price, the recomputed 92.88 pivot and the 93.03 settlement sit on top of each other, forming a 92.88 to 93.03 confluence that is the single most important level structure on the chart and the anchor for the plan, with the 5-day average at 91.61 and the recomputed 91.02 first support tightening the deeper 91.02 to 91.61 defensive band and the 90.87 session low beneath. Overhead, the 94.28 post-settlement quote is the first price the contract must reclaim on the reopen, above it the 94.73 session high and new 52-week high form a tight confluence with the recomputed 94.88 first resistance, and beyond that the 96.43 upper bound of a one-average-true-range envelope and the recomputed 96.74 second resistance. Wednesday is a positioning session rather than a resolution one. The single first-order event for crude is the absence of one, because the weekly government inventory print that normally anchors a Wednesday sits on Thursday at 12:00 PM ET this week behind the Monday holiday. The confirmed short-term energy outlook at 12:00 PM ET is a forecast document rather than a physical count. Crude has no liquid options proxy, so positioning is read from the weekly commitments data, the refined-product margins and the futures structure, and a market that has just repriced 3 percent on supply concern with no inventory print to confirm or contradict it takes its Wednesday direction from headlines, not statistics.
Buy the pullback into 92.88, respect 90.95, size for the headline
The plan buys the 92.70 to 93.10 band on a pullback, favouring the recomputed pivot and settlement confluence over a chase into the 94.28 post-settlement quote, and produces materially better geometry than paying the close. The stop is 90.95, beneath the recomputed 91.02 first support and beneath the 5-day average at 91.61 and Monday's 91.48 close, a buffer of roughly 1.95 dollars from the entry midpoint, appropriate against a 3.40 dollar average true range and placing risk beneath the level whose loss changes the short-term structure. Targets step to 94.88, the recomputed first resistance in confluence with the 94.73 session and 52-week high, then 96.74, the recomputed second resistance just above the 96.43 envelope ceiling, then 98.74, the recomputed third resistance only on a confirmed supply disruption and on volume expansion through target two, for reward-to-risk of roughly 1 to 1.0, 1 to 2.0 and 1 to 3.0 from the entry midpoint. The defining risk is two-sided and macro. A confirmed agreement on managed transit through the Strait of Hormuz, a producer-group supply response in Thursday's monthly report, or an unexpectedly large build in Thursday's inventory count would each remove conflict premium faster than any technical level can absorb and invalidate the setup on the reopen regardless of price, and the seven-day-old speculative length would liquidate into that move. In the opposite direction, a confirmed outage at a major production or refining facility, or a struck vessel inside the strait, would gap the contract through every resistance level listed, in which case the setup is void because the entry was never available and should not be chased. A decisive settlement beneath 91.02, particularly with the front-to-second-month spread narrowing back toward 2.90, negates the long thesis and opens the 89.02 to 87.16 support band, and a failure to reclaim 93.03 on the reopen is the earlier warning that the post-settlement move was headline froth rather than repricing. Position sizing sits at one half to two-thirds of an equity-index equivalent given a 3.61 percent average true range as a share of spot, and Wednesday's absence of scheduled energy data alongside an active headline sequence argues for the lower end of that band, with capacity retained for the Thursday release block. Our published performance methodology sets out how these calls are graded.
The contract filled its opening gap to 90.87, reclaimed the entire decline and advanced to a new 52-week high at 94.73 before settling 93.03 on volume at 169 percent of the average, then traded 1.25 dollars higher to a 94.28 post-settlement quote on a compressed run of Middle East supply headlines. That argues for buying a pullback into the recomputed 92.88 pivot and settlement confluence rather than chasing the post-settlement quote, sized for a two-sided supply catalyst on a Wednesday with no scheduled first-order energy data, and a durable de-escalation is the one development that flips the read.
A supply-tight market that holds above every moving average and prints a new 52-week high but sits with a 9-day relative strength index near 80 is a market to buy on a pullback rather than a print to chase. The plan favours the 92.70 to 93.10 band, respects 90.95 and keeps size measured, because the constraint can escalate or resolve on a single headline in either direction, with no scheduled first-order energy event on Wednesday's calendar to resolve it and the dense release block waiting on Thursday.
This is the read our members get every session, before the bell, with the levels drawn and the setup defined. See how the same dealer-positioning work turns into systematic signals.
View pricingThe complete data picture
Every number behind Wednesday’s plan, charted first; the full numeric reference follows underneath.
Full numeric reference, every remaining figure from the review
| Average | Value | Settle vs |
|---|---|---|
| 5-day | 91.61 | above by 1.42 |
| 20-day | 85.62 | above by 7.41 |
| 50-day | 80.29 | above by 12.74 |
| 100-day | 80.94 | above by 12.09 |
| 200-day | 72.88 | above by 20.15 |
| Level | Reference |
|---|---|
| 98.74 | the recomputed third resistance, reachable only on a genuine supply disruption and sitting just beneath the round 100 dollar level |
| 96.43 to 96.74 | the one average-true-range envelope ceiling and the recomputed second resistance, the objective for a day that clears the 94.73 to 94.88 band with conviction |
| 95.44 | where the 3 to 10 day average crossover stalls, a momentum-exhaustion marker and the first mechanical place a continuation move would pause |
| 94.73 to 94.88 | the session and 52-week high paired with the recomputed first resistance, target one, a single decision zone with no overhead supply above it |
| 94.28 | the post-settlement quote and the first reference the contract must reclaim on the reopen, a price it actually traded in the closing hour |
| 92.88 to 93.03 | the recomputed pivot paired with the settlement, the single most important level structure on the chart and the anchor for the primary setup |
| 92.70 to 93.10 | the primary buy band and entry, a pullback into the recomputed pivot rather than a chase of the post-settlement quote |
| 92.26 | the session open and the origin of the advance, a return here surrendering the day's gain above the open |
| 91.02 to 91.61 | the recomputed first support and the 5-day average, the deeper defensive band whose loss changes the short-term structure |
| 90.95 | the protective stop beneath the recomputed first support, total risk about 1.95 from the entry midpoint |
| 90.87 | the session low, set early and never revisited, a rejection point rather than a comfortable level |
| 89.63 to 89.02 | the one average-true-range envelope base and the recomputed second support, the statistical downside for an orderly corrective session |
| 87.16 | the recomputed third support, requiring a full unwind of the geopolitical premium built over recent sessions |
| 85.62 | the 20-day moving average, 7.41 beneath the settle, the clearest mean-reversion reference and the deeper structural support should the trend break |
| 80.29 to 80.94 | the 50-day and 100-day moving averages, the lone lagging crossover, a residue of the summer decline |
| 72.88 | the 200-day moving average, 20.15 beneath the settle, the plainest statement of how far this move has carried |
| Metric | Reading |
|---|---|
| Options surface | no liquid crude options proxy, the available exchange-traded fund surface carries forward-curve decay, so positioning is read from the physical and futures complex and no level in this review is derived from an options surface |
| Forward curve | the front October contract quoted 94.28 after settlement against the second-month November near 90.19, the spread steepening from 2.91 on prior closes to 4.09, backwardation of a shape that says the physical market pays a premium for immediate barrels |
| Refining margins | the gasoline margin computes near 43.57 dollars a barrel and the distillate margin near 98.82, a three-two-one blend near 61.99, describing refined-product scarcity with middle distillate the tightest point in the barrel |
| Brent to WTI | the waterborne benchmark settled 97.92 against WTI 93.03, a 4.89 premium widening to 4.99 on the post-settlement quotes, though Brent's 0.95 percent gain lagged WTI's 1.69 percent, unusual when the driver is Middle East supply risk |
| Historic volatility | 32.34 percent over 14 days against 29.99 percent over 20 and 43.15 percent over 50, so realised movement is picking up from a lull without yet matching the summer's turbulence |
| Product prices | the front gasoline at 3.2525 a gallon, distillate at 4.5678 and natural gas at 2.916 down 1.98 percent, the divergence in gas isolating the bid to oil-specific supply risk |
| Producer positioning | producers net long 309,402 and swap dealers net short 465,407 as of September 1, with front-month open interest 230,333 against 196,888 in the second month |
| Weekly turnover | volume of 403,395 contracts at 169 percent of the 20-day average confirms genuine participation rather than a thin holiday-week extension |
| Cohort | Weekly change |
|---|---|
| Technical positioning | the multi-indicator composite reads 88 percent buy overall, all six short-term components and all four medium-term components positive with the long-term group at 33 percent held back solely by the 50 against 100 day crossover, price above every moving average, the composite having moved from 32 percent sell a month ago to 48 percent a week ago to 88 percent now |
| Directional spread | the 14-day directional index at 21.95 with the positive directional indicator 33.30 against 14.46 negative, an 18.84 spread better than two to one, and the 9-day reaching 31.05, a trend strengthening rather than exhausting that qualifies the overbought oscillator readings |
| Managed money | a net long of 94,281 as of the week ended September 1, an increase of 10,261 on the week, 205,300 long against 111,019 short at a 1.85 ratio, speculative length added into strength before the escalation sequence |
| Producer hedging | producers net long 309,402 and swap dealers net short 465,407, while commercials held 885,135 long against 1,041,140 short for a net short of 156,005, essentially unchanged on the week at plus 241 |
| Positioning staleness | the report is current only to September 1, seven days old and predating the entire escalation sequence, so it describes the market's posture before the move and actual current length is very likely higher than reported |
| Coverage note | crude carries no liquid options-positioning proxy, so positioning is built from the weekly commitments data, the front-to-second-month spread that steepened from 2.91 to 4.09, the refined-product margins and the futures technical structure |
| Input | |
|---|---|
| Dollar index | 98.782, softer by 0.37 percent from a prior 99.150 and at a two-week low, so a weaker dollar mechanically supports the dollar-priced contract and the two moved in precise inverse fashion |
| Currency | much of the dollar weakness came through the yen, which appreciated sharply, the dollar-yen pair driven through 155.0 and on to 153.0 overnight on stronger Japanese data |
| Equity and volatility | bonds and equities fell as oil rose, the volatility index future quoted 16.65 up 2.36 percent, a cross-asset picture of supply-driven commodity strength pressuring risk assets rather than a broad risk-on advance |
| Industrial metal | copper reached a record high on a separate supply story, part of the same commodity-strength backdrop |
| Natural gas | settled 2.916 per million British thermal units, lower by 1.98 percent with domestic supplies well above average, a divergence arguing the crude bid is specific to oil supply risk rather than a broad energy repricing |
| Global benchmark grade | the waterborne benchmark settled 97.92, higher by 92 cents or 0.95 percent and quoted 99.27 after hours, the premium to WTI 4.89 on the settlements and 4.99 on the post-settlement quotes |
| Product complex | gasoline at 3.2525 a gallon implies a margin near 43.57 a barrel and distillate at 4.5678 implies a margin near 98.82, a three-two-one blend near 61.99, extraordinary figures locating the constraint in refining capacity |
| Forward curve | the front-to-second-month spread widened from 2.91 to 4.09 in a single session, steepening backwardation by 1.18, prompt barrels paying a premium over deferred barrels consistent with genuine supply anxiety |
| When | Event |
|---|---|
| Mon Sep 7 | the United States Labor Day holiday, no pit session, which shifted the weekly government inventory release from Wednesday to Thursday |
| Tue Sep 8 | the October contract advanced 1.55 to a 93.03 settlement and a new 52-week high at 94.73 on a compressed afternoon sequence of Middle East supply headlines, the post-settlement quote reading 94.28 |
| Wed Sep 9 | a positioning session with no scheduled first-order energy data, the monthly short-term energy outlook at 12:00 PM ET tentatively confirmed as the only energy-specific item, leaving headline flow as the live driver |
| Thu Sep 10 | the dense session, the producer-group monthly report at 08:00 AM ET, a central bank rate decision at 08:15 AM ET, United States producer prices at 08:30 AM ET and the delayed weekly crude inventory count at 12:00 PM ET against a prior 4.450 million barrel draw |
| Fri Sep 11 | the international energy agency monthly report at 04:00 AM ET and United States consumer prices at 08:30 AM ET, forecast 0.4 percent monthly and 3.4 percent annually, ahead of the September 16 policy meeting |
The economic releases referenced above are published on the official government calendars below. Price levels are derived from standard technical and statistical methods, and the market read is AlgoIndex's own analysis. How we grade these calls is set out in our performance methodology.
- US Bureau of Economic Analysis, Personal Income and Outlays (PCE)
- US Bureau of Economic Analysis, Gross Domestic Product
- US Bureau of Economic Analysis, release schedule
- US Census Bureau, Advance Durable Goods (M3) release schedule
- US Energy Information Administration, Weekly Petroleum Status Report
- US Department of the Treasury, auction schedule and results
- AlgoIndex performance methodology



