
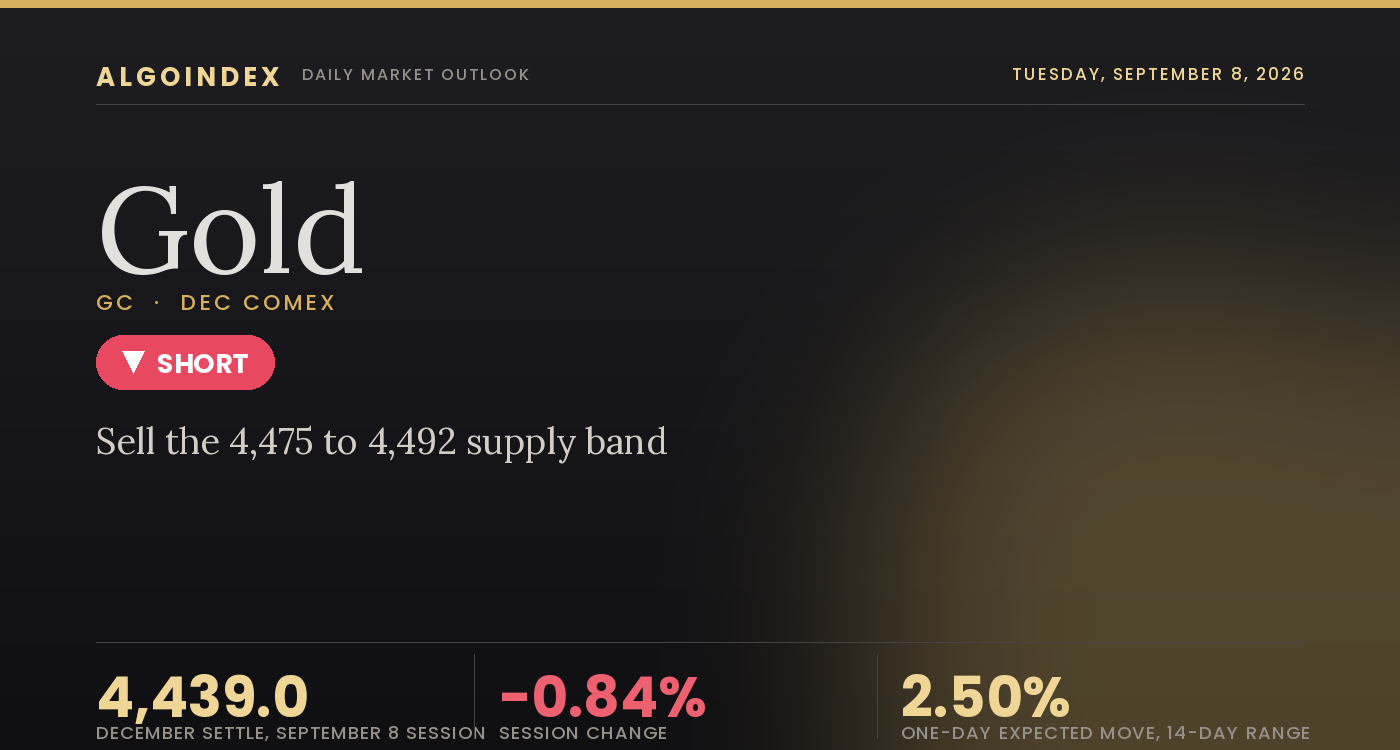
Gold turned in a moderate decline on Tuesday, and the character of the session was set by the rate-and-dollar complex rather than the physical or geopolitical side. The December contract settled at 4,439.0, down 37.6 points or 0.84 percent from the prior 4,476.6, after opening at 4,466.5 below the prior settle, grinding lower through the day, tagging a session low of 4,381.0 and recovering into the settle to finish roughly 54 percent of the way up the 107.8-point range. Turnover of 214,258 contracts against open interest of 317,876 pointed to a steady, orderly distribution rather than a liquidation event, and the even, indecisive close neither confirmed the sellers nor rescued the buyers. The notable feature of the day was not the size of the decline but its context: gold fell even as a sharp escalation in the Middle East unfolded, which is the central tension into Wednesday. The ten-year yield firmed by roughly half a percent toward the 4.80 area, and that rise in nominal yields, layered on a resilient labor print and sticky inflation data, outweighed the risk-off bid that a fresh round of strikes would normally deliver. The dollar index held close to unchanged near 98.84, so the pressure came primarily through the rate channel.
The decline sits inside a larger correction rather than a trend reversal. The close leaves gold below its 5-day at 4,446.0, its 20-day at 4,520.5, its 100-day at 4,448.3 and its 200-day at 4,645.0, yet still above its rising 50-day at 4,305.0, a congested picture that reads as a corrective pullback within a larger advance. Price is working through the middle of a broad consolidation bounded above near the summer high at 4,755.0 and below at the 4,015.6 range low, well off the 52-week high near 5,781.8. The multi-indicator composite reads a mild sell overall at 16 percent sell, with the short-term set heavier at 40 percent sell while the longer-horizon trend signal registers a buy. The structural contradiction into Wednesday is a hawkish rate repricing pressing gold lower even as an August central-bank purchase of 650,000 ounces and a standing supply-risk premium argue for a base of demand underneath. Wednesday is a data-light session for gold-relevant US catalysts, with the ten-year note auction the main scheduled item, before the week decisive inflation prints arrive Thursday and Friday.
A rate-led decline below the 20-day into a data-light Wednesday
The daily picture is a corrective body that keeps the short-term sequence pointed down. Gold settled at 4,439.0, below the 20-day at 4,520.5, below the 100-day at 4,448.3 and below the 200-day at 4,645.0, while holding above the rising 50-day at 4,305.0 and just beneath the 5-day at 4,446.0. The settlement sits just above the fresh daily pivot at 4,436.0, effectively on its own session midline, and the prior settle at 4,476.6 now becomes the immediate overhead reference, reinforced by the contract inability to hold the 4,480s. The 4,381.0 session low marks the immediate structural base for the daily frame. The gap down to the 50-day at 4,305.0 shows how much cushion the intermediate trend still holds, while the distance up to the 200-day at 4,645.0 frames how much overhead work a recovery would require.
Momentum is neutral-to-soft rather than washed out, which leaves room for further drift. The 14-day relative-strength reading sits near 46.98, with the 9-day near 41.91 and the 20-day near 49.15, a neutral-to-soft band with no oversold signal yet. The 14-day stochastic prints a percent-K near 28.82 and a percent-D near 34.37, in the lower portion of its range, and the 9-day raw reading near 18.27 is approaching the oversold zone on the shortest horizon. The 14-day directional index near 23.17 sits just above the mark that separates trending from ranging, with the positive and negative directional lines balanced at 20.82 each, while the 9-day set carries a slightly heavier negative line. The trend engines describe a market with a modest, non-committal downward drift rather than a committed downtrend.
The 4,475 to 4,492 supply band and the 4,381 to 4,384 shelf frame Wednesday
Two areas frame the session. Overhead, the nearest ceiling is the 4,448 to 4,451 hinge, where the 100-day average at 4,448.3 and the 14-day relative-strength midline near 4,451 converge, a line the market must clear to stabilize. Above it, the prior settle at 4,476.6 and the first computed resistance at 4,491.5 align with the session high at 4,488.8 to form the 4,475 to 4,492 supply band, the primary rejection zone. Higher still, the 20-day average at 4,520.5 is the structural line whose reclaim would flip the short-term posture, and the second computed resistance at 4,544.1 and third at 4,599.3 mark the extended targets, with the summer high at 4,755.0 the deeper ceiling. Beneath the settle, the fresh daily pivot at 4,436.0 is the session magnet, the first computed support at 4,383.7 overlaps the session low at 4,381.0 to form the 4,381 to 4,384 shelf the market defended late, and beneath it the one-month low at 4,329.2 and the second computed support at 4,328.5 converge into the 4,328 to 4,329 base. A break there exposes the third computed support at 4,275.9, with the rising 50-day at 4,305.0 as the primary trend-support anchor in between.
Fade the rally, respect 4,521, key off the rate follow-through
The plan fades a rally into the 4,475 to 4,492 supply band, a rejection where the prior settle at 4,476.6, the session high at 4,488.8 and the first computed resistance at 4,491.5 converge, rather than pressing a break lower without a rally to sell into. Price closed below the 5, 20, 100, and 200-day averages with a mild-sell composite and a rising rate backdrop, and with Wednesday data-light, a rejection at the band favors continuation toward the pivot and lower support. The stop is 4,521, above the 20-day average at 4,520.5, about 37.5 points from a mid-band entry near 4,483.5. Targets run to 4,436 at the fresh pivot and session magnet, then 4,384 at the first computed support and session-low shelf, then an extended 4,328 at the second computed support and one-month-low base, worked only if momentum extends through the second target on volume, for reward-to-risk near 1 to 1.3, 1 to 2.7 and 1 to 4.1. One consideration governs the trade in real time. Wednesday carries no first-order US macro print in the morning window, so the 9:30 AM ET cash open keys off the rate follow-through and any Middle East supply headline, with the ten-year note auction at 1:00 PM ET the main afternoon risk if it lifts yields. A decisive settle back above 4,520 that reclaims the 20-day and the prior settle negates the continuation thesis and opens the 4,544 to 4,599 zone, as would a softer producer-price or consumer-price print later in the week, a sharp reversal lower in the ten-year yield, a fresh escalation in supply risk, or another official-sector purchase headline that restores the safe-haven and lower-real-rate bid. Our published record lays out how we grade these calls.
Tuesday turned in a rate-led decline: a 37.6-point drop to a 4,439.0 settlement near the middle of the range, driven by a ten-year yield firming toward 4.80 rather than a safe-haven bid, even as a Middle East escalation unfolded. The close leaves gold below the 5, 20, 100, and 200-day averages but above the rising 50-day, and the 4,475 to 4,492 supply band is the ceiling the market must reclaim. Fading a rally into that band toward the 4,436 pivot and the 4,381 to 4,384 support shelf, with the rate follow-through the first-order input into a data-light Wednesday, is the trade.
A rate-led decline below the 20-day into a data-light Wednesday. The edge is fading a rally into the 4,475 to 4,492 supply band toward the 4,436 pivot and the 4,381 to 4,384 shelf, and a decisive reclaim above 4,520 is the line that reopens the 4,544 to 4,599 zone.
This is the read our members get every session, before the bell, with the levels drawn and the setup defined. See how the same dealer-positioning work turns into systematic signals.
View pricingThe complete data picture
Every number behind Wednesday’s plan, charted first; the full numeric reference follows underneath.
Full numeric reference, every remaining figure from the review
| Average | Value | Settle vs |
|---|---|---|
| 5-day | 4,446.0 | below by 7.0 |
| 20-day | 4,520.5 | below by 81.5 |
| 50-day | 4,305.0 | above by 134.0 |
| 100-day | 4,448.3 | below by 9.3 |
| 200-day | 4,645.0 | below by 206.0 |
| Level | Reference |
|---|---|
| 5,781.8 | 52-week high, a distant structural ceiling |
| 4,755.0 | summer and one-month high, the ceiling of the multi-week range |
| 4,679.7 | year-to-date average, well overhead |
| 4,645.0 | 200-day average, the deeper overhead line |
| 4,599.3 | third computed resistance pivot, the extended target |
| 4,544.1 | second computed resistance pivot, top of the reopen zone |
| 4,520.5 | 20-day average, the reclaim line and stop reference |
| 4,491.5 | first computed resistance, top of the supply band and short entry ceiling |
| 4,488.8 | session high, rejected early inside the supply band |
| 4,476.6 | prior settlement, immediate overhead reference |
| 4,475 to 4,492 | supply band, the short entry, faded on a rally |
| 4,451.0 | 14-day relative-strength midline, part of the 4,448 to 4,451 hinge |
| 4,448.3 | 100-day average, the immediate overhead hinge |
| 4,446.0 | 5-day average, just above price |
| 4,439.0 | December settle |
| 4,436.0 | fresh daily pivot, the session magnet and first target |
| 4,383.7 | first computed support, the session-low shelf and second target |
| 4,381.0 | session low, anchor of the 4,381 to 4,384 shelf |
| 4,329.2 | one-month low, the nearer downside base |
| 4,328.5 | second computed support, the 4,328 to 4,329 base and extended target |
| 4,305.0 | 50-day average, the rising trend-support anchor |
| 4,275.9 | third computed support, the deep downside |
| 4,015.6 | 13-week range low, the far backstop |
| 3,800.0 | 52-week low, the longest-horizon support |
| Metric | Reading |
|---|---|
| Gold-ETF proxy price | near 399, the positioning reference for the metal on a September 5 snapshot that lags Tuesday live positioning |
| Futures-to-proxy multiplier | about 11.1, so the 399 proxy area maps to the 4,439 futures zone |
| Call-side dealer gamma | about negative 426.8 million on the call side |
| Put-side dealer gamma | about positive 138.9 million, the smaller leg |
| Net configuration | net negative dealer gamma, a posture in which hedging tends to amplify directional moves rather than dampen them, consistent with the choppier action through the pullback |
| Options-implied one-day move | about 6.18 dollars on a base near 399, roughly 1.55 percent, on the order of 69 gold points scaled to the futures |
| Implied-volatility rank | near 32.98 percent, a moderate-to-low reading that suggests options are not pricing extreme stress |
| Skew rank | near 74 percent, an elevated tilt pointing to firmer demand for downside protection |
| Input | |
|---|---|
| Dollar | the dollar index held near unchanged at 98.84, so the headwind on Tuesday arrived primarily through the rate channel rather than a currency surge, an unusual configuration in which gold fell without a matching dollar move |
| Real yields | the ten-year nominal yield firmed by roughly half a percent toward the 4.80 area, and with recent inflation prints still sticky the implied rise in real yields is the cleanest explanation for the decline against a risk-off backdrop that would ordinarily support the metal |
| Fed and policy | a strong labor print landed at 162,000 against a consensus near 55,000, the recent core inflation gauge held at 3.7 percent year over year and the one-year consumer inflation expectation eased slightly to 3.58 percent, with investment-bank commentary now leaning toward tighter policy later this month rather than easing, a path with limited room to turn dovish in the near term |
| Geopolitics | a sharp Middle East escalation unfolded, with reports of US strikes on Iranian oil tankers near Kharg Island and the Jask coast, an earlier refinery strike and retaliatory naval warnings; that gold did not rally on this backdrop is the first-order observation, and the geopolitical premium remains a live upside tail if supply routes come under threat |
| Crude oil | front-month US crude firmed by about 1.7 percent toward the low nineties and the international benchmark settled near 97.92, up just under one percent, an inflationary impulse that could eventually support gold through the real-asset channel even as it lifts yields in the near term |
| Equities and cross-asset | the broad index future softened by about half a percent and the volatility gauge firmed nearly three percent to 15.71, a mild uptick in risk aversion that did not translate into gold strength, while copper pushed to a record near 14,600 per ton on a supply squeeze |
| Central-bank demand | the most important gold-specific headline was structural: China central bank added 650,000 ounces in August, its largest single monthly purchase since 2023, price-insensitive accumulation that is the primary reason the corrective pullback has stayed orderly |
| Positioning | no fresh weekly positioning-report data released this session, with turnover of 214,258 contracts against open interest of 317,876 consistent with orderly two-way flow rather than aggressive new short-selling or capitulation |
| Momentum composite | the multi-indicator composite read a mild sell overall at 16 percent sell, with the short-term set heavier at 40 percent sell while the longer-horizon trend signal registered a buy, the quantitative echo of a corrective pullback inside a larger advance |
| When | Event |
|---|---|
| Tue Sep 8 | the reviewed session, gold down 0.84 percent to 4,439.0 as the ten-year yield firmed toward 4.80 and outweighed a Middle East escalation |
| Tue night | Chinese consumer- and producer-price inflation around 9:30 PM ET, the notable Asian catalyst into Wednesday |
| Wed Sep 9 | a data-light US session whose single first-order item is the ten-year note auction at 1:00 PM ET, best read as positioning ahead of the back-loaded week |
| Thu Sep 10 | the euro-area rate decision at 8:15 AM ET and the US producer-price report at 8:30 AM ET, the decisive near-term catalysts |
| Fri Sep 11 | US consumer-price data at 8:30 AM ET, the week decisive inflation catalyst |
| week after | the policy-decision window, the event the inflation run points toward |
The economic releases referenced above are published on the official government calendars below. Price levels are derived from standard technical and statistical methods, and the market read is AlgoIndex's own analysis. How we grade these calls is set out in our performance methodology.
- US Bureau of Economic Analysis, Personal Income and Outlays (PCE)
- US Bureau of Economic Analysis, Gross Domestic Product
- US Bureau of Economic Analysis, release schedule
- US Census Bureau, Advance Durable Goods (M3) release schedule
- US Energy Information Administration, Weekly Petroleum Status Report
- US Department of the Treasury, auction schedule and results
- AlgoIndex performance methodology



