
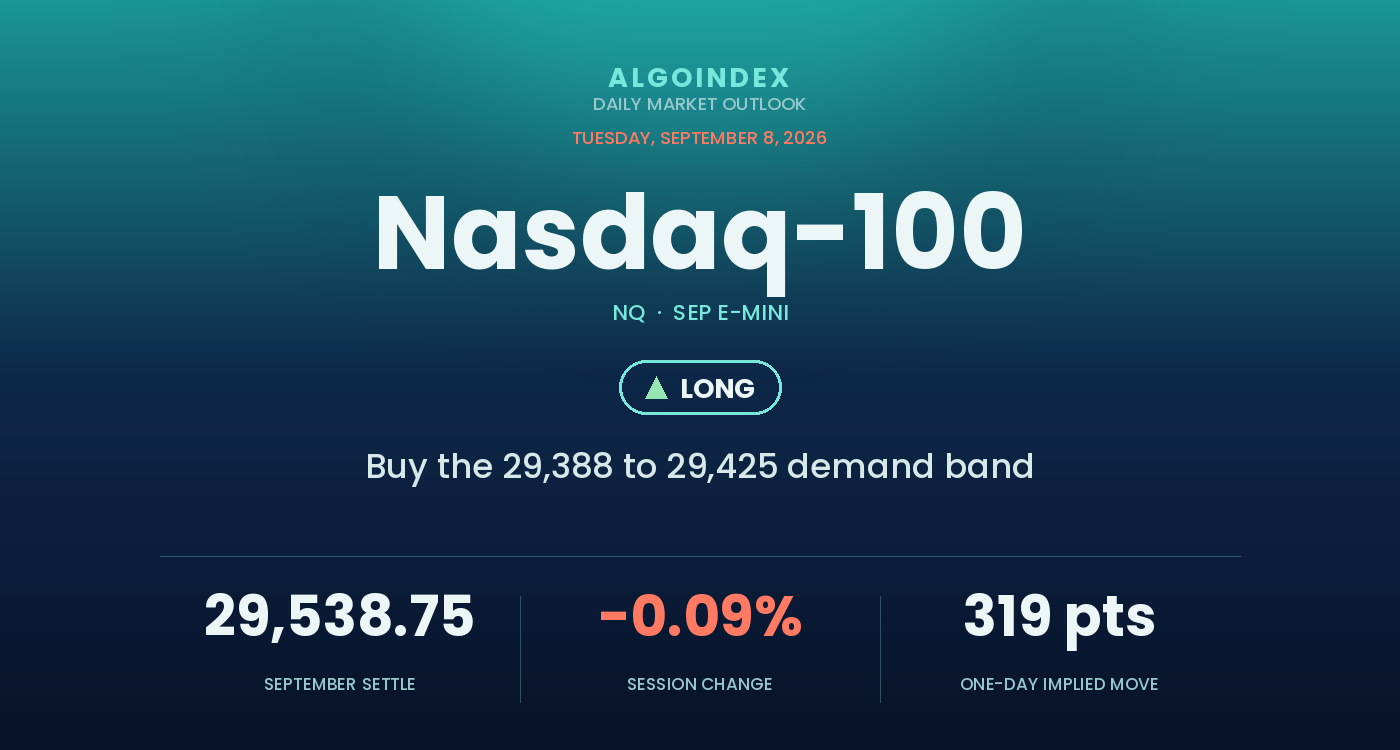
The September Nasdaq-100 settled Tuesday at 29,538.75, down 26.50 points or 0.09 percent from the prior daily settlement of 29,565.25, on a wide 340.00-point range between a 29,764.75 high and a 29,424.75 low. The cash Nasdaq-100 index closed at 29,507.70, down 0.12 percent, placing the measured futures basis at plus 31 points, the conversion used throughout this review. The flat headline conceals a one-directional day: the contract traded up 229.50 points from the open, gave back 226.00 of that into the settlement and finished in the lower third of its range. What makes the session worth studying is the dispersion around it. The S&P 500 fell 0.58 percent and the Dow fell 1.18 percent while the technology index held near flat, outperformance of roughly ten to one, and semiconductors gained about 2 percent as a sector while software lost about 2 percent, a rotation into artificial-intelligence capital-expenditure exposure inside a risk-off session rather than a broad advance.
Two forces defined the day. The constructive half was a semiconductor bid carried over from an Asian technology rally on continued large-language-model momentum, with several equipment, processor, storage and networking names closing sharply higher. The risk-off half came from the Persian Gulf, where a direct military exchange involving oil infrastructure and maritime traffic escalated into and through the cash close and lifted crude more than 1 percent to a three-month high. Against that, investment-bank commentary now has a rate increase at the September 16 meeting as the base case rather than the tail, producer prices land Thursday with the annual rate forecast to jump from 4.7 to 5.3 percent, consumer prices land Friday, and index options flow was the most defensive in a month. Price sits above the 5-day, 50-day, 100-day and 200-day averages and 11.53 points below the 20-day, with a 14-day directional index of 12.94 and relative strength pinned near 52. The setup that follows buys the retest of the 29,388 to 29,425 support confluence rather than pressing the current price, at reduced size.
Below the 20-day, above the rest of the stack
The structural read starts with location, and it is constructive with one qualification. At 29,538.75 the contract sits above its 5-day average at 29,388.10 by 150.65 points, its 50-day at 29,373.31 by 165.44 points, its 100-day at 29,305.41 by 233.34 points and its 200-day at 27,455.47 by 2,083.28 points, above the year-to-date average at 27,689.72 as well, and below only the 20-day at 29,550.28, by 11.53 points or four hundredths of one percent. Price is above every average except the one it is effectively pinned to, which is what a directionless market looks like at the daily level. The distribution matters more than the count: the 5-day sits 162 points beneath the 20-day, and the 50-day and 100-day stack tightly into an 83-point shelf between 29,305 and 29,388 that any deeper retracement must work through. The 20-day interaction is the single most important daily-structure fact, an 11.53-point shortfall the first hour of Wednesday trade can reclaim without any change in the underlying environment.
Momentum is neutral without being stretched, which is itself the finding. Relative strength reads between 51.50 and 53.47 across every period measured, as close to neutral as this indicator gets, and it removes momentum from the list of usable inputs for Wednesday. Stochastics split by lookback: the 9-day raw sits at 69.15 percent with its percent-K at 71.15 above its percent-D at 66.04, while the 20-day raw reads 43.19 percent below its midpoint, short-horizon recovery inside a medium-horizon drift. Trend strength is close to absent, the directional index reading 15.92 on the 9-day, 12.94 on the 14-day and 12.39 on the 20-day, all deeply beneath the level at which directional movement is considered meaningful, and the 14-day positive and negative components are separated by half a point at 21.19 against 20.69. The multi-indicator composite reads 56 percent buy overall with a weak, weakening strength label, decomposed into a 20 percent short-term, 75 percent medium-term and 67 percent long-term reading, near-term deterioration inside an intact longer-term advance.
The 29,388 to 29,425 confluence anchors Wednesday
Two structures frame the session. Beneath the market, the band from 29,388 to 29,425 is the support confluence and the location of the entry, where first pivot support at 29,387.42, the 5-day average at 29,388.10 and the hourly overlay boundary at 29,391.48 stack inside five points at the base, the 715 proxy strike converts to roughly 29,410 inside the band, and the level associated with a 14-day relative-strength reading of 50 at 29,425.05 marks the top. Beneath it, the 50-day average at 29,373.31 extends the shelf, and the 29,306 gamma concentration and 100-day confluence is the line whose failure ends the thesis. Overhead, the first task is a reclaim of the 29,546 to 29,576 shelf formed by the 70 percent stochastic threshold, the 20-day average and the pivot point, and above it the 29,635 retracement and stochastic confluence and the 29,727 first pivot resistance are what convert the shelf into a springboard. Wednesday carries no first-order United States release before the afternoon, so the open trades the level map on its own.
Buy the confluence, scale at the 20-day, size it down
The plan buys a retest of the 29,388 to 29,425 support confluence, where first pivot support, the 5-day average, the hourly overlay boundary and the relative-strength midline level converge inside 37 points and the proxy 715 strike converts into the interior of it, leaning on a settle that holds above the 5-day, 50-day, 100-day and 200-day averages with the medium and long-term composite components at 75 and 67 percent buy while the cash index stays in a positive-gamma, move-dampening configuration above roughly 29,301. The stop is 29,318, beneath the 50-day average at 29,373.31 and one standard-deviation support at 29,325.18, roughly 88 points from the 29,406 entry midpoint, and it sits twelve points above the 29,306 gamma confluence by design, because a market trading into that level has already broken the structure the setup relies on. Targets run to 29,550 at the 20-day average the settlement failed by 11.53 points, then 29,635 at the confluence of the 50 percent four-week retracement and the 80 percent stochastic threshold, then an extended 29,727 at first pivot resistance, taken only if momentum extends through the second target on expanding volume, for approximately 1 to 1.6, 1 to 2.6 and 1 to 3.6. Sustained trade beneath 29,305 ends the thesis, removing the trend-following and positioning support in a single move and reopening 29,236 and then the 28,927.25 September 2 low. Three conditions void the setup in real time: a further leg in the Persian Gulf that lifts crude decisively above its three-month high into Thursday producer prices, a poorly received 1:00 PM ET product event, and a weak ten-year auction in that same hour. Reduced size is appropriate, since the overnight carries live headline risk not embedded in a 15.71 volatility index and the afternoon stacks corporate and rates catalysts together. Our published record lays out how we grade these calls.
A settle above the 5-day, 50-day, 100-day and 200-day averages with the medium and long-term composite components at 75 and 67 percent buy, yet trend strength close to absent, the settlement 11.53 points below the 20-day and 226.00 points beneath its own high, and index options flow the most defensive in a month. The 29,388 to 29,425 support confluence is the referee: a retest that holds it works toward the 29,550 average and the 29,576 pivot, while a sustained break of 29,305 opens 29,236 and the 28,927 September 2 low.
A market above most of its stack but pinned to the 20-day is a retest to buy at the 29,388 to 29,425 support confluence, not a settlement to press. The edge is a hold of that band above the 29,318 stop, and the invalidation is sustained trade beneath the 29,305 gamma concentration and 100-day confluence into a negative-gamma proxy environment.
This is the read our members get every session, before the bell, with the levels drawn and the setup defined. See how the same dealer-positioning work turns into systematic signals.
View pricingThe complete data picture
Every number behind Wednesday’s plan, charted first; the full numeric reference follows underneath.
Full numeric reference, every remaining figure from the review
| Average | Value | Settle vs |
|---|---|---|
| 5-day | 29,388.10 | settle above by 150.65, 0.51 percent |
| 20-day | 29,550.28 | settle below by 11.53, 0.04 percent, a rounding-error shortfall the first hour of Wednesday trade decides |
| 50-day | 29,373.31 | settle above by 165.44, 0.56 percent |
| 100-day | 29,305.41 | settle above by 233.34, 0.80 percent |
| 200-day | 27,455.47 | settle above by 2,083.28, 7.59 percent, the widest gap in the stack |
| Year-to-date | 27,689.72 | settle above by 1,849.03, 6.68 percent |
| Level | Reference |
|---|---|
| 31,100.00 | 52-week high set June 3, 5.02 percent above the settlement, a structural rather than tactical reference |
| 30,975.50 | 13-week high set June 16, the structural repair level 4.87 percent above the settlement |
| 30,343.00 | one-month high set August 17, the objective for any sustained recovery, 804 points above the settlement |
| 30,067.42 | third pivot resistance, the upper mechanical boundary of the ladder, effectively coincident with the 30,000 cash strike |
| 30,031.00 | 30,000 cash strike converted to the futures domain, a listed strike with meaningful positioning and a round-number magnet |
| 29,916.08 | second pivot resistance, an extended target outside a single-session expectation absent a catalyst |
| 29,840.79 | two standard-deviation resistance on a five-period closing basis, roughly 0.8 times the 14-day daily range above the settlement |
| 29,790.25 | 40-day average interaction band, the upper edge of the rejection zone the session high stopped short of |
| 29,767.29 | hourly overlay upper boundary, 2.54 points above the verified session high |
| 29,764.75 | Tuesday verified session high, the level the market rejected, giving back 226.00 points into the settlement |
| 29,727.42 | first pivot resistance, the extended third target, roughly half the 14-day daily range above the settlement |
| 29,635.00 | the 50 percent four-week retracement at 29,635.13 and the 80 percent stochastic threshold at 29,634.65, half a point apart, the second target |
| 29,576.08 | pivot point published for Wednesday, 37 points above the settlement and part of the 29,546 to 29,576 shelf |
| 29,550.28 | 20-day moving average, the ceiling the settlement failed by 11.53 points and the first target |
| 29,546.22 | 70 percent stochastic threshold, immediately beneath the 20-day average, tightening the shelf |
| 29,538.75 | September settle, the reference point for the session |
| 29,533.83 | 38.2 percent retracement of the 13-week range, five points beneath the settlement |
| 29,531.00 | 29,500 cash strike converted to the futures domain, a listed strike price closed on top of |
| 29,490.46 | 18-day average interaction threshold, where the proxy modeled gamma-flip equivalent near 29,492 also lands, the first level dealer hedging is expected to change character |
| 29,468.00 | the 3-10 day average crossover stall at 29,471.46 and the 38.2 percent four-week retracement at 29,468.07, roughly three points apart |
| 29,425.05 | level associated with a 14-day relative-strength reading of 50, the buy-zone top |
| 29,410.00 | 715 proxy-strike equivalent, a listed strike converting into the interior of the entry zone |
| 29,387.42 | first pivot support at 29,387.42, the 5-day average at 29,388.10 and the hourly overlay boundary at 29,391.48, three methods inside five points, the buy-zone base |
| 29,373.31 | 50-day moving average, fourteen points beneath the pivot confluence, extending the shelf |
| 29,325.18 | one standard-deviation support, paired beneath the protective stop |
| 29,318.00 | protective stop, beneath the 50-day average and one standard-deviation support, twelve points above the deeper gamma confluence by design |
| 29,306.00 | the primary gamma concentration and call-side hedging boundary from the cash-index dataset, aligned with the 100-day average, the most significant single level and the invalidation |
| 29,305.41 | 100-day moving average, landing on the same price as the gamma concentration |
| 29,301.00 | modeled volatility threshold converted from the cash-index dataset, just beneath the gamma confluence |
| 29,236.08 | second pivot support, effectively coincident with two standard-deviation support at 29,236.71 |
| 29,047.42 | third pivot support, beneath the listed range |
| 28,927.25 | one-month low set September 2, 611.50 points below the settlement, whose failure would end the recovery |
| 27,689.72 | year-to-date average, 1,849.03 points beneath the settle |
| 27,455.47 | 200-day moving average, 2,083.28 points beneath the settle, the widest gap in the stack |
| Metric | Reading |
|---|---|
| Proxy and index surface | the proxy one-month implied volatility reads 17.07 percent against 12.85 percent realized, a 4.22-point premium, with an implied volatility rank of 14.77 percent very low in its own history and a skew rank of 63.78 percent that is elevated; the cash index shows a positive gamma tilt of 1.473 and positive gamma notional of 16.457 million dollars |
| Implied one-day move | about 319 points, 1.079 percent scaled to the futures settle, below the 383.34-point 14-day average daily range and well below the 449.46-point 14-day true range, with the proxy implying the same 1.079 percent on a 718.00 dollar price at 7.75 dollars |
| Dealer gamma, proxy | gamma notional negative 165.38 million with a 0.832 tilt below the neutral 1.0, call gamma negative 216.36 million against put gamma negative 2.29 billion, so the proxy complex is heavily short gamma and is the configuration that governs behavior on a fast move lower |
| Options volume skew | proxy puts 989,455 against calls 765,754 on the session, a put-to-call open-interest ratio of 1.35 with put open interest of 7.168 million against call open interest of 5.229 million |
| Gamma references, futures domain | the proxy modeled gamma-flip level near 29,492 within three points of the 18-day threshold, the modeled volatility threshold near 29,301, the primary gamma concentration and call-side hedging boundary near 29,306, and the put-side hedging boundary near 28,031 |
| Flow composition | index options flow at negative 13 billion dollars of delta, the most negative reading in 30 days, from 7 billion of call selling and 6 billion of put buying, longer-dated defensive positioning rather than the tactical same-day flow of the prior week |
| Expiry and basis | the largest proxy gamma expiry September 17 and the largest delta expiry June 2027, with September first notice and expiration on September 18 ten days out, open interest of 290,170 and the September futures at a measured 31-point premium to the cash index |
| Cohort | Weekly change |
|---|---|
| Dealers and intermediaries | 58,239 long against 137,013 short as of September 1, a net short of roughly 78,800 with 14,510 shorts added, the intermediating side rebuilding the short end |
| Commercial participants | 155,766 long against 201,186 short, a net short of roughly 45,400 with 8,002 shorts added |
| Non-commercial participants | 89,434 long against 63,544 short, a net long of roughly 25,900 after cutting 15,049 shorts and adding 802 longs |
| Leveraged funds | 55,361 long against 69,453 short, a net short of roughly 14,100 after cutting 23,620 shorts and adding 3,520 longs, an aggressive covering move |
| Asset managers | a net long of roughly 71,900, close to unchanged on the week |
| Positioning read | speculative shorts were covered aggressively into the start of September, so the short base that fuels upside acceleration has largely been spent, arguing against a sharp squeeze-driven recovery |
| Input | |
|---|---|
| Federal Reserve policy | investment-bank commentary now describes the September 16 decision as a close call in which the base case favors a rate increase later this month rather than a hold, a material shift from the tail toward the base case, with a bearish flattening of the curve noted as typically supportive of the dollar |
| Rates and inflation | producer prices arrive Thursday with the annual headline forecast to rise from 4.7 to 5.3 percent and the core annual rate from 4.2 to 4.6 percent, and consumer prices arrive Friday with the monthly headline forecast at 0.4 percent against 0.1 percent prior, the annual headline at 3.4 percent unchanged and the core annual rate at 2.4 percent; the ten-year note traded at 4.793 percent on the evening read |
| Semiconductor leadership | semiconductors gained about 2 percent as a sector while software lost about 2 percent, a 4-point spread inside the same index on a single day, after Asian technology and semiconductor names rallied on continued large-language-model momentum with one large Japanese holding company up roughly 30 percent over three sessions |
| Mega-cap and AI capex | Wednesday carries the sector largest scheduled single-name event, a major hardware product event at 1:00 PM ET expected to unveil the first foldable handset from the largest index constituent, whose index weight means its reception moves the index directly; on Tuesday a large biotechnology constituent fell 10.08 percent and a professional-information services name fell 6.50 percent |
| Cross-asset and volatility | the volatility index rose about 3 percent to close at 15.71 after printing its lowest intraday level of the year the prior Friday, with its own volatility measure up 4 points to 88.69; copper reached a record 14,617 dollars per tonne, the yen appreciated sharply with the dollar cross extending toward 153.0, the dollar index stood at 98.808 and the largest cryptocurrency traded 78,445.66, down 0.82 percent |
| Geopolitical | the Middle East escalation became a direct military exchange through and after the cash close, with reported explosions at Iran principal crude export terminal, reported United States strikes on Iranian tankers and a Revolutionary Guard warning to tanker crews near Gulf ports; crude rose more than 1 percent to a three-month high, the international benchmark near 100 dollars and the United States benchmark approaching 93, a live situation that trades overnight |
| When | Event |
|---|---|
| Tue Sep 8 | the reviewed session, a 0.09 percent decline to 29,538.75 on a wide one-directional day, the technology index outperforming the broad market roughly ten to one on a semiconductor-led rotation inside a risk-off tone |
| Wed Sep 9 | the outlook session, a light macro day whose single first-order event is the 1:00 PM ET hardware product event stacked in the same hour as the ten-year note auction and European central bank remarks |
| Thu Sep 10 | the heaviest day, with the monthly oil report, the European central bank decision at 8:15 AM ET with a hike to 2.65 percent forecast, United States producer prices, jobless claims, a thirty-year auction, and two enterprise-software reports after the close with implied moves near 10 and 7 percent |
| Fri Sep 11 | United States consumer prices at 8:30 AM ET, the monthly headline forecast at 0.4 percent against 0.1 percent prior, followed by consumer sentiment at 10:00 AM ET |
| Sep 16 to 18 | the policy meeting September 16 with a rate increase now the base case, the largest gamma expiration September 17 and the quarterly expiration and September futures expiration September 18 |
The economic releases referenced above are published on the official government calendars below. Price levels are derived from standard technical and statistical methods, and the market read is AlgoIndex's own analysis. How we grade these calls is set out in our performance methodology.
- US Bureau of Economic Analysis, Personal Income and Outlays (PCE)
- US Bureau of Economic Analysis, Gross Domestic Product
- US Bureau of Economic Analysis, release schedule
- US Census Bureau, Advance Durable Goods (M3) release schedule
- US Energy Information Administration, Weekly Petroleum Status Report
- US Department of the Treasury, auction schedule and results
- AlgoIndex performance methodology



