
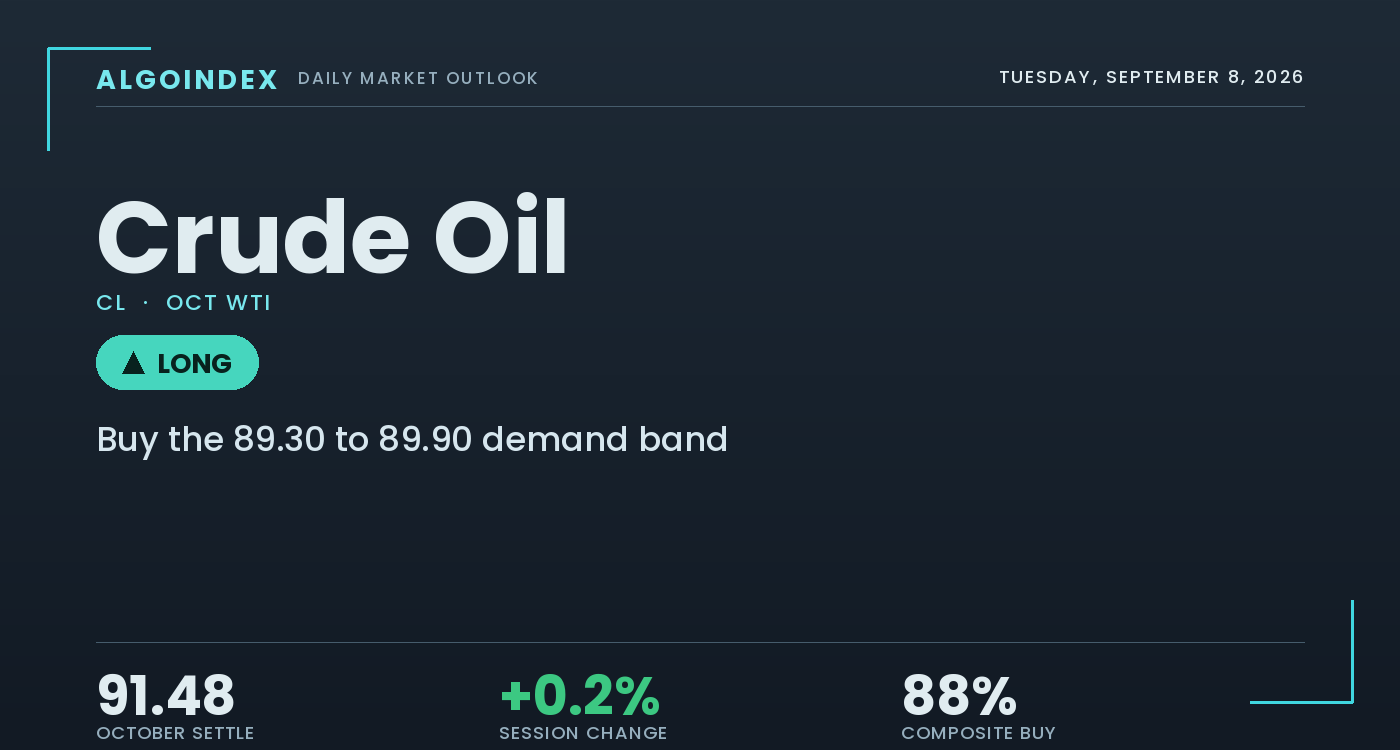
Crude oil settled Friday at 91.48, higher by 18 cents or 0.20 percent from Thursday's 91.30 settlement, and the headline change conceals almost everything that mattered. The October contract opened at 91.67, was sold down to 88.72 by mid-session as it broke an important support shelf, then recovered 2.76 dollars into the 2:31 PM ET settlement to finish at 80.0 percent of the day's range. The full range measured 3.45, or 103 percent of the 14-day average true range of 3.36, so in average-range terms this was an ordinary day. In structural terms it was not: the morning broke first pivot support at 89.41 and the one standard deviation support at 89.09, the afternoon repaired the damage completely, and the post-settlement electronic print drifted 26 cents lower to 91.22 after the settlement was struck.
Two identifiable drivers pressed the market lower. The Saudi state oil company held its Arab Light official selling price to Asian buyers unchanged for October delivery against a widely held expectation of an increase near five dollars a barrel, a softer read on Asian demand than the market had positioned for, and no fresh military action was reported between the United States and Iran, allowing part of the accumulated conflict premium to bleed out. The recovery into the close carried a simpler explanation, short covering ahead of a three-day holiday weekend with the Strait of Hormuz situation unresolved. The structural contradiction into Tuesday is sharp. Trend condition is close to as strong as this market gets, with price above every moving average, a multi-indicator composite at 88 percent buy and a 14-day directional index that has turned up, the positive directional line at 30.38 against 15.74. Against that, momentum is stretched, stochastic readings between 88 and 94 percent on every lookback and the 9-day relative strength index at 75.02. A market this extended that also failed its first support test is one where both continuation and a deeper corrective leg remain live, and the three-day gap window magnifies both.
A shakeout beneath support that held, above every moving average
The constructive read starts with location. The 91.48 settlement sits above every average in the study, the 5-day at 89.95, the 9-day at 87.37, the 20-day at 84.98, the 50-day at 79.78, the 100-day at 80.79 and the 200-day at 72.71. The distance above the 20-day is 6.50 dollars, an extension of 7.65 percent, and the settlement stands 18.77 above the 200-day. The multi-indicator composite reads 88 percent buy overall, 12 of 13 component signals positive with the short-term and medium-term bands both at 100 percent and the long-term at 33 percent, the lone lagging element the 50-day at 79.78 sitting beneath the 100-day at 80.79. The 9-day directional index has risen to 28.76 and the 14-day positive directional line leads the negative 30.38 to 15.74, a trend gaining organisation, while the weekly candle gained 8.08 dollars or 9.69 percent and closed at 81.6 percent of its range, the higher-timeframe demand signal in which the intraday break must be read.
What argues the other way is the extension and the momentum. The settlement sits 6.50 dollars above the 20-day at a moment when the 14-day average true range is 3.36, so roughly two sessions of normal range separate spot from its own mean, and mean reversion does not require a bearish catalyst from here. Stochastics are the more emphatic warning, the 14-day raw reading 87.72, the 20-day 89.84 and the 50-day 93.62, readings that high across every horizon describing a market with little unused upside momentum in the short run. The 9-day relative strength at 75.02 is the only reading above 70, with the 14-day at 68.63 just beneath the overbought line and the 20-day at 64.32, and the level map places a 14-day reading of 70 at 92.36, so a move through the 92.17 high pushes momentum into overbought territory almost immediately. The 88.72 low did not violate any prior swing low of consequence, which is the technical reason to classify the session as a shakeout inside a trend rather than a change of character.
The 89.30 to 89.90 shelf and the 92.17 high frame Tuesday
Two structures frame the session. Beneath price, the 89.30 to 89.90 shelf is the reclaimed first pivot support and one standard deviation support pair that was broken and defended Friday, with the 88.72 session low the risk boundary and the 88.40 stop beneath it; the 90.79 session pivot is the nearer reference the recovery reclaimed and held late in the session. Overhead, 92.04 is the published target price, 92.17 the session high the recovery stopped at, 92.36 the level at which the 14-day relative strength index reaches 70, and 92.86 the first pivot resistance with genuine mechanical weight, above which the 93.14 yearly high stands as the structural line of the advance. Tuesday is a positioning session rather than a resolution one. There is no first-order energy event on the calendar, no inventory release and no producer-group meeting, with the delayed weekly crude inventory release displaced to Thursday September 10 at 12:00 PM ET. Monday September 7 is the United States Labor Day holiday, so Tuesday is reached through a three-day break, and last week's 1.29 dollar Sunday gap on a two-day weekend is a reasonable lower-bound reference for the gap that could develop. Crude has no liquid options proxy, so positioning is read from the commitments data, the refined product cracks and the futures technical structure.
Buy the retest, respect 88.40, size for the holiday gap
The plan buys the 89.30 to 89.90 shelf on a retest, favouring the zone that was defended over a chase into the settlement, and produces materially better geometry than buying the close. The stop is 88.40, beneath the 88.72 session low with a 32 cent buffer, placing risk beneath the level whose loss invalidates the constructive reading, a total risk of 1.20 dollars from the 89.60 entry midpoint, which is 0.36 of a 14-day average true range. Targets step to 90.79, the session pivot and first mechanical resistance, then 92.17, the session high the recovery stopped at, then 93.14, the contract yearly high only if momentum extends through target two on expanding volume, for reward-to-risk of roughly 1 to 1.0, 1 to 2.1 and 1 to 3.0 from the entry midpoint. The defining risk is two-sided and macro. A weekend headline confirming durable de-escalation around the Strait of Hormuz, or meaningful progress on the Russia proposal, would remove conflict premium faster than any technical level can absorb and invalidates the setup on the reopen regardless of price. In the opposite direction, a strike on a named target or any interruption to Strait traffic would gap the contract through the entry zone and through the yearly high, in which case the setup is void because the entry was never available and should not be chased. A further unchanged or reduced official selling price from the largest producer would independently undercut the demand assumption behind the long. A decisive close beneath 88.40, and more definitively any acceptance beneath the 87.34 to 87.37 confluence, negates the long thesis and opens the 85.48 to 85.96 band. Position sizing sits at one half to two-thirds of an equity-index equivalent given a 3.68 percent average true range as a share of spot, and the three-day holiday break argues for the lower end of that band. Our published performance methodology sets out how these calls are graded.
The market broke first pivot support to 88.72 and reclaimed the entire decline to settle at 80.0 percent of the range inside a weekly candle that gained 9.69 percent, a shakeout inside an intact uptrend rather than a reversal. That argues for buying a retest of the reclaimed 89.30 to 89.90 shelf rather than chasing the settlement, sized for a two-sided Strait of Hormuz catalyst and a three-day holiday gap, and a durable de-escalation is the one development that flips the read.
A supply-tight market that holds above every moving average but was rejected inside its own first support test is a market to buy on a retest rather than a print to chase. The plan favours the 89.30 to 89.90 shelf, respects 88.40 and keeps size measured, because the constraint can escalate or resolve on a single weekend headline in either direction, with no first-order energy event on Tuesday's calendar to resolve it.
This is the read our members get every session, before the bell, with the levels drawn and the setup defined. See how the same dealer-positioning work turns into systematic signals.
View pricingThe complete data picture
Every number behind Tuesday’s plan, charted first; the full numeric reference follows underneath.
Full numeric reference, every remaining figure from the review
| Average | Value | Settle vs |
|---|---|---|
| 5-day | 89.95 | above by 1.53 |
| 9-day | 87.37 | above by 4.11 |
| 20-day | 84.98 | above by 6.50 |
| 40-day | 82.39 | above by 9.09 |
| 50-day | 79.78 | above by 11.70 |
| 100-day | 80.79 | above by 10.69 |
| 200-day | 72.71 | above by 18.77 |
| Level | Reference |
|---|---|
| 95.63 to 96.31 | the three standard deviation resistance and third pivot resistance, the extended blow-off band that would require a supply shock to reach |
| 94.24 to 94.86 | the second pivot resistance paired with the two standard deviation band, the zone where a genuine breakout would meet supply |
| 93.87 | the one standard deviation resistance, the first objective beyond the contract high and a first stop for a breakout extension |
| 93.14 | the October contract yearly high posted September 3, target three, the single most consequential number on the upside |
| 92.86 | the first pivot resistance, the first level with genuine mechanical weight above the market |
| 92.36 | where the 14-day relative strength index reaches 70, so clearing the session high pushes momentum into overbought territory in the same motion |
| 92.17 | the session high, target two, the level the recovery stopped at and the minimum reclaim to treat the gap as continuation |
| 92.04 | the published target price, the first mechanical objective above the settlement |
| 90.79 | the session pivot, target one, reclaimed during the recovery and held late in the session, the first line of defence |
| 90.44 | where the 14 and 3 day raw stochastic reads 80, a minor shelf just beneath the pivot |
| 89.30 to 89.90 | the primary buy band and entry, a retest of the reclaimed first pivot support and one standard deviation support pair |
| 89.09 to 89.41 | the one standard deviation support and first pivot support, the upper edge of the zone broken and then reclaimed |
| 88.72 | the session low, the most important support, where sellers were rejected and the risk boundary for the long |
| 88.40 | the protective stop beneath the session low with a 32 cent buffer, total risk 1.20 from the entry midpoint |
| 87.34 to 87.37 | the second pivot support paired with the 9-day moving average, an unusually tight confluence forming the next base beneath the low |
| 85.48 to 85.96 | the third pivot support, the 18-day moving average and the 38.2 percent retracement, a band that would represent a genuine trend correction |
| Metric | Reading |
|---|---|
| Options surface | no liquid crude options proxy, so positioning is read from the physical and futures complex, and no level in this review is derived from an options surface |
| Forward curve | curve shape could not be read directly in this run, the indirect proxy evidence is genuinely mixed, and no claim about contango or backwardation is made |
| Refining margins | the gasoline crack computes to about 43.53 dollars a barrel and the distillate crack to about 99.21, both extraordinary and describing severe refined-product scarcity rather than a normal refining market |
| Brent to WTI | the waterborne benchmark settled 96.28 against WTI 91.48, a 4.80 premium, waterborne outperforming landlocked as expected when the supply concern is around a maritime chokepoint |
| Historic volatility | 31.36 percent over 14 days and 33.20 percent over nine, both well beneath the 43.84 percent 50-day figure, so realised movement has been contracting even as price advanced |
| Product prices | the October gasoline settlement at 3.2146 a gallon up 2.54 percent, diesel at 4.5402 down 1.16 percent and natural gas at 2.9750 up 2.13 percent |
| Producer positioning | producers net long 309,402 and swap dealers net short 465,407 as of September 1, with open interest at 242,025 against session volume of 248,338 |
| Weekly turnover | volume of 248,338 contracts against a 20-day average of 226,559 confirms genuine participation, and open interest of 242,025 shows positions were defended and rebuilt rather than liquidated |
| Cohort | Weekly change |
|---|---|
| Technical positioning | the multi-indicator composite reads 88 percent buy overall, 12 of 13 component signals positive with only the 50 against 100 day crossover negative, short-term and medium-term components both at 100 percent buy and long-term at 33 percent, price above all eight surveyed moving averages |
| Directional spread | the 14-day directional index at 20.60 with the positive directional indicator 30.38 against 15.74 negative, a 14.64 spread, and the 9-day risen to 28.76, a rising short-lookback reading that marks a trend gaining organisation |
| Managed money | a net long of 94,281 as of the week ended September 1, an increase of 10,261 on the week, 205,300 long against 111,019 short, speculative length added into strength before the final leg of the advance |
| Producer hedging | producers net long 309,402 with 645,739 long against 336,337 short, and swap dealers net short 465,407, while commercials held a net short of 156,005 essentially unchanged on the week |
| Positioning staleness | the report is current only to September 1, predating a week in which the contract advanced 9.69 percent and posted a new contract high, so it describes a starting condition rather than current positioning |
| Coverage note | crude carries no liquid options-positioning proxy, so positioning is built from the weekly commitments data, the refined product cracks and the futures technical structure |
| Input | |
|---|---|
| Dollar index | 99.159, firmer by 0.16 percent, so crude advancing against a firmer dollar is a mild positive for the oil trade in isolation and indicates the bid was not a currency effect |
| 10-year yield | 4.784 percent, rising, in a session the cross-asset picture read as rates-driven rather than commodity-driven |
| Gold and silver | gold down 1.39 percent to 4,476.6 and silver down 1.41 percent, a notable divergence from crude consistent with a rates-driven session |
| Equity index | the S&P 500 cash index closed 7,718.60, lower by 0.38 percent, with the equity-index future at 7,722.00 down 0.42 percent and the Nasdaq future the outlier at 29,565.25 up 0.14 percent, volatility firming to 14.52 |
| Natural gas | settled 2.9750 per million British thermal units, higher by 2.13 percent |
| Global benchmark grade | the waterborne benchmark settled 96.28, higher by 76 cents or 0.8 percent, outperforming WTI and leaving the premium to WTI at 4.80, the expected pattern when the supply concern is a maritime chokepoint |
| Product complex | gasoline settled 3.2146 a gallon up 2.54 percent and diesel 4.5402 down 1.16 percent, the gasoline crack computing to about 43.53 dollars a barrel and the distillate crack to about 99.21, extraordinary figures describing refined-product scarcity |
| Energy equities | the energy equity sector proxy closed 64.06, lower by 0.87 percent on a day crude settled higher, a divergence that cautions against treating the close as a clean bullish signal |
| When | Event |
|---|---|
| Thu Sep 4 | the October contract broke first pivot support to a 88.72 low on an unchanged Saudi official selling price to Asia, then recovered the entire decline to settle 91.48, an 80.0 percent close after a 9.69 percent week |
| Mon Sep 7 | the United States Labor Day holiday, no pit session, with the electronic market on a reduced holiday schedule before normal conditions resume Tuesday |
| Tue Sep 8 | a positioning session with no first-order energy event, German trade data at 2:00 AM ET, the three-year United States note auction at 1:00 PM ET and Chinese inflation at 9:30 PM ET the nearest demand-relevant print |
| Wed Sep 9 | the monthly short-term energy outlook at 12:00 PM ET, tentatively scheduled, the first energy-specific set piece of the week |
| Sep 10 to Sep 11 | the producer-group monthly report and delayed weekly crude inventory release Thursday September 10, then the international energy agency report and United States consumer prices Friday September 11 |
The economic releases referenced above are published on the official government calendars below. Price levels are derived from standard technical and statistical methods, and the market read is AlgoIndex's own analysis. How we grade these calls is set out in our performance methodology.
- US Bureau of Economic Analysis, Personal Income and Outlays (PCE)
- US Bureau of Economic Analysis, Gross Domestic Product
- US Bureau of Economic Analysis, release schedule
- US Census Bureau, Advance Durable Goods (M3) release schedule
- US Energy Information Administration, Weekly Petroleum Status Report
- US Department of the Treasury, auction schedule and results
- AlgoIndex performance methodology



