
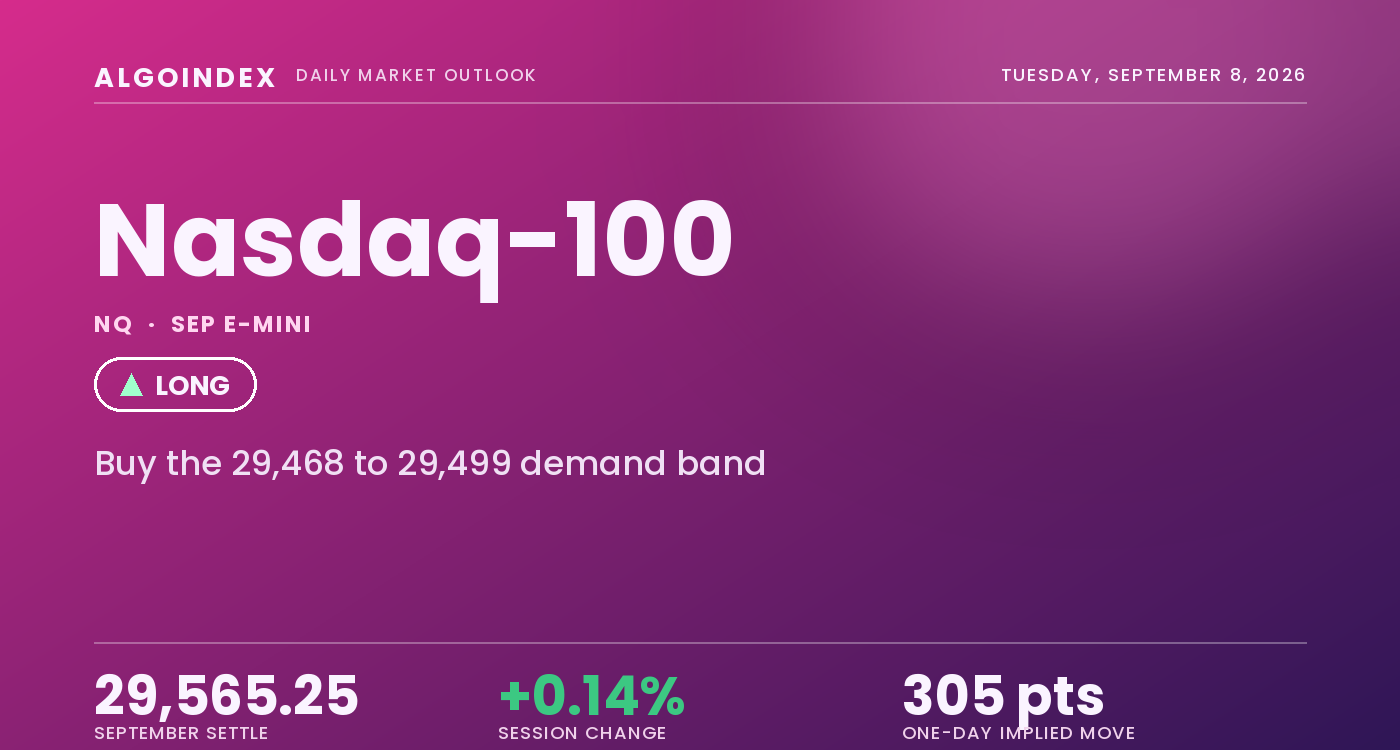
The September Nasdaq-100 settled Friday at 29,565.25, up 40.50 points or 0.14 percent, on a 236.50-point range between 29,468.00 and 29,704.50, a different print from the last electronic trade of 29,523.00. The cash Nasdaq-100 index closed at 29,544.16, up 0.21 percent, placing the measured futures basis at plus 21.09 points, the conversion used throughout this review. Volume ran 463,303 contracts against open interest of 294,107. What makes the session worth studying is that the Nasdaq rose while the broad market fell: the S&P 500 closed down 0.38 percent, the Dow down 0.51 percent and the S&P futures contract down 0.42 percent, yet the Nasdaq contract finished green. The reason was narrow and specific, semiconductors advancing roughly 4 percent as a sector while the mega-cap complex fell about 1 percent and software fell about 2 percent, a semiconductor story rather than a broad tech story.
The session was defined by one release. August nonfarm payrolls printed 162,000 against a 55,000 consensus, roughly 2.9 times expectations, and the prior month was revised from a reported decline of 23,000 to a gain of 21,000, with average hourly earnings up 0.3 percent on the month and the unemployment rate held at 4.1 percent. Nothing in that combination argues for policy easing, and market-implied odds of a rate increase at the September 16 meeting moved to between 58 and 60 percent from roughly 52 percent beforehand. The structural contradiction into Tuesday is straightforward: price sits above every moving average, the multi-indicator composite reads 80 percent buy and Nasdaq flow expresses upside, yet trend strength is absent, the settlement closed 14.00 points below the computed pivot and only 5.06 points above the 20-day average, dealer gamma is negative, and a three-day weekend separates this settlement from the next cash open. The setup that follows buys the retest of the 29,468 to 29,499 support confluence rather than chasing the current price, at reduced size.
Above every average, on a knife-edge with the 20-day
The structural read starts with location, and it is constructive with one qualification. At 29,565.25 the contract sits above its 5-day average at 29,382.95 by 182.30 points, its 20-day at 29,560.19 by 5.06 points, its 50-day at 29,369.90 by 195.35 points, its 100-day at 29,276.09 by 289.16 points and its 200-day at 27,434.87 by 2,130.38 points, above the year-to-date average at 27,678.90 as well. Price is above every average in the stack, the clearest bullish fact available, but the distribution matters more than the count: the distance to the 200-day is enormous and the distance to the 20-day is nil. That shape describes a long-running advance that has flattened at the short end, exactly what the period returns show, up 14.19 percent year to date and up 16.90 percent over 200 days but down 0.90 percent over 20 days and down 0.54 percent over 50 days. The 20-day interaction is the single most important structural fact on the daily chart, a gap of 5.06 points or 0.017 percent that the first hour of Tuesday trade can flip without any change in the underlying environment.
Momentum is neutral without being stretched, which is itself the finding. Relative strength reads 54.16 on the 9-day window, 52.47 on the 14-day after gaining 0.60 on the session and 51.78 on the 20-day, every reading within a few points of the midline. Stochastics are mixed by lookback, and that is informative: the 9-day raw sits at 72.15 percent while the 14-day reads 53.43 percent and the 20-day 45.06 percent, the short window recovering from the September 2 low while the medium lookbacks still work lower, the oscillator signature of a bounce inside a downward drift rather than a resumed advance. Trend strength is absent across every window, the directional index reading 16.71 on the 9-day, 13.84 on the 14-day and 12.88 on the 20-day, all beneath the twenty threshold. Within that, the directional components have just crossed at the short end, positive direction at 23.54 against negative at 20.93 on the 9-day, while the medium windows have not turned. The multi-indicator composite reads 80 percent buy overall with a soft strength label, the directional signals constructive and the range and momentum signals neutral.
The 29,468 to 29,499 confluence anchors Tuesday
Two structures frame the session. Beneath the market, the band from 29,468 to 29,499 is the support confluence and the location of the entry, where the session low and the 38.2 percent retracement of the four-week advance coincide within a tenth of a point at 29,468 and the modeled gamma-flip level sits at the top near 29,499, below which the dealer-positioning environment turns amplifying. Beneath it, the 29,423.97 9-day average and the 29,416.31 relative-strength midline mark where a sustained trade removes the short-term momentum argument entirely. Overhead, the first task is a reclaim of the pivot shelf, where the computed pivot at 29,579.25 and the modeled volatility threshold near 29,581 identify the same level by two independent methods, and above it the primary gamma concentration near 29,663 and the 29,690 to 29,705 ceiling zone are what convert the shelf into a springboard. Tuesday carries no scheduled United States macro release before the cash open, so the open is decided by weekend positioning and pre-market semiconductor movement.
Buy the retest, scale at the pivot, size it down
The plan buys a retest of the 29,468 to 29,499 support confluence, where the session low, the 38.2 percent retracement of the four-week advance and the modeled gamma-flip level converge, leaning on a settle that holds above every moving average with the multi-indicator composite at 80 percent buy and Nasdaq-specific options flow expressing upside rather than hedging demand. The stop is 29,415, beneath the 9-day average at 29,423.97 and the relative-strength midline level at 29,416.31, roughly 68.50 points from the 29,483.50 entry midpoint. Targets run to 29,579 at the computed pivot in confluence with the modeled volatility threshold near 29,581, then 29,676 at the midpoint of the primary gamma concentration near 29,663 and the first pivot resistance at 29,690.50, then an extended 29,787 at the upper volatility reference below the 38.2 percent retracement of the four-week decline at 29,802.18, valid only if momentum extends through the second target on expanding volume, for approximately 1 to 1.4, 1 to 2.8 and 1 to 4.4. A sustained trade below 29,415, and in particular an hourly close below it, negates the thesis and, with dealer gamma negative below the modeled flip level near 29,499, the decline would be amplified rather than dampened, with next objectives at 29,342.75, then the 40-day average at 29,247.55 and the third pivot support at 29,217.50. Three conditions void the setup in real time: a weak three-year note auction at 1:00 PM ET that pushes the front end higher, a failure of the semiconductor complex to confirm at the open, and any weekend escalation in the Iran or Russia theatres. Reduced size is appropriate, since Tuesday is a positioning session in front of the European Central Bank decision and producer prices on Thursday, consumer prices on Friday, the policy meeting on September 16 and the quarterly expiration on September 18, with roughly 35 percent of total United States options exposure expiring across that window. Our published record lays out how we grade these calls.
A settle above every moving average with the composite at 80 percent buy and Nasdaq flow expressing upside, yet trend strength absent, the settlement 14.00 points below the computed pivot and only 5.06 points above the 20-day, and dealer gamma negative below the modeled flip level near 29,499. The 29,468 to 29,499 support confluence is the referee: a retest that holds it works toward the 29,579 pivot shelf and the 29,663 gamma concentration, while a sustained break of 29,415 opens the 29,342 to 29,217 support.
A market above its stack but pinned to the 20-day is a retest to buy at the 29,468 to 29,499 support confluence, not a settlement to chase. The edge is a hold of that band above the 29,415 stop, and the invalidation is a sustained hourly close below it into a negative-gamma environment.
This is the read our members get every session, before the bell, with the levels drawn and the setup defined. See how the same dealer-positioning work turns into systematic signals.
View pricingThe complete data picture
Every number behind Tuesday’s plan, charted first; the full numeric reference follows underneath.
Full numeric reference, every remaining figure from the review
| Average | Value | Settle vs |
|---|---|---|
| 5-day | 29,382.95 | settle above by 182.30, 0.62 percent |
| 20-day | 29,560.19 | settle above by 5.06, 0.017 percent, a knife-edge the first hour of Tuesday trade decides |
| 50-day | 29,369.90 | settle above by 195.35, 0.66 percent |
| 100-day | 29,276.09 | settle above by 289.16, 0.98 percent |
| 200-day | 27,434.87 | settle above by 2,130.38, 7.21 percent, the widest gap in the stack |
| Year-to-date | 27,678.90 | settle above by 1,886.35, 6.38 percent |
| Level | Reference |
|---|---|
| 31,100.00 | 52-week high set June 3, 4.93 percent above the settlement, a structural rather than tactical reference |
| 30,975.50 | 13-week high set June 16, the structural repair level 4.77 percent above the settlement |
| 30,343.00 | one-month high set August 17, the origin of the current lower-high sequence, 2.63 percent above the settlement |
| 29,927.00 | third pivot resistance, paired with the third standard-deviation band at 29,927.77, the practical ceiling for a single strong session |
| 29,861.24 | second standard-deviation band, above the 18-day stall level at 29,853.25 |
| 29,815.75 | second pivot resistance, the upper edge of the 29,787 to 29,816 objective grouping |
| 29,802.18 | 38.2 percent retracement of the four-week decline, just above the upper volatility reference |
| 29,787.00 | upper volatility reference converted from the tracking-fund dataset, the extended third target |
| 29,704.50 | session high, the top of the 29,690 to 29,705 ceiling zone |
| 29,690.50 | first pivot resistance, the lower edge of the ceiling zone and part of the second target band |
| 29,676.00 | midpoint of the primary gamma concentration and the first pivot resistance, target two |
| 29,663.00 | primary gamma concentration on a listed fund strike, a magnet on quiet sessions |
| 29,581.00 | modeled volatility threshold converted from the fund dataset, within two points of the computed pivot |
| 29,579.25 | computed pivot, target one, only 14.00 points above the settlement and reproduced from this session |
| 29,565.25 | September settle, the reference point for the session |
| 29,560.19 | 20-day moving average, 5.06 points below the settle, the immediate knife-edge support |
| 29,533.83 | 38.2 percent retracement of the 13-week decline, inside the immediate support band |
| 29,528.68 | 18-day average crossing level, reinforcing the 29,523 to 29,534 shelf |
| 29,524.75 | prior close, the upper edge of the last-traded band |
| 29,523.00 | the last electronic print, where both the four-hour and hourly bars closed |
| 29,499.00 | modeled gamma-flip level converted from the fund dataset, the buy-zone top, below which hedging amplifies |
| 29,468.07 | 38.2 percent retracement of the four-week advance, coincident with the session low |
| 29,468.00 | session low and buy-zone base |
| 29,454.00 | first pivot support, the lower edge of the standard pivot band |
| 29,423.97 | 9-day average, part of the stop reference pair |
| 29,416.31 | level at which the 14-day relative-strength measure reads 50, the second half of the stop reference |
| 29,415.00 | protective stop, beneath the 9-day average and the relative-strength midline pair |
| 29,382.95 | 5-day moving average, 182.30 points below the settle |
| 29,369.90 | 50-day moving average, 195.35 points below the settle |
| 29,355.95 | first standard-deviation support, paired with the second pivot support |
| 29,342.75 | second pivot support, the first genuinely deeper objective on a pivot-band failure |
| 29,276.09 | 100-day moving average, 289.16 points below the settle |
| 29,269.26 | second standard-deviation support, inside the deeper support zone |
| 29,247.55 | 40-day average, aligned with the third pivot support zone |
| 29,217.50 | third pivot support, where price would sit below its 20-day and 50-day averages |
| 29,088.50 | 50 percent retracement of the 13-week decline |
| 28,927.25 | one-month low set September 2, 2.16 percent below the settle, whose failure would end the recovery |
| 27,678.90 | year-to-date average, 1,886.35 points beneath the settle |
| 27,434.87 | 200-day moving average, 2,130.38 points beneath the settle, the widest gap in the stack |
| Metric | Reading |
|---|---|
| Fund and futures surface | fund one-month implied volatility 17.21 percent against 13.51 percent realized, a 3.70-point premium and a 1.27 ratio, with an implied volatility rank of 15.74 percent, a 25.32 percent volatility-forecast rank and a 78.74 percent skew rank; the September futures surface carries 16.37 percent implied volatility with thirteen days to the September 17 expiration |
| Implied one-day move | about 305 points, 1.03 percent, roughly 75.8 percent of the 402.43-point 14-day average daily range, with the fund surface implying a comparable 1.087 percent or about 321 points at 7.80 dollars |
| Dealer gamma, fund | gamma notional negative 115.384 million with a 0.896 tilt below the neutral 1.0, call gamma negative 250.03 million against put gamma negative 2.35 billion, so put gamma is 9.4 times the call gamma, positioned to amplify declines more than advances |
| Options volume skew | fund puts 1.35 million against calls 1.01 million, a put-to-call open-interest ratio of 1.34 with put open interest of 7.292 million against call open interest of 5.374 million |
| Gamma references, futures domain | modeled gamma-flip level near 29,499 only 66 points below the settle, modeled volatility threshold near 29,581, primary gamma concentration near 29,663, upper volatility reference near 29,787, call-side hedging boundary near 29,869 and put-side hedging boundary near 28,840 |
| Flow composition | Nasdaq flow about positive 4 billion delta from same-day put selling and longer-dated call buying, against broad-index flow about negative 9 billion dominated by put buying with roughly 75 percent in same-day expirations, a rotation signature rather than accumulation |
| Expiry and basis | top gamma expiration September 17 and top delta expiration June 2027, roughly 35 percent of total United States options exposure expiring by the September 18 quarterly, with the September futures at a 21.09-point premium to the cash index on the measured basis |
| Cohort | Weekly change |
|---|---|
| Dealers and intermediaries | 58,239 long against 137,013 short as of September 1, a net short of 78,774 with 14,510 shorts added and 1,016 longs cut |
| Commercial participants | 155,766 long against 201,186 short, a net short of 45,420 with 8,002 shorts added and 282 longs cut |
| Non-commercial participants | 89,434 long against 63,544 short, a net long of 25,890 after cutting 15,049 shorts and adding 802 longs |
| Leveraged funds | 55,361 long against 69,453 short, a net short of 14,092 after cutting 23,620 shorts, the short book shrinking roughly a quarter in a week |
| Asset managers | 108,397 long against 36,520 short, a net long of 71,877, roughly unchanged |
| Broad-index context | speculative accounts added 4,587 to a net short of 307,558 while fund managers cut a net long by 19,361 to 927,454, a modest broad-market de-risking |
| Input | |
|---|---|
| Federal Reserve policy | August payrolls printed 162,000 against a 55,000 consensus, roughly 2.9 times expectations, the prior month revised from minus 23,000 to plus 21,000, average hourly earnings up 0.3 percent on the month against 0.1 percent and the workweek extended to 34.4 hours, the unemployment rate held at 4.1 percent, moving September 16 increase odds to between 58 and 60 percent from about 52 percent |
| Rates and inflation | the personal consumption price index read 3.7 percent on the year in the August 26 release against a 3.6 percent forecast and a 3.7 percent prior, so the annual rate has stopped falling, and short-dated bonds fell alongside the broad equity index as tightening expectations repriced |
| Semiconductor leadership | semiconductors advanced roughly 4 percent as a sector while software fell about 2 percent and the mega-cap complex fell about 1 percent, led by equipment and memory, a chip-equipment name up 4.31 percent, a lithography name up 4.17 percent, a memory name up 11.90 percent and a large memory manufacturer up 6 percent, an early-cycle rotation signature |
| Mega-cap and AI capex | the largest hardware name fell 2.51 percent and a large financial-software name fell 3.37 percent, while administration comments framed artificial-intelligence infrastructure as a strategic priority and a contest with China; after the close, officials indicated no artificial-intelligence talks with China are planned for mid-September, a 4:19 PM ET headline the cash market has not priced |
| Cross-asset and volatility | broad-market implied volatility closed at 14.52, up 1.5 percent, with the volatility-of-volatility measure at 84.42; the fund one-month implied volatility of 17.21 percent stands 2.69 points above the broad-market level, a normal-to-modest margin, and next-session at-the-money implied volatility sits near 5.9 percent annualized |
| Geopolitical | administration remarks described Iran as effectively controlled with the Strait of Hormuz not mined and oil flowing, carrying an explicit escalation clause, while Russia and Ukraine signals were mixed and trade-policy remarks raised tariff threats, three theatres carrying headline risk across a three-day weekend |
| When | Event |
|---|---|
| Fri Sep 4 | the reviewed session, a 0.14 percent advance to 29,565.25 on hot August payrolls, the Nasdaq finishing green while the broad market fell on a semiconductor-led move |
| Mon Sep 7 | the United States cash market closed for Labor Day, extending the weekend to three non-trading days ahead of the Tuesday reopen |
| Tue Sep 8 | the outlook session, a low-catalyst day whose single first-order scheduled event is the 1:00 PM ET three-year note auction, with an all-day artificial-intelligence summit the first-order unscheduled risk |
| Wed to Fri | a tentative hardware product event and a ten-year note auction September 9, then the heaviest day September 10 with the European Central Bank decision, United States producer prices and a thirty-year auction, and consumer prices September 11 |
| Sep 16 to 18 | the policy statement and projections September 16, the largest gamma expiration September 17 and the quarterly expiration September 18, also the September futures expiration |
The economic releases referenced above are published on the official government calendars below. Price levels are derived from standard technical and statistical methods, and the market read is AlgoIndex's own analysis. How we grade these calls is set out in our performance methodology.
- US Bureau of Economic Analysis, Personal Income and Outlays (PCE)
- US Bureau of Economic Analysis, Gross Domestic Product
- US Bureau of Economic Analysis, release schedule
- US Census Bureau, Advance Durable Goods (M3) release schedule
- US Energy Information Administration, Weekly Petroleum Status Report
- US Department of the Treasury, auction schedule and results
- AlgoIndex performance methodology



