
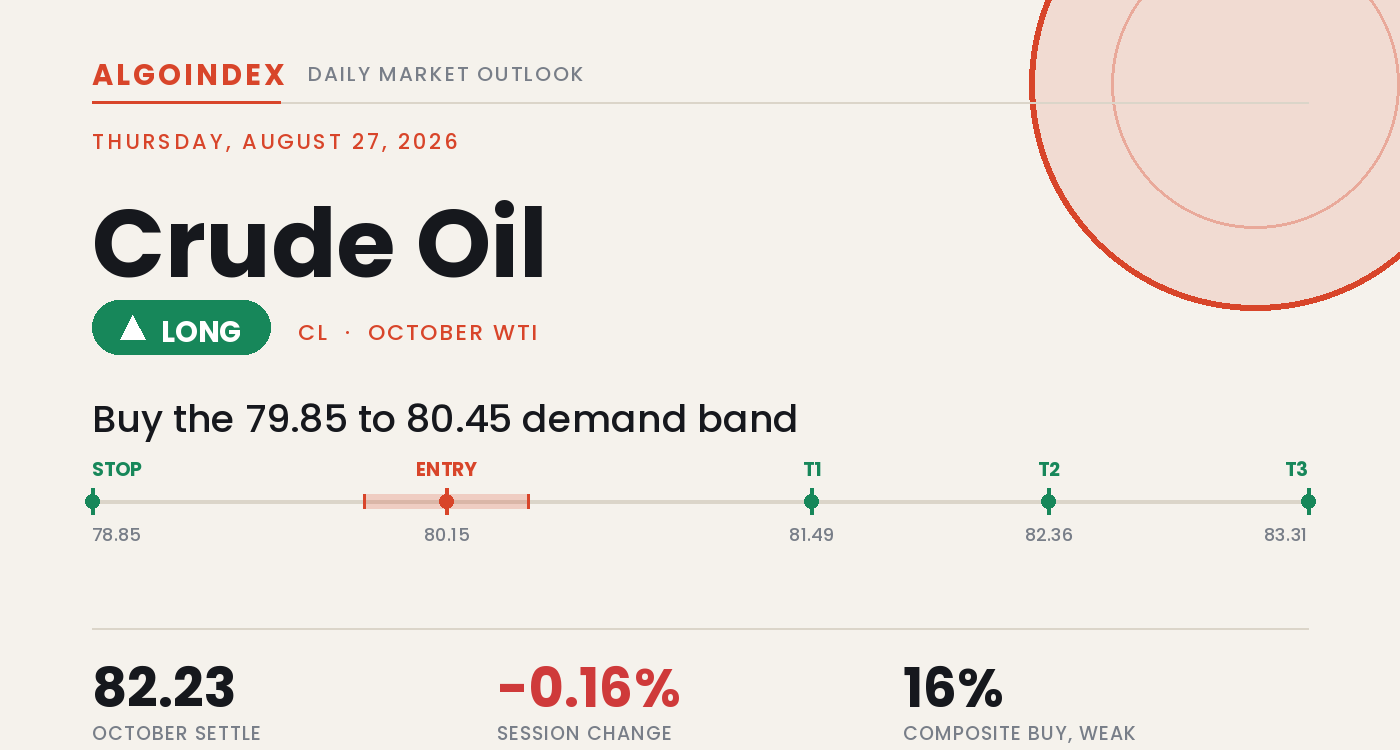
Crude oil printed one of the month's wider two-way sessions on Wednesday and then closed almost exactly where it began. The October contract settled at 82.23, down 0.13 or 0.16 percent, a figure that conceals the day entirely. Price gapped lower to 81.11 against Tuesday's 82.36 settle, extended to a 79.62 low, then reversed 2.61 dollars into the close. The full span ran 79.62 to 83.31, some 3.69 dollars, 4.49 percent of the settle and 1.12 times the 14-day average true range. That is not drift. It came on 234,933 contracts against 270,986 open interest, active two-way trade rather than a thin fade. The near-flat settle is the least informative number the session produced, and the post-settlement electronic print near 81.86 left the last hour leaning weaker than the printed close.
The driver was diplomatic, not physical. Press reports carried an initiative between Iranian and Omani officials to open a temporary maritime corridor through the Strait of Hormuz, with talks flagged toward a permanent route inside a 30 to 60 day window, and that headline drove crude to its lowest level in roughly a week and a half. The recovery came from supply: the weekly inventory release at 10:30 AM ET showed a 0.095 million barrel build against a 1.58 million forecast, far tighter than expected. The contradiction is clean. The physical complex still prices a disrupted waterway, a Brent to WTI differential of 5.61 dollars and product cracks far above any normal band, while the news flow is pricing that disruption out. Two escalation headlines crossed after the settle and skew overnight gap risk to the upside.
A near-flat close over a wide reversal
The constructive read starts at the low. Wednesday's 79.62 print coincided with the first pivot support at 79.78 and the one-standard-deviation support at 79.91, absorbed the heaviest volume of the last four sessions, and produced a 2.61 dollar reversal into the settle. That is demonstrated demand rather than a theoretical level. Price also holds above every moving average from the 20-day at 81.22 outward, with the 50-day at 77.57, the 100-day at 80.04 and the 200-day at 71.71 all beneath the market. The settlement finished in the upper third of the span at a 70.73 percent closing range, and the recovery more than repaired the opening gap even as the close-to-close change stayed marginally negative.
What argues the other way is momentum, and it is mixed rather than one-sided. The directional index climbs as the window shortens, 15.12 on the 20-day where positive direction still leads, 18.43 on the 14-day where the two sides are nearly tied beneath the 20 threshold, and 24.58 on the 9-day where negative direction leads. That progression, bearish up close and constructive further out, is the mark of a young pullback inside an older advance. The stochastic surface shows the fast line beneath the slow at every horizon, a bearish crossover that has not yet turned. Short-dated realised volatility is compressing, 30.58 percent on the 9-day against 44.77 percent on the 50-day, and the multi-indicator composite reads just 16 percent buy at minimum strength.
The 79.62 base against the 82.81 decision line
Two structures frame Thursday. Beneath price, the 79.62 to 79.91 base is where Wednesday's reversal originated, with the 81.19 to 81.49 band, holding the 20-day average, the 18-day cross and the midpoint strength level, the denser support that separates a pullback from a break. Overhead, 82.36 is the immediate ceiling and 82.81 the session decision level, with the 84.36 to 84.85 zone the wall that separates a bounce from a genuine repair. Thursday carries no first-order energy data, since the weekly inventory print already landed Wednesday, so the risk is unscheduled: a Qatari prime-ministerial visit to Tehran that can produce a corridor readout at any hour. Crude has no liquid options proxy, so positioning is read from the physical market, and both the 5.61 dollar Brent to WTI differential and the rich product cracks show the complex has not yet accepted the reopening that flat price spent the week discounting.
Buy the base, respect 78.85, size for range
The plan buys the 79.85 to 80.45 band, the confluence built by Wednesday's 79.62 low, the 79.78 first pivot support and the 79.91 one-standard-deviation support, every one of which absorbed the heaviest volume of the last four sessions. The stop is 78.85, set beneath the 78.90 two-standard-deviation support and the 79.04 forty-day average cross, the pair that must hold for the pullback-within-uptrend reading to survive, about 1.30 dollars from the 80.15 entry midpoint. Targets step up to the 81.49 eighteen-day band, where the 20-day at 81.22 and the midpoint strength level reinforce, then the 82.36 Tuesday settle, then the 83.31 session high only if momentum carries through on real volume. Two live outs cut against it: a concrete Strait of Hormuz corridor announcement from the Tehran meeting removes the premium the structure rests on and invalidates the long at any level, while confirmation of the post-settlement security incidents would likely gap price above the band before it fills. A dollar index break above 100 on a hawkish policy comment would pressure the entry independently. Our published record lays out how we grade these calls.
The physical complex still prices a shut waterway while the headlines price it open, and the two cannot both hold. Wednesday's 2.61 dollar reversal off 79.62 gives the base demonstrated weight, so buying the 79.85 to 80.45 confluence, sized for a wide range, is the trade, and a concrete corridor deal from Tehran is the one thing that flips it.
A demonstrated reversal base beneath a still-intact uptrend is a buy on weakness, not a chase into the ceiling. Buy near 80.15, respect 78.85, and size for a 3 to 4 percent range, because the Tehran readout can land at any hour.
This is the read our members get every session, before the bell, with the levels drawn and the setup defined. See how the same dealer-positioning work turns into systematic signals.
View pricingThe complete data picture
Every number behind Thursday’s plan, charted first; the full numeric reference follows underneath.
Full numeric reference, every remaining figure from the review
| Average | Value | Settle vs |
|---|---|---|
| 5-day | 84.62 | below by 2.39 |
| 20-day | 81.22 | above by 1.01 |
| 50-day | 77.57 | above by 4.66 |
| 100-day | 80.04 | above by 2.19 |
| 200-day | 71.71 | above by 10.52 |
| Year-to-date | 74.81 | above by 7.42 |
| Level | Reference |
|---|---|
| 91.00 | third pivot resistance near the 91.27 fifty-two-week high, out of single-session reach |
| 87.69 to 88.42 | one-month and thirteen-week highs with the second pivot resistance, the decline origin and heaviest overhead volume |
| 85.39 to 86.60 | first pivot resistance and the two and three standard-deviation bands |
| 84.36 to 84.85 | the trend ceiling: nine-day cross, five-day average, one-SD resistance and upper stochastic, the line separating a bounce from a repair |
| 83.31 to 83.42 | session high and upper stochastic band, the practical ceiling of the current structure |
| 82.74 to 82.81 | pivot point and short average cross, the first barrier a recovery must reclaim |
| 82.36 | Tuesday settle, the immediate ceiling price failed to close above |
| 82.23 | October settle |
| 82.12 | four-week 38.2 percent retracement, the first support beneath the settle |
| 81.19 to 81.49 | the key support band: twenty-day average, eighteen-day cross, midpoint strength level and computed target, the pullback-versus-break line |
| 80.40 to 80.58 | four-week 50 percent retracement, volume shelf and mid stochastic band, first target off the base |
| 80.07 | 38.2 percent retracement of the thirteen-week high, last support before the base |
| 79.85 to 80.45 | primary buy band, the entry |
| 79.62 to 79.91 | the reversal base: session low, first pivot support and one-SD support, the heaviest four-session volume |
| 78.85 to 79.04 | the stop shelf: two-SD support and the forty-day average cross, the pair that must hold |
| 77.60 to 78.67 | deeper retracements and the three-SD support, the downside if the base fails |
| 73.10 | August 5 one-month low, recovery base |
| Metric | Reading |
|---|---|
| Options surface | no liquid crude options proxy; positioning read from the physical market |
| Brent-WTI differential | 5.61 dollars as Brent settled 87.84, down 74 cents or 0.84 percent at 02:51 PM ET, wide against the 3 to 4 dollar band that prevails when waterborne routes run normally |
| Gasoline crack | about 57.21 per barrel from September gasoline at 3.3201 a gallon, extraordinarily wide, computed and indicative |
| Diesel crack | about 96.69 per barrel from September diesel at 4.2600 a gallon, far above any normal-market band |
| Product settles | September gasoline 3.3201 and diesel 4.2600 a gallon at 02:31 PM ET, with October gasoline finishing up 1.05 percent even as crude fell |
| Natural gas | 2.8420 per million British thermal units, no cross-signal of note |
| Historic volatility | 30.58 percent over 9 days against 33.52 percent over 14, 38.77 percent over 20 and 44.77 percent over 50, short-dated realised compressing |
| Forward curve | front-to-second-month spread not captured this session, deliberately left unstated |
| Open interest versus volume | 270,986 open against 234,933 traded, active two-way participation |
| Cohort | Weekly change |
|---|---|
| Managed money | net long 87,479; 195,538 long vs 108,059 short, added 4,984 longs and covered 2,579 shorts, a net build of 7,563 into the high (data Aug 18, stale, predates the Aug 20 peak and the week's decline) |
| Non-commercials | net long 122,090; 320,159 long vs 198,069 short, shorts covering an outsized 17,581 contracts |
| Commercials | net short 153,087; 894,821 long vs 1,047,908 short, the net short expanded 23,450 on the week as shorts added 20,927 |
| Producers | added 19,134 shorts and trimmed 2,523 longs, hedging into strength at pace |
| Swap dealers | 468,604 net short, the largest single directional exposure |
| Input | |
|---|---|
| Dollar index | 99.158, up 0.26 percent, a modest headwind that firmed even as the inventory print argued the other way |
| 10-year yield | 4.660, higher on the session, describing a tightening-expectations backdrop |
| Volatility index | 15.22, down 1.55 percent, a subdued read |
| Gold | 4,653.3, down 0.88 percent, refusing a haven bid |
| Equity index futures | S&P down 0.03 percent and Nasdaq up 0.04 percent, effectively unchanged |
| Brent crude | 87.84, down 0.84 percent at 02:51 PM ET, the seaborne premium sold specifically, the differential at 5.61 |
| Crude inventories | a 0.095 million barrel build against a 1.58 million forecast, a materially tighter print that drove the intraday reversal |
| Inflation batch | the 08:30 AM ET data ran hot, the core price measure 3.6 percent against 3.4 expected and the GDP price index 6.4 against 6.2, keeping rate-hike expectations live |
| Five-year auction | cleared 4.393 percent on a 2.370 cover, both improved on the prior 4.408 percent and 2.280 |
| When | Event |
|---|---|
| Thu Aug 27 | no first-order energy event; jobless claims 208,000 8:30 AM ET, a Federal Reserve speaker 10:00 AM ET, seven-year auction 1:00 PM ET, the central banking symposium opens, and the unscheduled Qatari prime-ministerial visit to Tehran the real headline risk |
| Fri Aug 28 | a senior policy speech at the symposium 10:00 AM ET and the preliminary benchmark payrolls revision, forecast 157,000 against a prior minus 911,000, a substantial dollar risk into the weekend |
| Wed Sep 10 | the producer-group monthly market report, the next scheduled supply-policy set piece |
| Sep 9 to 11 | the short-term outlook, producer-group and international agency monthly reports in consecutive sessions, the next first-order energy confluence |
| Tue Sep 16 | the central-bank rate decision |
The economic releases referenced above are published on the official government calendars below. Price levels are derived from standard technical and statistical methods, and the market read is AlgoIndex's own analysis. How we grade these calls is set out in our performance methodology.
- US Bureau of Economic Analysis, Personal Income and Outlays (PCE)
- US Bureau of Economic Analysis, Gross Domestic Product
- US Bureau of Economic Analysis, release schedule
- US Census Bureau, Advance Durable Goods (M3) release schedule
- US Energy Information Administration, Weekly Petroleum Status Report
- US Department of the Treasury, auction schedule and results
- AlgoIndex performance methodology



