
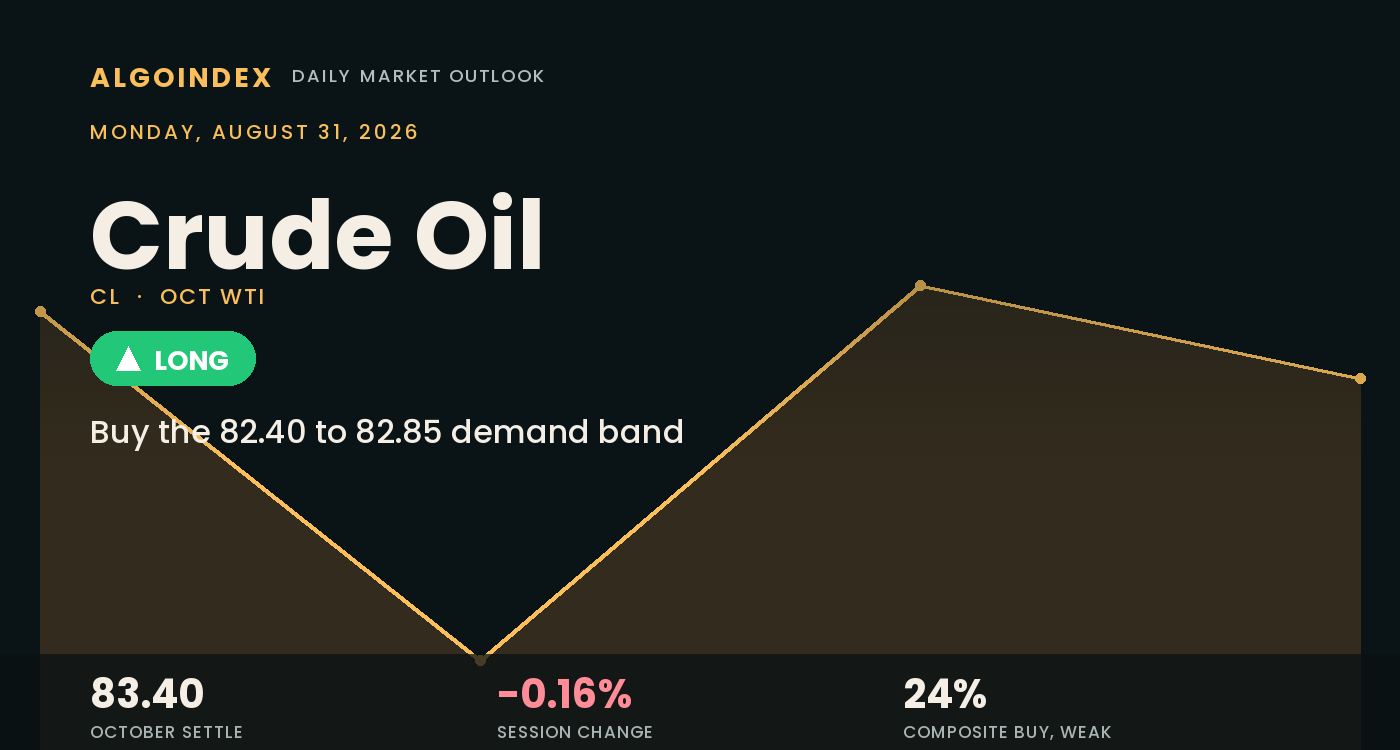
Crude compressed into the weekend and settled the October contract at 83.40 on Friday, lower by 0.13 or 0.16 percent, the tightest session of a violent week. The contract opened at 83.67, worked down to 82.25 through the middle of the session, recovered to a 83.78 high and closed at 75.2 percent of its range, the mark of buyers pressing into the settlement rather than a drift-up finish. The 1.53 dollar range covered only 48.1 percent of the 3.18 dollar fourteen-day average true range. The week itself ran from an 86.57 high on Monday to a 79.62 low on Wednesday before recovering 3.78 dollars to close at 54.4 percent of the weekly span, a mid-range finish after a large-range week. Participation drained as the week closed, Friday turning over 142,038 lots against a 193,379 twenty-day average, desks declining to carry directional exposure across a weekend that holds live headline risk.
The afternoon carried two contradictory tracks inside ninety minutes. Between 2:40 PM and 3:39 PM ET Iran's president described a Strait of Hormuz transit corridor agreed internally and named four conditions for reopening it, sanctions relief on fuel and petrochemicals, release of funds and resumption of investment. Then, after the 2:30 PM ET settlement was struck, the Revolutionary Guard stated at 4:29 PM and 4:30 PM ET that the strait is closed to vessels transiting without coordination with Iran. The post-settlement electronic print at 4:54 PM ET read 83.43, within four cents of the settlement, so the escalatory statements enter Sunday's 6:00 PM ET reopen effectively unpriced across two full days of weekend headline exposure. The macro backdrop pulled the other way. The central-bank chair pushed back on inflation progress at 10:00 AM ET, the dollar index closed at a two-week high of 99.677, and the 10-year yield rose to 4.718 percent, yet crude lost only sixteen basis points while gold fell 2.88 percent, a divergence that points to a supply-access premium doing the work rather than any improvement in demand.
A compressed mid-range close above every average
The constructive read starts with location. The 83.40 settlement sits above every major moving average, the five-day at 83.31, the twenty-day at 81.47, the fifty-day at 77.96, the one-hundred-day at 80.17 and the two-hundred-day at 71.94. On a one-month basis the contract is higher by 8.12 percent and year to date it trades 46.51 percent above where the year began, with the year-to-date average at 74.92. Friday's low of 82.25 traded through the 82.40 to 82.85 demand band, undercutting its lower edge by 0.15 while holding 0.35 above the working stop, then the session high tagged 83.78 exactly, the price flagged as the first upside objective in the prior plan. That is a clean defence of the band and it establishes the confluence as the operative demand zone rather than a coincidence of computed pivot arithmetic.
What argues the other way is that every trend measure says there is no trend to trade. The fourteen-day directional index reads 16.13, beneath the 20 line that separates trending from range conditions, with the positive and negative components at 22.08 and 21.32 only 0.76 apart. The twenty-day index is weaker still at 14.11, and on the nine-day the negative component leads, the only window where the short side has any edge. The multi-indicator composite reads 24 percent buy with weak signal strength, down from 80 percent a week ago. A further qualification sits inside the average stack, the fifty-day at 77.96 has crossed beneath the one-hundred-day at 80.17, an inversion that undercuts the quality of an otherwise constructive alignment. Realized volatility has compressed to 27.09 percent on the fourteen-day window against 43.85 percent on the fifty-day, the configuration that precedes either a range settlement or an outsized single-session expansion when a headline arrives.
The 82.82 pivot is the entire Monday decision
Two structures frame Monday. Beneath price, the 82.40 to 82.85 band pairs the 82.82 pivot point with the 82.70 computed target and the 82.41 one-standard-deviation support, and it earned its standing by absorbing a full test on Friday; beneath it the 81.95 to 82.12 confluence stacks the two-standard-deviation support, the eighteen-day average cross and the four-week retracement within seventeen cents, the level that separates a pullback from a break. Overhead, 83.78 is the immediate ceiling, and the 84.42 to 84.65 decision band, where the nine-day average cross, the 70 percent stochastic threshold and the one-standard-deviation resistance converge, is the wall between a bounce and a genuine repair. Monday carries no scheduled American release and no weekly inventory statistic, an unusually empty calendar that removes the mechanism by which a range normally breaks, so the 82.82 pivot becomes the whole decision and weekend headline flow supplies the direction. Crude has no liquid options proxy, so positioning is read from the physical complex, where a 5.91 dollar spread of the international waterborne benchmark to the domestic grade narrowed from 6.17 on Thursday, the supply-access premium easing at the margin even as the domestic contract held.
Buy the band, respect 81.90, size for the gap
The plan buys the 82.40 to 82.85 confluence, the band built by the 82.82 pivot point, the 82.41 one-standard-deviation support and the 82.25 fifty-percent stochastic threshold that also marks Friday's low, leaning on the demonstrated defence of that zone and a still-intact higher-timeframe uptrend. The stop is 81.90, set beneath the tightest three-reference support on the chart, the 81.95 two-standard-deviation support, the 81.99 eighteen-day average cross and the 82.12 four-week retracement, about 0.75 dollars from the 82.65 entry midpoint. Targets step up to 83.78, Friday's session high, then 84.65, the upper edge of the 84.42 to 84.65 decision band, then 84.98, the first pivot resistance and the approach to 85.00, only if acceptance builds through the decision band on expanding volume, for reward-to-risk of roughly 1 to 1.5, 1 to 2.7 and 1 to 3.1. Two developments override the level map. A confirmed announcement reopening the Strait of Hormuz transit corridor removes the supply-access premium and should be treated as an immediate exit regardless of price, with the 81.95 to 82.12 confluence the likely destination; a confirmed interdiction against vessel traffic is a physical supply event that would carry price through the entire resistance stack and turn the long into a runner rather than a level trade. With the escalatory 4:29 PM and 4:30 PM ET statements unpriced across a two-day weekend, half size suits any position carried through the Sunday reopen. The desk's published performance methodology sets out how these calls are graded.
The physical complex still prices a constrained waterway while the settlement barely moved, and the weekend arrives with the escalatory statements unpriced across two full days. Friday's defence of the 82.40 to 82.85 band against a 0.15 undercut gives the demand zone demonstrated weight, so buying that band, sized for the gap, is the trade, and a concrete corridor agreement from Tehran is the one development that flips it.
A compressed mid-range close above every average, with no trend on any measure and an empty Monday calendar, is a range to trade from the demand band rather than a print to chase. The plan favours the 82.40 to 82.85 band, respects 81.90 and keeps size light, because the weekend corridor readout can land at any hour across two days.
This is the read our members get every session, before the bell, with the levels drawn and the setup defined. See how the same dealer-positioning work turns into systematic signals.
View pricingThe complete data picture
Every number behind Monday’s plan, charted first; the full numeric reference follows underneath.
Full numeric reference, every remaining figure from the review
| Average | Value | Settle vs |
|---|---|---|
| 5-day | 83.31 | above by 0.09 |
| 20-day | 81.47 | above by 1.93 |
| 50-day | 77.96 | above by 5.44 |
| 100-day | 80.17 | above by 3.23 |
| 200-day | 71.94 | above by 11.46 |
| Year-to-date | 74.92 | above by 8.48 |
| Level | Reference |
|---|---|
| 88.07 to 91.27 | thirteen-week and fifty-two-week highs with the third pivot resistance at 88.60, out of single-session reach |
| 86.57 to 87.69 | the week high, the one-month high and the second pivot stall grouping, where a full weekly retracement meets mechanical resistance |
| 85.11 to 85.51 | the two and three standard-deviation bands and the 80 percent stochastic, the statistical outer edge of a normal session |
| 84.98 | first pivot resistance and the approach to the 85.00 round number |
| 84.42 to 84.65 | the decision band: nine-day cross, 70 percent stochastic and one-standard-deviation resistance, the line between a bounce and a repair |
| 83.78 | Friday session high, the immediate ceiling and target one |
| 83.40 | October settle |
| 82.82 to 83.31 | five-day average, pivot point and computed target, the immediate barrier a recovery must reclaim |
| 82.40 to 82.85 | primary buy band and demand confluence, the entry |
| 81.90 to 82.12 | the stop shelf: two-standard-deviation support, 18-day cross and four-week retracement, the tightest confluence on the chart |
| 81.36 to 81.59 | three-standard-deviation support, the 20-day average and first pivot support, the last defence of the recovery |
| 80.07 to 80.40 | the four-week and thirteen-week retracements and the 30 percent stochastic, the first waypoint lower |
| 79.62 to 79.78 | the week low and the forty-day cross, the base of the entire recovery |
| 77.74 to 79.20 | second and third pivot supports and the fifty-day average, the downside if the recovery fails |
| 73.10 | one-month low, out of single-session reach |
| Metric | Reading |
|---|---|
| Options surface | no liquid crude options proxy; positioning is read from the physical and futures complex rather than an equity-fund surface |
| Waterborne differential | the international benchmark settled 89.31, down 0.39 or 0.43 percent, leaving a 5.91 dollar spread to the 83.40 domestic settlement, narrowed from 6.17 on Thursday, the supply-access premium easing at the margin |
| Product settles | the September distillate contract settled 4.3567 a gallon and the September gasoline 3.4899, with the October gasoline contract up 2.00 percent while crude closed lower, product strength outpacing crude |
| Distillate crack | the September distillate against the October crude implies roughly 99.58 dollars a barrel, an exceptionally wide refining margin, though the unmatched contract months overstate the level and only the direction is reliable |
| Gasoline crack | not computed; the September and October gasoline contracts straddle the grade transition and only the September settlement was read, so a margin from those inputs would be a reconstruction |
| Natural gas | the October contract settled 2.8880 per million British thermal units |
| Listed volatility surface | the thirty-two-day curve is pronouncedly right-skewed, the body near 40 percent through strikes around price and above 120 percent into the far upside near 145, the options-market expression of supply-disruption risk |
| Implied against realized | an at-the-money implied near 40 percent against 14-day realized of 27.09 percent, a premium of roughly 13 volatility points, options rich to delivered movement |
| Historic volatility | 27.09 percent over 14 days against 38.56 percent over 20 and 43.85 percent over 50, short-dated realized compressing to two-thirds of the longer windows |
| Forward curve | front-to-back spread not carried this session |
| Open interest versus volume | 270,038 open against Friday volume of 142,038, 73.5 percent of the 20-day average, no roll pressure with 25 days to expiration |
| Cohort | Weekly change |
|---|---|
| Managed money | net long 84,020, reduced by 3,459 through 4,803 new shorts rather than long liquidation, fresh bearish initiation |
| Commercial hedgers | net short 156,246, deepened by 3,159, producers selling forward into strength |
| Non-commercial | net long 123,449, up 1,359, broad speculative length marginally higher |
| Swap dealers | net short 461,500, reduced by 7,104, the largest single adjustment in the table |
| Other reportables | net long 39,429, up 4,818 |
| Coverage note | the snapshot is dated to Tuesday August 25 and predates the Wednesday session that set the 79.62 week low, so it carries less weight than usual |
| Input | |
|---|---|
| Dollar index | 99.677, up 0.548 or 0.55 percent, a two-week high, the central-bank chair pushing back on inflation progress at 10:00 AM ET and rate futures moving from one 2026 hike to two by 12:25 PM ET |
| 10-year yield | 4.718 percent, up 0.049 or 1.05 percent, the short end leading |
| Gold | 4,529.9, down 134.1 or 2.88 percent, the metal taking the hawkish repricing while crude barely moved, a supply-access signal rather than systemic fear |
| Equity index | the broad index future 7,722.00 down 0.26 percent and the technology future 29,491.75 down 0.69 percent, mildly lower and orderly |
| Equity volatility | 14.42, down 0.55 percent, a low absolute level signalling no systemic stress |
| Chicago activity survey | 47.1 against a 57.9 consensus and a 57.6 prior, a collapse of more than ten points into contraction |
| Benchmark payrolls revision | minus 79,000 against a consensus of plus 183,000, a demand-negative surprise |
| Consumer sentiment | 51.7 final with one-year inflation expectations at 4.0 percent, beneath the 4.4 percent consensus |
| When | Event |
|---|---|
| Sun Aug 30 | the week reopens at 6:00 PM ET; Japanese output and retail sales at 7:50 PM ET and the official Chinese manufacturing survey at 9:30 PM ET, consensus 49.5 against a 49.2 prior, the single first-order demand input for crude |
| Mon Aug 31 | German preliminary inflation at 8:00 AM ET, national headline 3.0 percent against a 2.80 percent prior; the American session carries no scheduled release and no weekly inventory statistic, an unusually empty calendar that removes the mechanism by which a range normally breaks |
| Mon Aug 31 evening | the private Chinese manufacturing survey late in the Asian window, consensus 51.1 against a 50.9 prior, alongside Australian and Japanese manufacturing prints |
| Tue Sep 1 | the global manufacturing survey round through the European morning and euro-area flash inflation at 5:00 AM ET, the first-order grouping rebuilding |
| Wed, conventional | the weekly government inventory report customarily arrives mid-week, the next scheduled first-order crude catalyst, though it was not on the captured calendar window |
The economic releases referenced above are published on the official government calendars below. Price levels are derived from standard technical and statistical methods, and the market read is AlgoIndex's own analysis. How we grade these calls is set out in our performance methodology.
- US Bureau of Economic Analysis, Personal Income and Outlays (PCE)
- US Bureau of Economic Analysis, Gross Domestic Product
- US Bureau of Economic Analysis, release schedule
- US Census Bureau, Advance Durable Goods (M3) release schedule
- US Energy Information Administration, Weekly Petroleum Status Report
- US Department of the Treasury, auction schedule and results
- AlgoIndex performance methodology



