
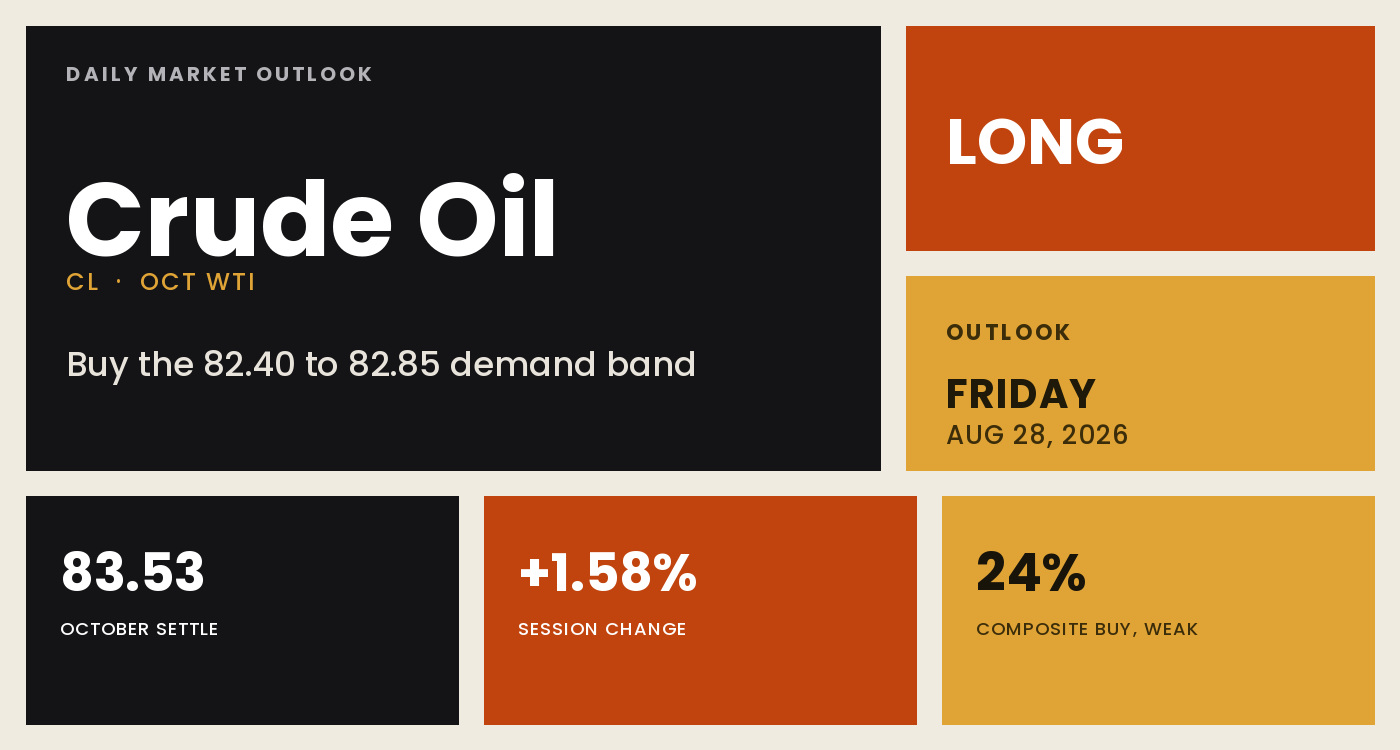
Crude oil reversed higher on Thursday and defended the close, settling the October contract at 83.53, up 1.30 or 1.58 percent. The session ran from an 80.65 low to an 84.27 high, a 3.62 dollar span worth 4.34 percent of the settlement and wider than the 3.10 dollar 14-day average true range. Price closed at 79.6 percent of that range, the mark of buyers holding into the settlement rather than a drift-up finish. The advance was compressed rather than steady, the decisive portion arriving in a single half-hour bar that opened 82.78 and ran to 84.04, the signature of headline repricing. Participation was heavy, trailing five-session volume of 192,366 contracts against 270,304 open interest, above both the 20-day and 50-day baselines and consistent with active two-sided engagement through the week's decline and Thursday's recovery.
The driver was diplomatic. Press reports during the New York afternoon indicated the US administration has no interest in returning to the terms of the June agreement signed with Iran, a headline that crossed at 1:44 PM ET and undercut the developing view that an Iran and Oman understanding on the Strait of Hormuz would cascade into broader regional normalisation. The contradiction sits in what followed. The 83.53 settlement was fixed in the 2:30 PM ET window, and conditional-reopening remarks from Iran's security council leadership crossed between 3:05 and 3:12 PM ET, after the print was set. Crude has given part of the move back since, the post-settlement electronic quote near 8:50 PM ET reading 83.30, some 0.23 beneath the settlement. A reader looking only at the settlement sees a decisive win for the bulls; a reader looking at the electronic quote sees a market that stopped believing part of the story within forty minutes. With no crude catalyst on Friday and a two-day weekend headline window ahead, positioning risk sits on both sides.
A defended up-close inside a down week
The constructive read starts with structure. Thursday's 80.65 low was the second test of the two-day demand shelf built by Wednesday's 80.23 print, forming a higher low and the most important support on the chart. Price now holds above every major moving average, the 5-day at 83.31, the 20-day at 81.47, the 50-day at 77.96, the 100-day at 80.17 and the 200-day at 71.94. Every horizon beyond a week is positive, up 1.95 dollars over 20 days, 9.23 over 50 and 23.42 over 200, and the medium-term trend has advanced 12.44 percent over 50 sessions and 39.02 percent over 200. Year to date the average price is 74.92 and the market trades 46.51 percent above where the year began. The reversal reclaimed the 82.00 to 83.00 band that had capped the prior session's bounce attempts, and the higher low is what gives that reclaim standing.
What argues the other way is momentum, and it is a horizon problem rather than a contradiction. The multi-indicator composite reads only 24 percent buy with weak signal strength, short-term components averaging 20 percent buy and long-term components netting to a hold. Trend strength confirms the caution: directional index readings are 20.58 on the 9-day, 16.13 on the 14-day, 14.11 on the 20-day and 12.05 on the 50-day, three of four beneath the 20 threshold that separates trend from range, with the 50-day close to inert. On the 14-day the positive directional component at 22.64 barely leads the negative at 21.86, too small to constitute an edge. Crude is not trending on any horizon that matters for a single session; it is oscillating inside a range with violent daily amplitude. Realised volatility has compressed from 43.85 percent on the 50-day window to 27.09 percent on the 14-day, which typically precedes either an expansion or a genuine range settlement.
The 80.23 to 80.65 shelf against the 84.27 pivot
Two structures frame Friday. Beneath price, the 80.23 to 80.65 demand shelf is where the week's selling was absorbed, with the denser 81.95 to 82.12 confluence, the two-standard-deviation support, the 18-day average cross and the four-week retracement all within seventeen cents, the level that separates a pullback from a break. Overhead, 83.78 is the immediate line the market must clear, 84.27 is the swing pivot that defines whether the reversal extends, and the 84.42 to 84.65 zone, where the 9-day average, the 70 percent stochastic threshold and the one-standard-deviation band converge, is the wall between a bounce and a genuine repair. Friday carries no first-order crude event, since the weekly government inventory report is a Wednesday release and the next print arrives after the weekend, so the instrument trades on headline flow and weekend positioning. The single scheduled item capable of moving crude is the 10:00 AM ET preliminary benchmark payrolls revision, acting through the dollar. Crude has no liquid options proxy, so positioning is read from the physical complex, where a 6.17 dollar Brent to WTI differential and refined products that settled higher alongside crude show the market pricing a supply-access concern rather than a US demand improvement.
Buy the pullback, respect 81.90, size for range
The plan buys the 82.40 to 82.85 confluence, the band built by the 82.82 pivot point, the 82.41 one-standard-deviation support and the 82.25 fifty-percent stochastic threshold, on a pullback that works against the two-day demand shelf at 80.23 and 80.65. The stop is 81.90, set beneath the tightest support confluence on the chart, the 81.95 two-standard-deviation support, the 81.99 eighteen-day average cross and the 82.12 four-week retracement, about 0.75 dollars from the 82.65 entry midpoint. Targets step up to 83.78, the current electronic session high, then 84.65, the upper edge of the confluence at the nine-day average cross, then 84.98, the first pivot resistance and the round-number approach to 85.00, only if momentum carries through on expanding volume, for reward-to-risk of roughly 1 to 1.5, 1 to 2.7 and 1 to 3.1. Two live outs cut against the long: a confirmed announcement that the Strait of Hormuz corridor is opening, or publication of an agreed conditions list with US acceptance, removes the supply-access premium and should be treated as an immediate exit regardless of price, with the shelf at 80.23 to 80.65 the likely destination; a tanker incident or a strike on export infrastructure would carry price through 84.98 toward 86.44 and make the entry unreachable rather than wrong. Given the 10:00 AM ET payrolls revision, half size suits any entry taken before that release. Our published record lays out how these calls are graded.
The physical complex still prices a disrupted waterway while the headlines price it open, and the two cannot both hold. Thursday's higher low against Wednesday's 80.23 print gives the base demonstrated weight, so buying the 82.40 to 82.85 pullback, sized for a wide range, is the trade, and a concrete corridor deal from Tehran is the one development that flips it.
A defended higher low beneath a still-intact uptrend is a pullback to buy, not a ceiling to chase. The plan favours the 82.40 to 82.85 band, respects 81.90 and sizes for a 3 to 4 percent range, because the Tehran corridor readout can land at any hour across a two-day weekend.
This is the read our members get every session, before the bell, with the levels drawn and the setup defined. See how the same dealer-positioning work turns into systematic signals.
View pricingThe complete data picture
Every number behind Friday’s plan, charted first; the full numeric reference follows underneath.
Full numeric reference, every remaining figure from the review
| Average | Value | Settle vs |
|---|---|---|
| 5-day | 83.31 | above by 0.22 |
| 20-day | 81.47 | above by 2.06 |
| 50-day | 77.96 | above by 5.57 |
| 100-day | 80.17 | above by 3.36 |
| 200-day | 71.94 | above by 11.59 |
| Year-to-date | 74.92 | above by 8.61 |
| Level | Reference |
|---|---|
| 88.07 to 91.27 | thirteen-week and fifty-two-week highs with the third pivot resistance, out of single-session reach |
| 87.68 to 88.60 | one-month high and chart extension, the ceiling of the recent range |
| 86.40 to 86.44 | second pivot resistance and the medium-average convergence stall |
| 84.98 to 85.58 | first pivot resistance and the standard-deviation bands, the heaviest overhead supply within a day of travel |
| 84.42 to 84.65 | the trend ceiling: nine-day cross, 70 percent stochastic and one-SD resistance, the line between a bounce and a repair |
| 84.27 | Thursday session high, the swing pivot |
| 83.78 | electronic session high, first overhead reference and target one |
| 83.53 | October settle |
| 82.82 to 83.31 | five-day average, pivot point and computed target, the immediate barrier a recovery must reclaim |
| 82.40 to 82.85 | primary buy band and demand confluence, the entry |
| 81.90 to 82.12 | the stop shelf: two-SD support, 18-day cross and four-week retracement, the tightest confluence on the chart |
| 81.36 to 81.59 | three-SD support, midpoint strength level and first pivot support |
| 80.40 | four-week 50 percent retracement, first waypoint toward the shelf |
| 80.23 to 80.65 | the two-day demand shelf, Wednesday and Thursday lows, the base the long works against |
| 77.61 to 79.78 | forty-day cross, pivot supports and the 61.8 percent retracement, the downside if the shelf fails |
| 73.10 | one-month low, out of single-session reach |
| Metric | Reading |
|---|---|
| Options surface | no liquid crude options proxy; positioning is read from the physical complex rather than an equity-fund surface |
| Brent-WTI differential | 6.17 dollars as Brent settled 89.70, up 1.86 or 2.12 percent, the waterborne grade leading the landlocked one, the mark of a supply-access concern rather than a US demand improvement |
| Product settles | September gasoline 3.3842 and diesel 4.2787 a gallon, both settling higher alongside crude, so the advance was not a pure crude-specific premium at the expense of refiner economics |
| Crack spreads | no month-matched crack derived; the September product settlements do not share the October crude delivery month, and an unmatched calculation would misstate refining margin, so the complex is read directionally |
| Natural gas | 2.9070 per million British thermal units on the September contract, with European winter storage among the lowest in two decades a slow distillate-side support |
| Historic volatility | 27.09 percent over 14 days against 38.56 percent over 20 and 43.85 percent over 50, short-dated realised compressing even as headline intensity stays high |
| Forward curve | front-to-second-month spread not derived this session, deliberately left unstated |
| Open interest versus volume | 270,304 open against a trailing five-session average of 192,366, above the 20-day 185,539 and 50-day 145,378, active two-sided engagement |
| Input | |
|---|---|
| Dollar index | 99.122, down 0.007 or 0.01 percent, effectively unchanged, which removes the mechanical explanation and confirms a commodity-specific move |
| 10-year yield | 4.669, steady on the session |
| Volatility index | 14.50, down 0.72 or 4.73 percent, a subdued read |
| Gold | 4,640.7, down 23.3 or 0.50 percent, refusing a haven bid while crude rose, a supply-access signal rather than systemic fear |
| Equity index | the broad index up 55.29 or 0.72 percent to 7,730.99 and the technology proxy up 1.37 percent, a risk-on backdrop |
| Brent crude | 89.70, up 1.86 or 2.12 percent, leading WTI by 54 basis points, the differential at 6.17 dollars |
| Jobless claims | initial 203,000 against a 208,000 forecast and 206,000 prior, continuing 1.778 million, a mild demand-side positive |
| Seven-year auction | cleared 4.512 percent against a prior 4.473 on a 2.500 cover, a marginally softer clear with demand intact |
| When | Event |
|---|---|
| Fri Aug 28 | no first-order crude event; the 10:00 AM ET preliminary benchmark payrolls revision, forecast positive 157,000 against a prior negative 911,000, a substantial dollar risk into the weekend, with the central banking symposium running all day and into Saturday |
| Sun Aug 30 | the Chinese manufacturing survey at 9:30 PM ET, forecast 49.5 against a prior 49.2, the first demand-side input of the new week, a print above the 50 line a genuine positive |
| Mon Aug 31 to Tue Sep 1 | the broader global manufacturing surveys, the next demand-side confluence |
| Wed Sep 2 | the weekly government inventory report resumes, the next scheduled first-order crude catalyst, with the industry preview the prior day |
| Fri Sep 4 | the weekly regulator positioning report, still describing positioning a week and a half behind the market |
The economic releases referenced above are published on the official government calendars below. Price levels are derived from standard technical and statistical methods, and the market read is AlgoIndex's own analysis. How we grade these calls is set out in our performance methodology.
- US Bureau of Economic Analysis, Personal Income and Outlays (PCE)
- US Bureau of Economic Analysis, Gross Domestic Product
- US Bureau of Economic Analysis, release schedule
- US Census Bureau, Advance Durable Goods (M3) release schedule
- US Energy Information Administration, Weekly Petroleum Status Report
- US Department of the Treasury, auction schedule and results
- AlgoIndex performance methodology



