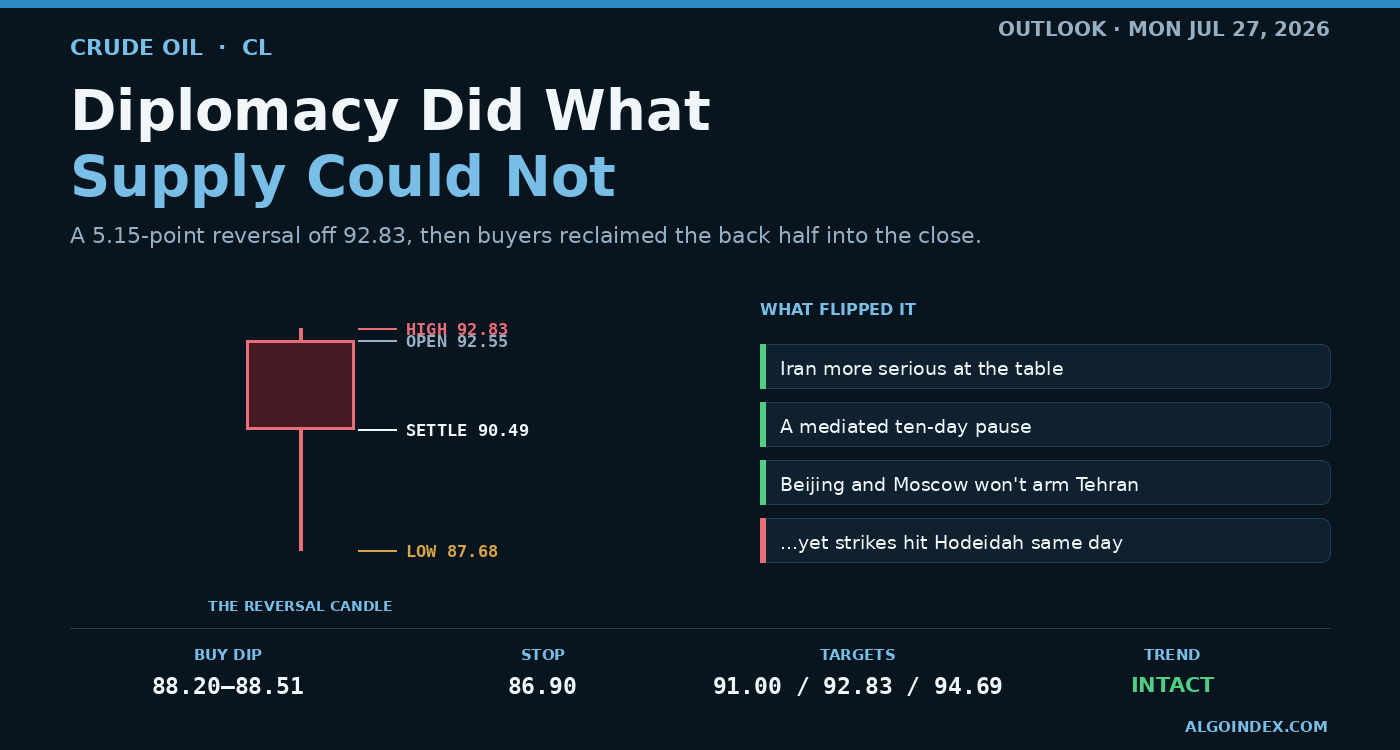
WTI settled 90.49, down 1.84 percent, in a 5.15-point two-sided reversal as the first credible de-escalation signals trimmed the war premium, even as strikes continued. Trend intact above every average but overbought: buy the 88.20 to 88.51 base toward 91.00 and 92.83; below 87.68 the correction opens.
The 60-second read
Crude finally cracked, and the reason matters. September WTI settled 90.49, down 1.84 percent, snapping a violent five-session run on a wide reversal that cut both ways: up to 92.83 inside the opening hour, down to 87.68 by midday, then a recovery into the close. What broke it wasn't supply, it was diplomacy. For the first time this cycle, credible de-escalation signals crossed the wires at once, Iran turning more serious at the table, a mediated ten-day pause proposal, assurances that neither Beijing nor Moscow will be arming Tehran. The catch is that fresh coalition strikes against Hodeidah, plus another Red Sea vessel attack, hit that same afternoon. Only the forward expectation eased; nothing physical normalized. We lean long a controlled pullback into 88.20 to 88.51 rather than chase, respecting that this is still an overbought market on a two-way headline switch.
The shape of Friday tells you more than the number. A 5.15-point washout inside a single session is what happens once a crowded, momentum-driven book finally gets a reason to lighten. Thursday’s note called it parabolic into the 95.30 ceiling and said to buy a pullback rather than chase; Friday handed over the pullback.
But look where it closed. Price came off the 87.68 low and settled 90.49, in the upper half of the day rather than at the bottom. That's what separates profit-taking from a wholesale reversal: dip demand showed up. Volume around 335,994 contracts set against 301,342 in open interest confirms real repositioning, not some thin drift lower, and Friday's inability to hold Thursday's 92.19 close now sets the near-term ceiling.
A reversal inside a powerful trend
-1.84%
On the session
5.15
Point range
+26%
Twenty sessions
46.6%
Historic volatility
The first real distribution day of a run that carried crude from the mid-60s to the low-90s. A pause signal, not a top, until support actually breaks.
Diplomacy did what supply could not
For three weeks the direction was one-way, and the driver was physical: Houthi forces targeting tankers, strikes on Gulf infrastructure, threats to shut the Bab el-Mandeb gateway. That premium carried front-month crude out of the mid-70s and into the low-90s, roughly 5.5 percent shy of the annual high.
Friday, the other side of the ledger finally got a voice. Word that Tehran has grown more serious at the table, a China-initiated push toward new three-way talks, word that Beijing and Moscow have no plans to arm Iran, and a floated ten-day halt meant to revive an interim deal, all landing together. That is enough to trim a war premium, and it did. What it isn't is a change in the physical picture. Coalition strikes landed on Hodeidah and on Kamaran Island, while a Saudi vessel took hull damage out in the Red Sea, all on the very afternoon crude broke.
The market repriced the odds of further escalation, not the supply itself. Those are different things, and the gap between them is where Monday’s trade lives.
Powerful trend, stretched rubber band
The trend evidence isn't subtle. Price sits above every major average, the directional index reads 32.15 with positive pressure at 35.95 against just 8.58 negative, and the 9-day directional read hits an extreme 53.73. This is a powerful, well-established uptrend in which Friday registers as a counter-trend correction rather than a directional flip.
The stretch is just as clear, and it's extreme. The settle runs 3.31 points clear of even that fastest 5-day line, and sits roughly 14 points, about 26 percent, above the 20-day. Stochastics are deep, the 14-day fast line at 90.96 with the slow at 92.38, and the 14-day strength read at 69.17 is knocking on the overbought door with the 9-day already through it at 75.73. A dislocation that wide invites precisely the snap-back Friday produced.
The base and the reclaim: 88.20 and 92.83
Two zones frame Monday. Beneath price, the 88.51 first pivot support and the 88.20 deviation support form the first demand band, with the 87.68 session low just under it as the intraday line in the sand with the 5-day line at 87.18 sitting in that same pocket as a trend filter. Break 87.68 decisively and the correction opens toward 86.54, then the zone at 85.27 and 84.82.
Above, the 91.00 computed pivot acts as the fulcrum, the level the market has to reclaim to steady the short-term bid. Beyond that sits Thursday's 92.19 close, the gap whose failed retest rejected Friday's rally, and 92.83 is what has to be taken back to re-arm the upside. Clear that and 93.50 comes into view, then 94.69, with the 95.30 annual high as the structural cap, and the obvious magnet if escalation returns.
The trade
The base case is a pullback buy: long 88.20 to 88.51 on a dip that holds above 87.68 with a visible buying response, stop 86.90 beneath the low and above the two-deviation support. Scale out at the 91.00 pivot, then the 92.19-to-92.83 reclaim band, then 94.69 if a re-escalation carries price through 93.50. That runs roughly 1:1.7 to the first target and about 1:5.2 to the last, which is the reward for buying a defined base instead of chasing an overbought market into overhead supply.
The alternate fades a failure: should the market open soft and lose 87.68 with momentum as the diplomacy story extends, short the retest of 87.68 and 88.00 from underneath toward 86.54, then the 85.27 and 84.82 pair, stop above 88.90. Half size on that one, with fast profit-taking, because the upside headline tail never goes away. Sit it out if crude gaps past either the 88 band or the 92.83 high before the 09:45 gate without a retest, and never initiate the long into an overbought reading without a genuine pullback first.
The complete data picture
Every number behind Monday’s plan, charted first; the full numeric reference follows underneath.
CHARTED
Level map
NYMEX WTI, September front month · every reference from the review, to scale
BELOW THE LOW: CORRECTION OPENS 66-88ABOVE THE PIVOT: TREND RE-ARMS 91-99BUY-THE-DIP SUPPORT BAND 88-89
Crude settled 90.49 after a wide two-sided reversal: up to 92.83, down to 87.68, then a recovery into the close. The 88.20 to 88.51 band is the buy-the-dip base with the 87.68 low beneath it; reclaiming 91.00 and then 92.83 re-arms the upside toward 93.50 and the 95.30 annual high.
The reversal day
A 5.15-point washout, then a recovery close
Friday snapped a violent five-session advance with a wide two-sided candle. Price opened 92.55, tagged 92.83 in the first hour, then sold to 87.68 before buyers reclaimed the back half of the range. Volume ran heavy near 335,994 contracts against open interest of 301,342, so this was genuine repositioning. The close landing in the upper-middle of the range says profit-taking, not a wholesale reversal.
Moving-average stack
Above every average, and stretched far above them
Price sits above the entire stack: the 5-day at 87.18, the 50-day at 80.97, the 100-day at 81.00, the 20-day at 76.64 and the 200-day at 70.31. The settle runs 3.31 points above even the fastest average, and the roughly 14-point gap to the 20-day, about 26 percent, is the clearest measure of how far this rally has traveled. The 5-day at 87.18 is now the first dynamic support beneath price.
Momentum
A powerful trend, stretched into overbought
The 14-day relative strength reads 69.17 just beneath the overbought threshold, with the 9-day already at 75.73. Stochastics are deep: the 14-day fast line at 90.96 with the slow at 92.38. The directional index reads 32.15 with positive pressure at 35.95 against negative at just 8.58, and the 9-day at an extreme 53.73. A strong, established uptrend in which Friday registers as a counter-trend correction.
Expected range
A wide one-ATR envelope in a high-volatility market
The 14-day average true range is 3.93 points (4.36 percent) with an average daily range of 3.95, and the 9-day is higher at 4.11 (4.56 percent). A one-ATR band on the 90.49 settle projects roughly 86.56 to 94.42; centered on the 91.00 pivot instead, about 87.07 to 94.93. With 14-day historic volatility near 46.6 percent, size for a 4-point average day and wider stops than normal.
Primary setup
Buy the pullback inside the uptrend
Long the 88.20 to 88.51 band, the one-SD support and first pivot support, on a pullback that holds above the 87.68 low with a buying response; stop 86.90, beneath the low and above the 86.54 two-SD support. Targets the 91.00 pivot, then the 92.19 to 92.83 reclaim band, then 94.69 on a re-escalation carrying through 93.50. A sustained close below 86.54 negates the thesis.
Two-sided headline risk
The premium eased; the physical supply picture did not
Crude has advanced roughly 10.2 percent over five sessions and about 26 percent over twenty on Hormuz and Red Sea disruption. Friday’s reversal came from the first credible de-escalation signals of the cycle: Iran engaging more seriously in talks, a mediated ten-day cessation proposal, and assurances Tehran will not be armed. Yet fresh coalition strikes on Hodeidah and Kamaran Island and a new Red Sea vessel attack crossed the wires the same afternoon. Only the forward expectation eased; the physical risk did not.
Monday’s calendar
All times Eastern · no crude-specific first-order event
There is no crude-inventory print until midweek, so Monday carries no energy-specific first-order event. The most relevant scheduled item is the 08:30 durable-goods release as a broad growth-demand read (forecast plus 1.5 percent against a prior minus 4.5); the auctions are second-order. Direction will be set by price behavior around the pivot and by any Middle East headline.
Full numeric reference , every remaining figure from the review
Contract
NYMEX WTI front month, September 2026 (CLU26). Review prepared Friday evening July 24 for the Monday July 27 regular session.
Session prints
September WTI settled 90.49, down 1.70 (1.84 percent), snapping a violent five-session advance with a wide two-sided reversal candle. It opened 92.55, extended to a 92.83 session high in the first hour, sold to an 87.68 low, then buyers reclaimed the back half of the range into the close. Volume ran heavy near 335,994 contracts against open interest of 301,342. The 5.15-point intraday range (better than 5.5 percent peak to trough) came with 14-day historic volatility near 46.6 percent. Thursday's 92.19 settle is the immediate reference gap overhead.
Range context
Crude has advanced roughly 10.2 percent over five sessions and about 26 percent over twenty, from the mid-70s into the low-90s inside roughly four weeks. The one-month high is 93.50 and the 13-week and 52-week highs align at 95.30, within 5.5 percent of the settle. The one-month and 13-week low sits far below at 67.12 and the 52-week low at 55.49. Friday's candle is the first meaningful distribution day of the run, a wide-range bearish reversal that failed at the prior settle, a pause signal rather than a completed top until support actually breaks. Key swing pivots: the 87.68 low and the 92.83 high, with the 91.00 pivot the fulcrum between them.
Moving averages
Price sits above every major average: the 5-day at 87.18, the 20-day at 76.64, the 50-day at 80.97, the 100-day at 81.00 and the 200-day at 70.31, with the year-to-date average at 75.34. The settle runs a 3.31-point premium to even the fastest average, and the gap to the 20-day, near 14 points or a 26 percent spread, is the clearest measure of how far and fast this rally has run. The 5-day at 87.18 is the first dynamic support; a close beneath it is the earliest warning the correction is deepening.
Oscillators and trend
The 14-day relative strength reads 69.17, just beneath the 70 threshold, having ticked lower Friday; the 9-day at 75.73 is already above 70, while the 20, 50 and 100-day at 63.77, 56.88 and 55.56 confirm a strongly positive but decelerating profile. Stochastics are deeply overbought: the 14-day fast line 90.96 with the slow 92.38, the 9-day fast 87.53 with its slow 90.18. The multi-indicator composite registers 48 percent buy, mixed-to-mildly-constructive. The directional index reads 32.15 on the 14-day with positive pressure 35.95 against negative 8.58, and the 9-day at an extreme 53.73.
Volatility
The 14-day average true range is 3.93 points (4.36 percent) with an average daily range of 3.95; the 9-day true range is higher at 4.11 (4.56 percent). A one-ATR band around the 90.49 settle projects roughly 86.56 to 94.42, or about 86.6 to 94.4 rounded; centered on the 91.00 pivot it spans about 87.07 to 94.93. With 14-day historic volatility near 46.6 percent, size for a 4-point average day and expect wider option premium and stop distances than normal.
Key levels
Resistance: the 91.00 computed pivot; the 92.19 prior settle (the failed-retest gap); the 92.83 session high (reclaim trigger); the 93.50 one-month high; the 94.69 first-level pivot resistance; the 95.12 computed target price; the 95.30 52-week and 13-week high confluence; then the 96.18 one-SD band and the 97.84 two-SD extension near the 97.18 second-level pivot. Support: the 88.51 first-level pivot support with the 88.20 one-SD support (the first demand band); the 87.68 session low; the 87.18 5-day average as a dynamic reference; the 86.54 two-SD support; the 85.27 three-SD support near the 84.82 second-level pivot; the 82.33 third-level pivot; and the 67.12 one-month low as the base of the advance. The 90.42 relative-strength overbought line sits just under the settle.
Positioning and complex
Front-month WTI carries no listed dealer-gamma surface, so the lens is the energy complex: term structure, products and speculative flow. The curve skews toward backwardation, the front month commanding a premium that prices near-term scarcity from the Hormuz and Red Sea disruptions. Diesel and gasoline cracks stay firm and shipping-disruption-led rather than demand-led. Speculative flow, inferred from the 26 percent twenty-day advance, rising open interest to 301,342 and the weekly positioning data released Friday for the week ended July 21, points to accumulated long exposure that leaves the book exposed to sharp two-sided repositioning on headlines.
Macro and geopolitics
Geopolitics drove both directions. Escalation stayed active: Saudi-led coalition strikes on Houthi military sites in Yemen's Hodeidah governorate and reportedly Kamaran Island, plus a Saudi vessel damaged in a fresh Red Sea attack. De-escalation gained traction and drove the reversal: reports Iran is engaging more seriously in talks, a China-initiated push toward new Pakistan-Iran-United States negotiations, signals Beijing and Moscow will not arm Tehran, and a proposed ten-day cessation of strikes to revive an interim deal. Investment-bank commentary noted comparable global-benchmark crude has risen roughly 28 dollars a barrel over three weeks. The dollar index traded near 100.9, roughly flat. US inflation earlier in the month came in cooler, consumer prices 3.5 percent against a 3.8 forecast and producer prices 5.5 against 6.2. US equities wavered as a semiconductor selloff offset the oil decline and steady earnings.
Setup and paths
Primary long: entry 88.20 to 88.51 on a pullback holding above the 87.68 low with a buying response; stop 86.90, beneath the low and above the 86.54 two-SD support; T1 91.00, T2 92.19 to 92.83, T3 94.69 (only on a re-escalation through the 93.50 one-month high); roughly 1:1.7, 1:3.4 and 1:5.2 from the mid-entry. Invalidation on a sustained close below 86.54. Alternate short: on a momentum break of 87.68, short the retest of 87.68 to 88.00 from below targeting 86.54 then 85.27 to 84.82, stop above 88.90, half size with fast profit-taking. Monday scenarios: a de-escalation slide tests 88.20 then 87.68 with a stretch to 86.54; the most-likely case is two-sided consolidation between 88.20 and the 91.00 to 92.19 band, settling near 89.5 to 91; a re-escalation snaps price back through 92.83 toward 93.50 and 94.69. Paths: A consolidation about 45 percent (chop 88 to 92), B correction continuation about 30 percent (lose 87.68 toward 86.54 and 84.82), C re-escalation about 25 percent (reclaim 92.83, run at 94.69 to 95.30). No entries before 09:45 ET; skip gaps through the 88 band or the 92.83 high without a retest.
Calendar
04:00 ET German business-climate survey (Expectations 84.7, Current Conditions 87.3, Business Climate 86) and eurozone money-supply growth (3.2 percent); 08:30 ET US durable goods (forecast plus 1.5 percent versus a prior minus 4.5) and core durable goods (forecast plus 0.9 versus a prior plus 1.4), the primary macro print; 11:30 ET US 2-year note auction and 13:00 ET 5-year note auction; 23:05 ET an Australian central-bank speaker. There is no crude-inventory print until midweek (private estimates typically Tuesday afternoon, official figures typically Wednesday morning). The week builds through Tuesday's US consumer confidence and a tentative leaders' meeting at 11:00 ET.
AlgoIndex publishes institutional-grade reviews on ES, NQ, GC, and CL, built on professional-grade market data and our own analysis, priced for individual traders.