
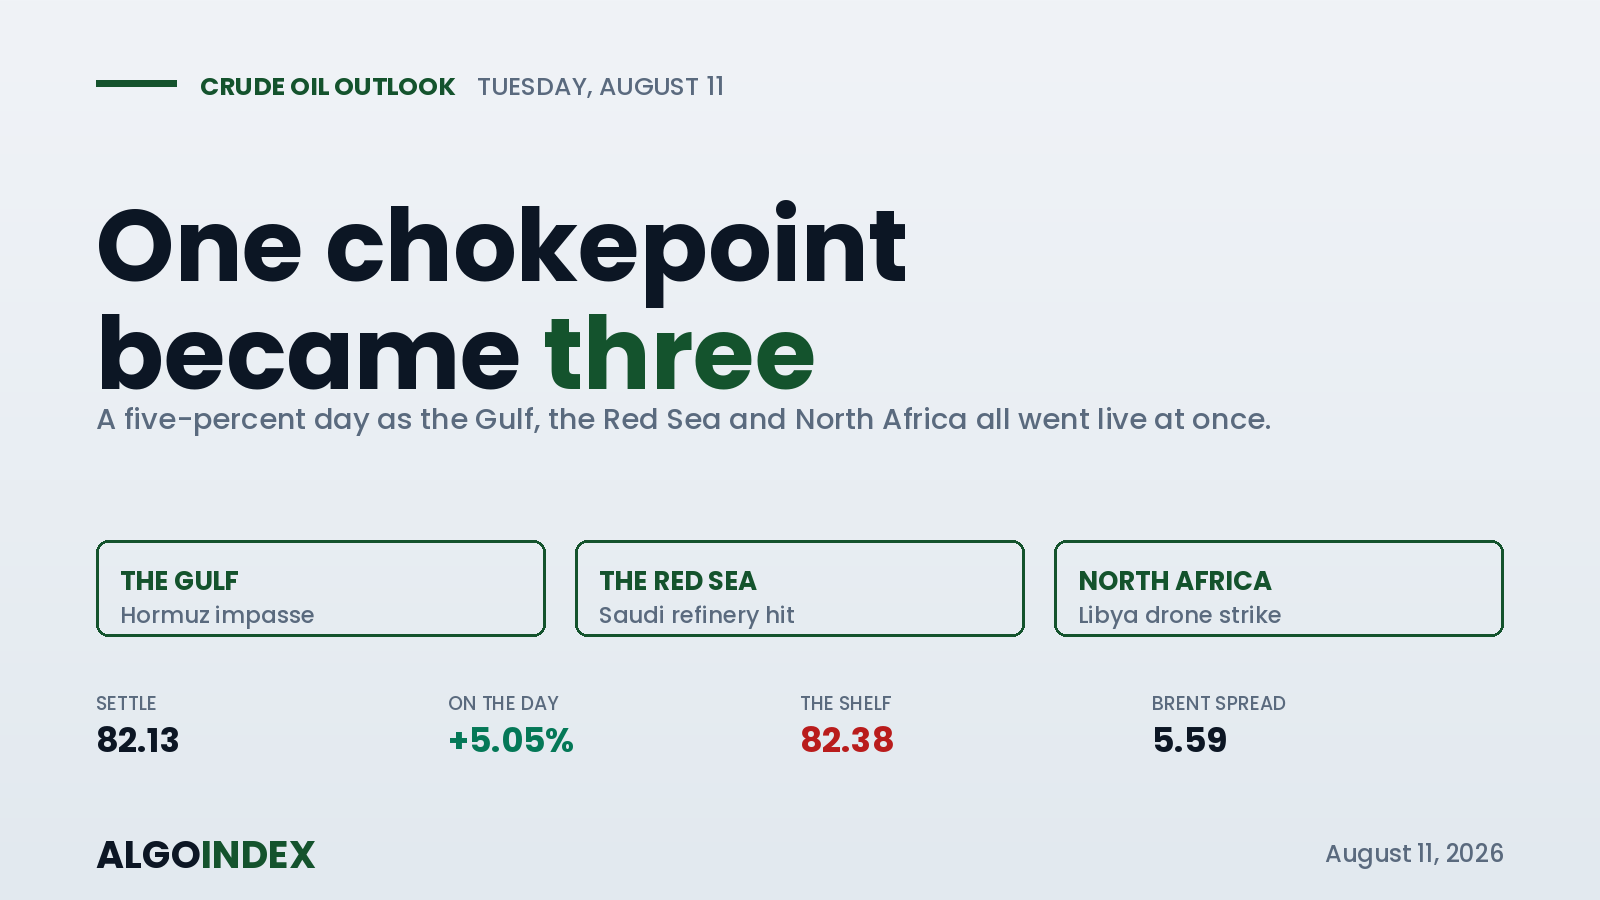
Monday was the largest single-session advance in crude since the late-July dislocation, and it was a one-way trade from the opening bell. September WTI opened at 78.42, spent ninety minutes probing 77.79, and then never looked back, grinding through every intraday shelf on expanding volume to settle at 82.13, up more than five percent.
The detail that matters sits in the gap between the settle and the close. The pit settled at 2:31, before the day's heaviest headlines landed. A confirmed drone strike on a Libyan refinery crossed at 3:14, and remarks that the United States retains the ability to escalate ran through 3:38. Crude closed the electronic session at 82.30, above its own settle, which flips last week's pattern: the post-settle order flow kept paying up rather than fading the print. When the close finishes above the settle after headlines like those, the settle is the conservative number and the close is the market's verdict.
One chokepoint became three
The market entered Monday still carrying last Thursday's optimism that a Strait of Hormuz arrangement was close. That premise unwound in stages. A presidential post said Iran was demanding compensation for the five-month conflict and that Washington would demand it in return, which the market read as the reopening timeline slipping rather than tightening. Then the supply story stopped being a single chokepoint. A drone hit a laden fuel storage tank at Libya's Zawiya refinery, and a separate strike was reported against a Saudi refinery. Two refinery outages on separate continents inside one session, layered on the Gulf standoff, is a different picture entirely, and it is why the products moved in lockstep with crude rather than lagging it.
The one bearish data point sits underneath all of it. Last week's payrolls fell 23,000, a sharp cooling, and a weakening labor market is not a demand-positive input for crude even when it lifts equity multiples. This advance is a supply story running over a soft demand backdrop, which is exactly the kind of move that reverses hard if the supply headline flips.
Stretched on price, not on momentum
Here is what keeps this from being a simple continuation buy. Price has recovered above every major moving average for the first time in this sequence, but only barely: the 20-day and 100-day sit less than a dollar below spot, so a routine half-dollar pullback puts price back inside them. The stack is bullish without any margin yet, and that distinction separates a continuation trade from a chase.
The oscillators argue the move has room. A five percent day left the medium-window stochastic washed out in the lower third of its range, because it measures against the far higher July highs, and the directional index is accelerating rather than fading. Volatility is the risk-management input that governs everything: the 14-day average range is 4.37 dollars, so sizing to a two-dollar stop in this market is not managing risk, only relabeling it.
The 82.38 shelf decides the session
Everything about Tuesday depends on one band. The 82.14 to 82.38 shelf is a four-way confluence: the two-standard-deviation resistance, the 18-day average, the prior week's high, and Monday's session high, all inside 24 cents. Which side of it price trades defines the day. The Brent to WTI spread is the tell to watch alongside it. At 5.59 dollars it is wide, and that width is the market saying the risk being priced is seaborne, in the Gulf and the Red Sea and at North African refineries, rather than domestic. If the premium starts to deflate, that spread narrows before flat price falls.
One chokepoint is a dispute. Three separate supply fires across three regions in seventy-two hours is a repricing.
Trade the break, respect the gap risk
The plan takes the continuation long only on an accepted break, meaning a close above 82.38 and a pullback that holds 82.14, with a structural stop below 81.52 and targets at 83.01, then 84.54, then 85.48. The asymmetry sets the conviction. The likelier path is a grind higher; the larger single move is a gap lower on a confirmed reopening headline, which could pull two to three dollars out in a hurry. So the size stays moderate, overnight length is treated as genuinely exposed, and the position gets cut before Wednesday's dense run of energy and inflation data rather than carried into it. A confirmed Strait reopening cancels the long outright, on the headline, not the level. How we grade a continuation trade like this is in our performance methodology.
The settle understated the day, the close corrected it, and the 82.38 line is where Tuesday casts the tiebreak.
This is the read our members get every session, before the bell, with the levels drawn and the setup defined. See how the same dealer-positioning work turns into systematic signals.
View pricingThe complete data picture
Every number behind Monday’s plan, charted first; the full numeric reference follows underneath.
Full numeric reference , every remaining figure from the review
| Average | Value | Position vs 82.13 |
|---|---|---|
| 5-day | 77.75 | above by 4.4 (reversion pull) |
| 20-day | 81.83 | above by 0.45 (thin margin) |
| 50-day | 78.98 | above by 3.15 |
| 100-day | 81.52 | above by 0.76 (thin margin) |
| 200-day | 71.48 | above by 10.65 |
| Zone | Detail |
|---|---|
| 92-94 | 62% of visible profile, the true ceiling |
| 82.30 | 6% node, price closing into it |
| 76.12 | 7% demand node, retracement measure |
| about 77.00 | 36% intraday node |
| about 78.40 | 21% intraday node |
| 74.00 | prior-week low, structural line |
| Window | ATR | ATR % |
|---|---|---|
| 9-day | 4.46 | 5.43% |
| 14-day | 4.37 | 5.31% |
| 20-day | 4.26 | 5.19% |
| 50-day | 3.87 | 4.71% |
| Item | Reading |
|---|---|
| Managed money | 189,518 long / 102,560 short (lightening pre-rally) |
| Non-commercials | 308,841 / 196,398 |
| Producers | +11,042 shorts (hedging strength) |
| Brent-WTI spread | 5.59 (seaborne) |
| Gasoline / diesel crack | about 49 / about 93 per barrel (run hard) |
| Sept expiry | Aug 20, roll begins soon |
| Input | |
|---|---|
| Multi-theatre supply | Hormuz impasse + Libya Zawiya drone + Houthi Saudi refinery |
| Dollar index | 99.81, +0.21% (crude rose anyway) |
| Equities | broadly flat, paid in vol + yields |
| Natural gas | 2.7940, +4.96% (weather, not geopolitics) |
| Prior inventories | +2.479M build |
| Reopening risk | a Hormuz deal = 2-3 dollar gap lower |
| When | Event |
|---|---|
| Tue 12:00 | Short-term energy outlook (first-order for crude) |
| Wed 04:00 / 08:00 | IEA + producer-group monthly reports |
| Wed 08:30 | US CPI 0.1% m/m |
| Wed 10:30 | Crude inventories (prior +2.479M) |
| Thu 08:30 | US PPI + claims |
| Fri 08:30 | US retail sales |



