
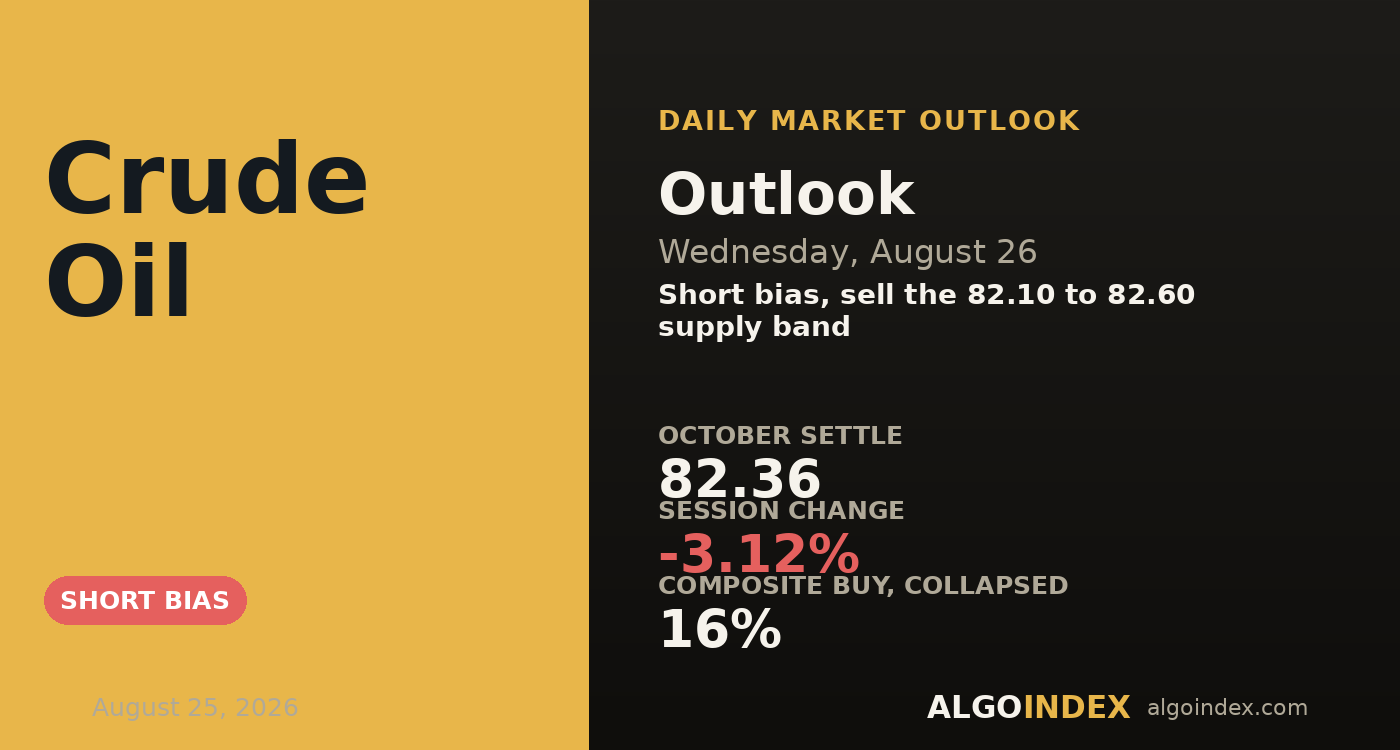
Crude took its second hard step down on Tuesday, and this time the after-hours action told a grimmer story than the settle did. The October contract went out at 82.36, off 2.65 or 3.12 percent, but the electronic quote near 81.11 as of 05:15 PM ET sat a further 1.25 lower and put the day down 4.59 percent from the 85.01 prior close. Price opened at 85.03, printed its 85.84 high early, and never looked up again. From there it stair-stepped lower all session, then broke to an 80.23 low after the settle before basing. The full 5.61 range ran to almost 7 percent of price, close to twice a normal day, and it came on 260,142 contracts against a 182,091 average. That isn't drift. It's a range-expansion move with real weight behind it.
Here's what did the damage, and it wasn't demand. The geopolitical premium came out of the barrel. The de-escalation story moved on several fronts at once: reports had the State Department preparing to send diplomats back to Middle East posts, satellite images showed seven crude carriers loading together at Iraqi export terminals, and roughly 40 tankers were said to have cleared the Strait of Hormuz on Friday night. An unconfirmed US-Iran ceasefire report crossed at 3:57 AM ET in the afternoon, and the slide on the one-minute series lines up neatly with that window. The cross-asset picture backs the crude-only read. Equity futures closed green, the volatility index eased to 15.46, the dollar barely twitched, and gold sat flat. None of that looks like fear. The market just decided cheaper oil was good news and repriced energy on its own.
Supply loosens while the bigger trend refuses to break
The bull case is still standing, and it's structural. October holds above its 20, 50, 100 and 200-day averages, and Tuesday's only real casualty was the 5-day at 84.80. The directional readings agree with that framing: on the 20-day window positive direction still leads at 24.82 against 23.07, so the oldest lens the review covers tilts up. Even the two-day drop retraced only part of the August climb off the 73.10 low, which reads as a correction inside an advance rather than the start of a rout. And price came to rest almost exactly on the 20-day line at 81.15, the average that has framed the entire summer run.
What flipped is momentum, and it flipped hard. The multi-indicator composite fell from 64 percent buy a day earlier to just 16 percent now, its short-horizon group averaging 40 percent sell while the medium group stays 75 percent buy. That internal split is the whole tension in one number. The 9-day raw stochastic has already caved to 16.47 percent, deeply compressed, which is exactly the reading that warns a short about a sharp snap-back. Meanwhile the directional index has rolled bearish at 9 days, gone tied at 14, and still favours the bulls at 20. That progression, bearish up close and bullish further out, is the fingerprint of a young downtrend sitting inside an older uptrend.
A shallow break that momentum has already turned
The plan sells strength instead of grabbing at the low, and the reason is plain: the down-move is only two sessions old and the 80.23 low held on its single test. Wednesday hands the market a stacked calendar. An 8:30 AM ET block carries the core inflation gauge at 3.3 percent, second-estimate growth at 1.5 percent, durable goods and personal income, and it'll shove the dollar and front-end yields around before the pit even opens. Then the weekly inventory print at 10:30 AM ET is the one first-order crude event on the board, with consensus looking for a 1.58 million barrel build against last week's 4.405 million. A market that just repriced 3 percent on headlines hasn't positioned for that number either way, so the reaction can run bigger than a quiet week. Above price, the 82.08 to 82.60 supply band is the first ceiling; below it, the 80.40 shelf and then the 80.07 air-pocket edge are the targets.
Sell the band, respect 83.35, keep it light
The plan sells the 82.10 to 82.60 band, the overhead built by the 2.0 Fibonacci extension at 82.08, the four-week 38.2 percent retracement at 82.12, the inverted one-standard-deviation support at 82.44 and the top of the pivot zone near 82.60, every one of which was support on Tuesday and every one of which gave way. The stop is 83.35, set above the 83.10 second pivot support that flipped to resistance and under the 83.93 moving-average stall, a full 1.00 from the 82.35 entry midpoint, which is the least room worth giving crude when a 14-day average true range runs 3.25. Targets step down to the 80.40 volume shelf and four-week midpoint, then the 78.69 forty-day-average cross, then 77.60 where the 50-day and the deeper retracements converge, and only if momentum carries through on real volume. Two live outs cut against it: a decisive reclaim of 85.01 and the 85.31 pivot rebuilds the failed advance, and any credible re-escalation, a denied ceasefire, a fresh strike, a Strait re-closure or a surprise inventory draw, flips the read at any price. That's why the size stays trimmed to half and built to survive an overnight gap. Our performance methodology sets out how we grade the result.
If the reported reopening holds, barrels are moving through Hormuz again and the premium drains out, and Tuesday's session showed a market unwilling to bid the doubts that trailed the unconfirmed ceasefire report. Selling the bounce into the supply band, small, is the trade, and a reclaim of 85.01 is the one thing that flips it.
A two-day break with momentum freshly rolled over is a sell into strength, not a lunge at the low. Sell near 82.35, respect 83.35, and keep it small, because Wednesday's data wall and the 10:30 AM ET inventory print are where this really gets settled.
This is the read our members get every session, before the bell, with the levels drawn and the setup defined. See how the same dealer-positioning work turns into systematic signals.
View pricingThe complete data picture
Every number behind Wednesday’s plan, charted first; the full numeric reference follows underneath.
Full numeric reference, every remaining figure from the review
| Average | Value | Settle vs |
|---|---|---|
| 5-day | 84.80 | below by 2.44 |
| 20-day | 81.15 | above by 1.21 |
| 50-day | 77.44 | above by 4.92 |
| 100-day | 79.95 | above by 2.41 |
| 200-day | 71.59 | above by 10.77 |
| Year-to-date | 74.75 | above by 7.61 |
| Level | Reference |
|---|---|
| 88.07 to 88.48 | thirteen-week high and third pivot resistance, the far ceiling |
| 87.50 to 87.70 | one-month high, second pivot resistance and the heaviest overhead volume node, the decline origin |
| 86.27 | first pivot resistance, the middle of last week's distribution |
| 85.84 | session high, breakdown origin |
| 85.01 to 85.31 | previous close and pivot point, the reclaim band that neutralises the break |
| 84.06 to 84.13 | first pivot support inverted and the nine-day average cross, first averaged resistance |
| 83.10 | second pivot support inverted, the stop shelf |
| 82.36 | October settle |
| 82.08 to 82.60 | sell-entry supply band: 2.0 extension, four-week 38.2% retracement, one-SD support inverted and the pivot top |
| 81.11 to 81.26 | the key support confluence: electronic quote, 20-day average, 18-day cross and the 14-day strength 50 level |
| 80.80 | eighteen-day average stall, first support beneath the confluence |
| 80.23 to 80.40 | session low and four-week 50% retracement inside the lower volume shelf, target 1 |
| 80.07 | 38.2% retracement of the thirteen-week high, last support before the air pocket |
| 78.67 to 78.69 | forty-day average cross and four-week 38.2% low retracement, target 2 |
| 77.44 to 77.61 | fifty-day-average confluence and the 13-week and 52-week retracements, target 3 and the deepest structural line |
| 73.10 | August 5 one-month low, recovery base |
| Metric | Reading |
|---|---|
| Options surface | no liquid crude options proxy; positioning read from the physical market |
| Brent-WTI differential | narrowed to 6.22 from 7.16 as Brent settled 88.58, down 3.89 percent, harder than WTI's 3.12 percent |
| Gasoline crack | widened about 1.01 to about 39.07 per barrel, refining margins defended into the crude drop |
| September product settles | gasoline 3.2529 and diesel 4.2438 a gallon, still historically rich |
| Gasoline seasonal spread | September over October gasoline 0.3616 per gallon, the summer-to-winter specification shift |
| Open interest versus volume | 277,900 open against 260,142 traded, heavy two-way participation |
| Forward curve | front-to-second-month spread not captured this session, deliberately left unstated |
| Historic volatility | 39.16 percent over 14 days and 39.10 percent over 9 days, raised with the geopolitical premium |
| Cohort | Weekly change |
|---|---|
| Managed money | net long 87,479; 195,538 long vs 108,059 short, added 4,984 longs and covered 2,579 shorts, a net build of 7,563 into the high (data Aug 18, stale, predates the two-day break) |
| Commercials | net short 153,087; 894,821 long vs 1,047,908 short, shorts up 20,927 on the week |
| Producers | added 19,134 shorts and cut 4,546 longs, characteristic hedging into strength |
| Swap dealers | 107,452 long vs 576,056 short, a heavy structural short |
| Input | |
|---|---|
| Dollar index | 98.911 as of 5:15 PM ET, down 0.07 percent, effectively unchanged, no currency component to the crude move |
| 10-year yield | about 4.64 percent into the cash close, roughly 6 basis points lower as cheaper energy fed lower breakeven inflation |
| Volatility index | 15.46, down 2.40 percent, a subdued read |
| Gold | 4,694.5, down 0.07 percent, flat and refusing a haven bid |
| Equity index futures | S&P 7,692.00 up 0.29 percent, Nasdaq 29,276.75 up 0.59 percent, risk-on |
| Brent crude | 88.58, down 3.89 percent, harder than WTI, the Hormuz premium sold specifically |
| Crude inventories | prior build 4.405 million barrels, consensus a further 1.58 million build Wednesday |
| European natural gas | near 70 euros per megawatt hour, rising even as crude fell, a narrower move than a full energy repricing |
| When | Event |
|---|---|
| Wed Aug 26 | heavy 8:30 AM ET US data block, weekly crude inventory 10:30 AM ET versus a prior 4.405 million build, chip-sector earnings 4:20 PM ET, the week's decisive crude catalyst |
| Thu Aug 27 | jobless claims 208,000 8:30 AM ET, seven-year note auction, central-bank symposium opens |
| Fri Aug 28 | symposium keynote 10:00 AM ET and the preliminary benchmark payrolls revision, consensus 157,000 versus a prior minus 911,000 |
| Sat Sep 6 | monthly meeting of the seven participating producer countries, the next supply-policy set piece |
| Wed Sep 16 | central-bank rate decision |
The economic releases referenced above are published on the official government calendars below. Price levels are derived from standard technical and statistical methods, and the market read is AlgoIndex's own analysis. How we grade these calls is set out in our performance methodology.
- US Bureau of Economic Analysis, Personal Income and Outlays (PCE)
- US Bureau of Economic Analysis, Gross Domestic Product
- US Bureau of Economic Analysis, release schedule
- US Census Bureau, Advance Durable Goods (M3) release schedule
- US Energy Information Administration, Weekly Petroleum Status Report
- US Department of the Treasury, auction schedule and results
- AlgoIndex performance methodology



