
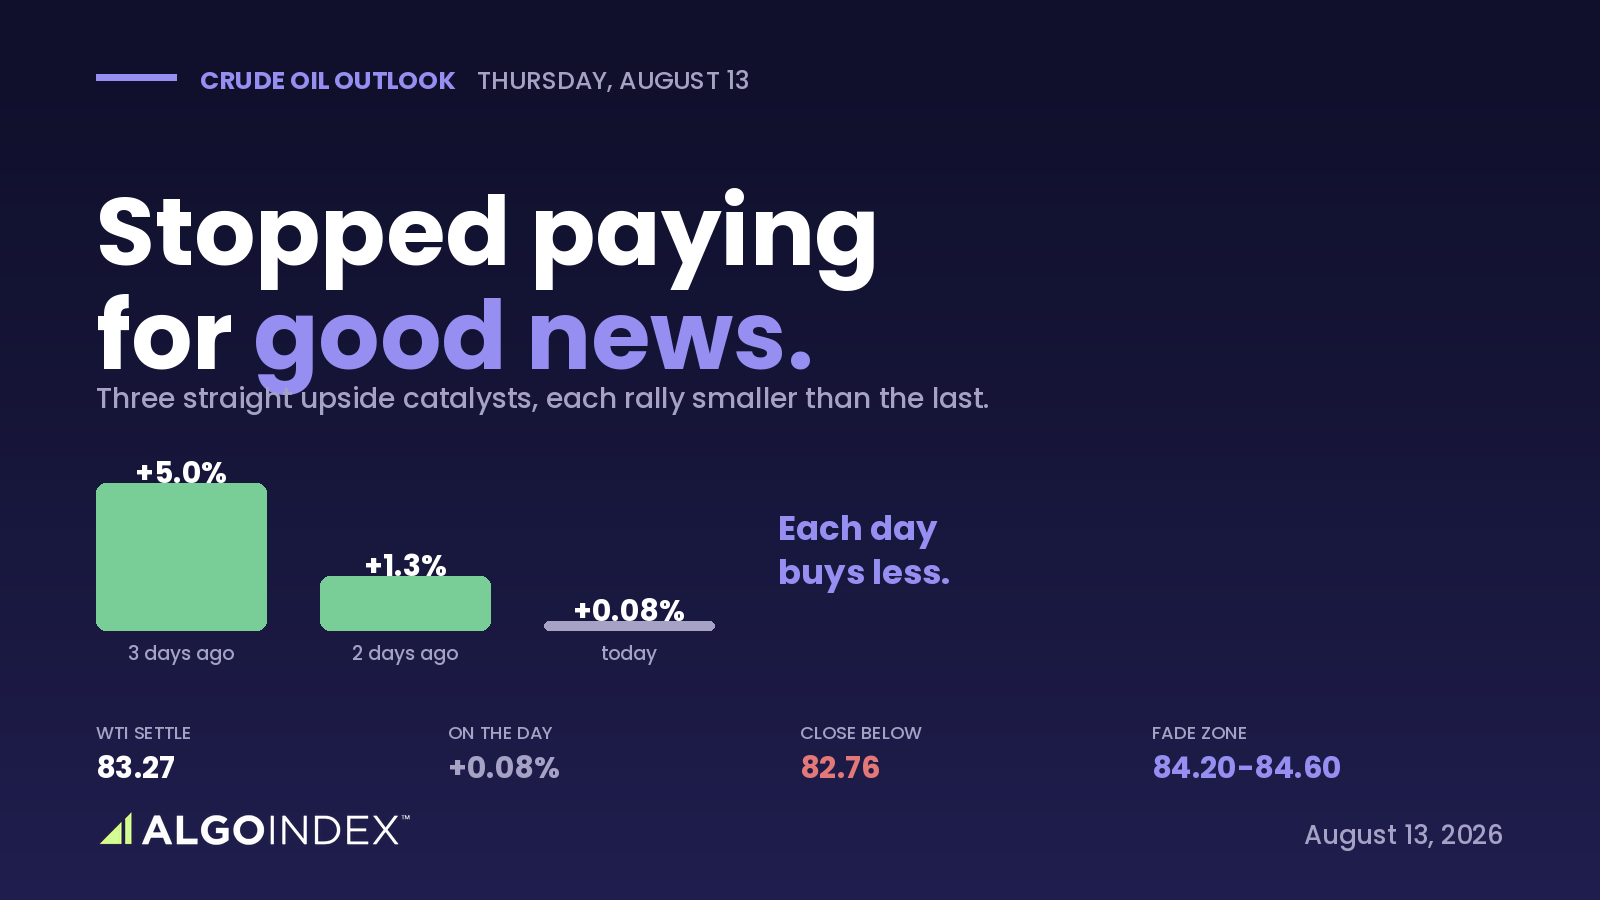
Wednesday handed crude oil the most bullish supply news of the entire episode, and the market closed up seven cents. An international energy agency said the global deficit will worsen and inventories will draw twice as fast as previously estimated. The Strait of Hormuz was reconfirmed shut, with no reopening until Iran's conditions are met. A US energy assessment put 600,000 barrels a day offline through 2027. Against all of that, September WTI settled at 83.27, a gain of 0.08 percent, and then traded lower after the bell.
That's the whole story, and the daily sequence makes it unmistakable. Monday the contract rose 5.05 percent, Tuesday 1.30, Wednesday 0.08. Each successive day of the advance has bought less, on progressively more bullish news. Wednesday printed an inside day with a lower high, then the electronic session sold it 51 cents below the settle. When a market stops paying for good news, that's the information, not the headline. The supply backdrop is close to as bullish as a crude trader could construct, and the market has stopped responding to it.
The tell in the split
There is a genuine bearish datapoint underneath the bullish headlines, and it explains the fade. The weekly inventory report showed US crude stocks building sharply against a forecast draw. That looks like a contradiction with a blocked strait until you read the split: crude is building because seaborne export channels are impaired and barrels cannot leave, while refined products are drawing hard, with gasoline and diesel cracks at extraordinary levels. The scarcity is downstream of the barrel, not in it. The Brent to WTI spread at 5.71 confirms it, pricing the disruption premium into waterborne cargoes while the domestic balance loosens.
The cross-asset read seals it. Equities made records on the in-line inflation print and volatility fell nearly 5 percent, a clean risk-on session, and crude did not join. When a market fails to rally on both its own bullish supply news and a supportive risk backdrop on the same day, the failure is the signal.
A backward-looking uptrend
The directional readings still say up, and it's worth being precise about why that does not settle the question. The directional index accelerates on every shortening window with positive direction leading throughout, which is genuinely bullish, but it measures the last several sessions, and those contained a 5 percent day. It is a backward-looking confirmation of a move that has already happened. Set against it are the inside day, the lower high, the decelerating gains and the post-settle selling, all of which describe the most recent 24 hours. When a trend measure and the freshest price action disagree, the fresher evidence usually resolves first. Price sits above all five averages, but the stack has not repaired its order, with the 5-day still below the 20-day, the fingerprint of a fast recovery rather than a mature trend.
Fade the shelf, name the gap risk
The trade sells the 84.20 to 84.60 shelf, where six references stack inside 47 cents and the market has now been rejected twice, on a failed retest rather than into accelerating strength, with a stop above 85.45 and targets at the 83.34 pivot, then the 82.33 base where Wednesday's low and the 20-day average sit, then 81.39. The asymmetry sets the conviction and it is the reason size stays modest: escalation is the higher-probability headline but each one has moved price less, while a confirmed strait reopening is the lower-probability headline that would gap this contract several dollars lower and through any stop. Higher frequency on the upside, larger magnitude on the downside, which argues for trading from the short side into strength rather than chasing longs into headlines. Thursday carries no energy-specific data, so this is a strait-and-structure session. How we grade a fade like this is in our performance methodology.
The supply news was as bullish as a crude trader could build, and the market closed up seven cents. When a market stops paying for good news, listen.
Three days of bullish supply news bought a seven-cent gain, and the third day gave it back after the bell.
This is the read our members get every session, before the bell, with the levels drawn and the setup defined. See how the same dealer-positioning work turns into systematic signals.
View pricingThe complete data picture
Every number behind Wednesday’s plan, charted first; the full numeric reference follows underneath.
Full numeric reference , every remaining figure from the review
| Average | Value | Spot vs 82.76 |
|---|---|---|
| 5-day | 81.90 | above by 0.86 |
| 20-day | 82.48 | sitting on it |
| 50-day | 78.82 | above by 3.94 (below 100-day) |
| 100-day | 81.50 | above by 1.26 |
| 200-day | 71.84 | above by 10.92 |
| Zone | Detail |
|---|---|
| about 84 | 33% of profile, upper shelf |
| 81.5-82.0 | 28% of profile, lower shelf |
| middle | thin (8/16/15% nodes), travels fast |
| 74.23 | one-month low |
| 67.12 | 13-week low, structural |
| Sept expiry | Aug 20, roll thinning liquidity |
| Item | Reading |
|---|---|
| Gasoline crack | about 49.19 per barrel |
| Diesel crack | about 97.50 per barrel (Russian refinery strikes) |
| Brent-WTI spread | 5.71 (seaborne risk) |
| US inventory | sharp build vs draw forecast |
| IEA | Q3 deficit worsening, draws twice prior estimate |
| EIA | 600k bpd offline through 2027 |
| Window | ATR | ATR % |
|---|---|---|
| 9-day | 3.70 | 4.44% |
| 14-day | 3.88 | 4.69% |
| 20-day | 3.93 | 4.72% |
| 50-day | 3.76 | 4.52% |
| 100-day | 3.18 | 3.82% |
| Input | |
|---|---|
| Hormuz | shut; will not reopen until conditions met |
| Dollar index | 99.996, flat (pure supply repricing) |
| Equities | records on in-line CPI; crude did not join |
| CPI | on forecast |
| Positioning | COT stale; treat as unknown |
| Reopening risk | a deal = several-dollar gap lower |
| When | Event |
|---|---|
| Thu | NO energy-specific data (strait + structure only) |
| Thu 08:30 | US PPI (indirect, via the dollar) |
| Thu 13:00 | 30-year bond auction |
| Fri 08:30 | US retail sales |
| Aug 19 | next crude inventories |
| Aug 20 | September contract expiry |



