
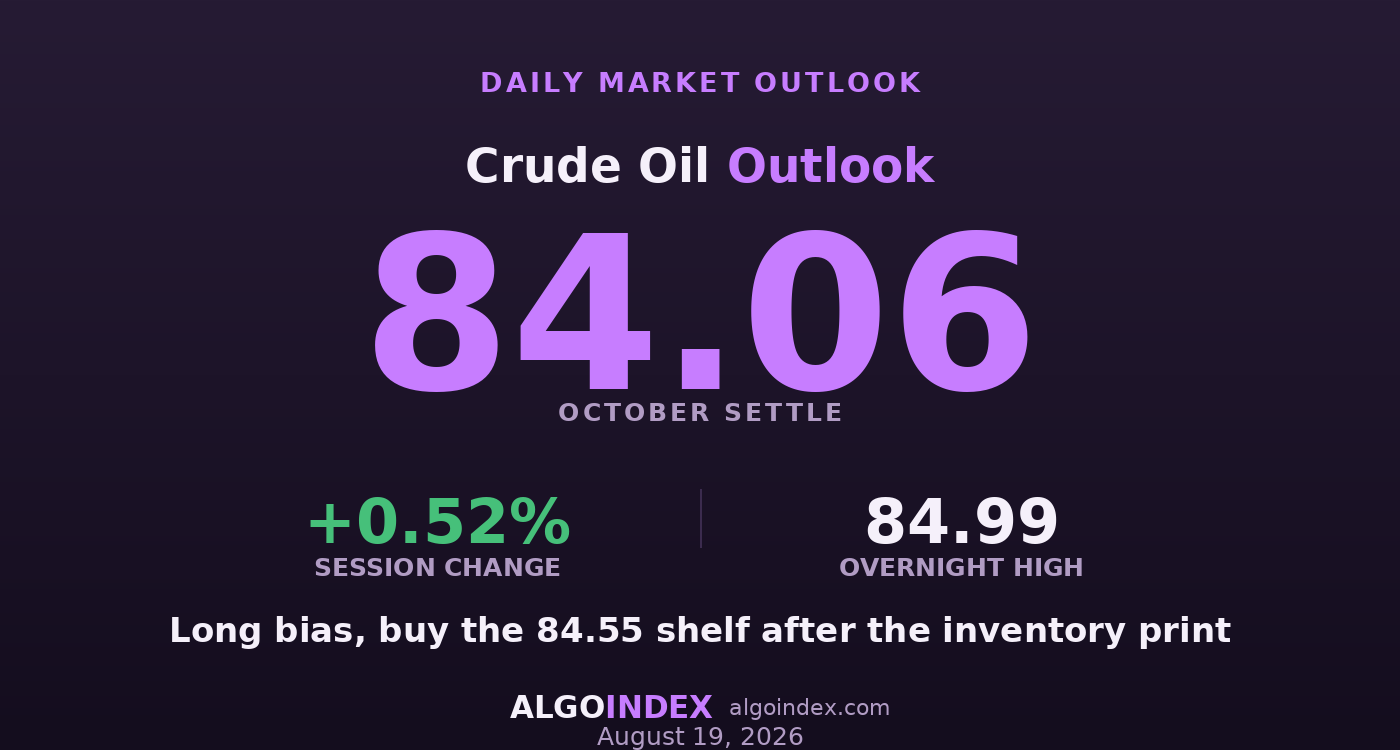
Crude settled Tuesday at 84.06 on the October contract, a three-week high, but the settle understates what happened. The session's most consequential news landed after the 2:30 settle was struck, and the electronic market spent the evening repricing it. By a quarter past nine the contract traded at 84.97, a full 91 cents above the official settle. The settle and the market's actual verdict have separated, and the separation points up.
The driver is singular and it isn't subtle. The Strait of Hormuz remains closed, and Tuesday brought a steady accumulation of evidence that it stays closed longer than the market assumed: a vessel struck leaving the strait, a tanker detained with transit fees imposed, and by late afternoon a halt to all trade between the UAE and Iran. A separate pipeline explosion in Syria halted pumping. This is a supply story that got worse during and after the session, and the overnight bid reflects it.
Strong structure, spent momentum, thin support
The structure is genuinely strong. Price sits above every major moving average, the prior week's high has been taken out, trend strength is accelerating on every shorter window with the positive directional line well ahead of the negative, and the composite has improved to a 72 percent buy from 56 a month ago. The forward curve, the refining margins and the geographic differential all confirm real physical tightness rather than a paper move.
Two cautions sit against that. The nine and fourteen-day stochastics are pinned near 99, about as stretched as short-term momentum gets, and directly beneath the market is a genuine volume vacuum. Price ran from roughly 82.30 to 84.20 on Monday without building acceptance, so there's very little transacted business to catch a decline through that pocket. Strong structure, exhausted momentum and thin support, handed a scheduled inventory print at 10:30. That's the whole setup.
The number gates the trade
The plan doesn't front-run the report. A number at or better than forecast, or a headline dominated by the distillate drawdown, confirms the tightness the curve already shows and clears the path to the 85.15 to 85.28 grouping and then 85.60. A build materially above forecast breaks the premise, and the vacuum beneath means the first move down will be fast and poorly priced. Crude carries no listed options surface to lean on, so the read comes from the physical complex: steep backwardation, a Brent premium of five to six dollars, and expanding cracks, all pointing the same way.
Buy the pullback after the print
The plan buys the 84.55 to 84.85 shelf, a secondary volume node holding roughly 23 percent of recent business, entered only after the 10:30 release removes the event risk and only on a pullback rather than a chase. The stop is 84.10, below the 84.30 pivot and the 84.36 overnight low, so losing that tight band means the premise failed and the vacuum makes hesitation expensive, about 60 cents of risk from the middle of the zone. Targets run to the 85.60 pivot, then 86.13, then the 86.73 exhaustion edge. A build well above forecast, or any credible Hormuz reopening headline, voids the long at any price, which is why size stays below normal. performance methodology sets out how we grade the result.
The settle said continuation; the overnight bid, printing a dollar higher, said the market read the escalation and moved. The trade is the pullback after the inventory number, not the chase into a momentum reading already pinned at 99.
Strong structure with a thin base beneath it and a scheduled catalyst on top is a trade to wait for, not to force. Buy the shelf after the print, with the stop that keeps the thesis intact.
This is the read our members get every session, before the bell, with the levels drawn and the setup defined. See how the same dealer-positioning work turns into systematic signals.
View pricingThe complete data picture
Every number behind Wednesday’s plan, charted first; the full numeric reference follows underneath.
Full numeric reference, every remaining figure from the review
| Average | Value | Settle vs |
|---|---|---|
| 5-day | 82.93 | spot above by 1.97 |
| 20-day | 80.67 | above by 4.23 |
| 50-day | 77.27 | above by 7.63 |
| 100-day | 79.65 | above by 5.25 |
| 200-day | 71.09 | above by 13.81 |
| Year-to-date | 74.50 | above by 10.40 |
| Level | Reference |
|---|---|
| 88.07 | one-month high |
| 87.33 | three-SD, exhaustion top |
| 86.73 | two-SD resistance, target 3 |
| 86.13 | third pivot resistance, target 2 |
| 85.60 | second pivot resistance, target 1 |
| 85.15 to 85.28 | eighteen-day stall and projected target |
| 84.97 | overnight high |
| 84.55 to 84.85 | entry shelf, 23% volume node |
| 84.30 to 84.36 | pivot and overnight low, invalidation |
| 84.06 | October settle |
| 83.53 | first pivot support |
| 82.17 to 82.35 | three-way confluence, Monday base |
| 73.10 | one-month low, recovery base |
| Metric | Reading |
|---|---|
| Term structure | backwardation, October 84.06 vs December 80.83 |
| Brent-WTI differential | five to six dollars, Brent above 90 |
| Gasoline crack | expanded, gasoline +0.97% vs crude +0.52% |
| Distillate stocks | drew further, product picture tightening |
| October open interest | 272,126, 5-day volume 133,608 |
| Listed options surface | not available for crude |
| Cohort | Weekly change |
|---|---|
| Commercials | net short 129,637; shorts -14,319 |
| Non-commercials | net long 99,196; shorts +19,252 |
| Managed money | net long 79,916; shorts +8,078 |
| Swap dealers | net short 468,834; shorts -18,146 |
| Producers | net long 339,197; longs +15,715 |
| Input | |
|---|---|
| Non-farm payrolls | minus 23,000 vs plus 80,000 forecast |
| Retail sales | minus 0.6% vs plus 0.1% forecast |
| Core CPI | 0.2% monthly, in line |
| Housing starts | 1.239M vs 1.345M forecast |
| Prior crude inventories | build of 17.423M barrels |
| Dollar index | 99.689, up 0.04% |
| 30-year yield | 5.32%, up 25 bp since Jul 29 |
| When | Event |
|---|---|
| Wed Aug 19 | crude inventories 10:30, 20-yr auction 13:00, policy minutes 14:00 |
| Thu Aug 20 | jobless claims, Philadelphia survey, September expiry |
| Fri Aug 21 | UK retail sales, light session |
The economic releases referenced above are published on the official government calendars below. Price levels are derived from standard technical and statistical methods, and the market read is AlgoIndex's own analysis. How we grade these calls is set out in our performance methodology.
- US Census Bureau, New Residential Construction (housing starts and building permits)
- US Bureau of Labor Statistics, Import and Export Price Indexes
- Federal Reserve, Industrial Production and Capacity Utilization (G.17)
- Federal Reserve, FOMC calendar and meeting minutes
- US Department of the Treasury, auction schedule and results
- AlgoIndex performance methodology



