
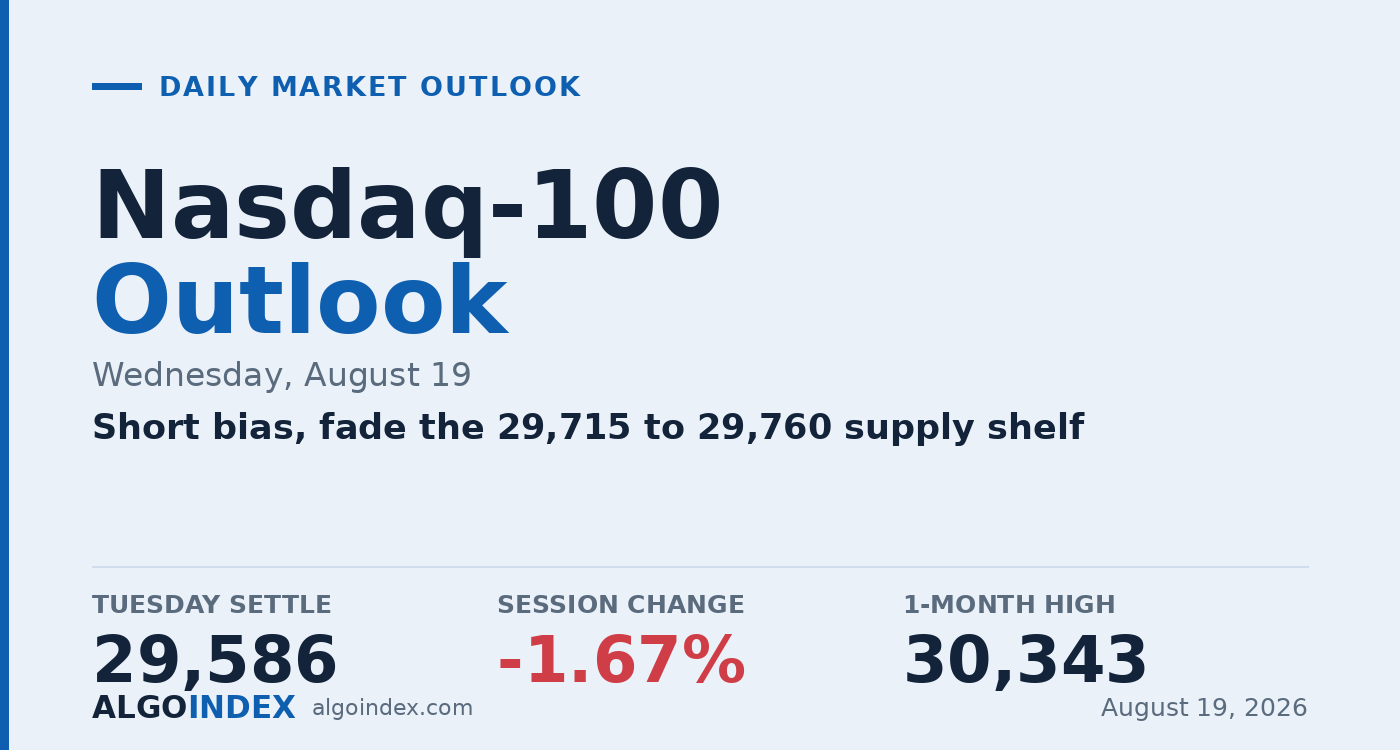
The Nasdaq 100 fell 1.67 percent on Tuesday to settle at 29,586, and the dispersion is the story. The S&P lost only 0.69 percent and the Dow 0.22, while the semiconductor group dropped about 5 percent in a single session. That isn't a broad withdrawal from equity risk. It's a positioning event inside one crowded theme, and reading it as anything wider will start Wednesday from the wrong place.
The mechanism was rates, not earnings. Crude pushed to a three-week high with Brent above 90, the resulting inflation impulse drove long-dated sovereign yields to multi-decade highs, and the most long-duration major index in the world repriced the multiple on future technology cash flows. The sequence ran from Middle East supply risk to crude to global term premium to the tech multiple. Layer the chart on top of that chain, not the other way around.
Constructive above, broken below
The contradiction into Wednesday is clean. On the intermediate and long horizons the market is still constructive: price holds above its 20, 100 and 200-day averages, the medium-term composite reads a 75 percent buy, and the contract is up nearly 21 percent on the year. That's a trend that has corrected, not one that has reversed.
On the short horizon the structure broke. Price is below the five-day and sitting on the fifty-day, the short-term composite reads a 40 percent sell, and the nine-day stochastic has collapsed to 8.49. More important, dealer positioning flipped during the session. The index closed below both its lower gamma concentration near 29,600 and its inflection near 29,640, having been rejected at 30,200 the day before. Below those marks, hedging amplifies direction rather than damping it.
A crowded short and a washed oscillator
Two things temper the conviction. The positioning desk notes that traders haven't yet hedged aggressively for more downside, so a positive gamma cushion is only partly spent, and the nine-day stochastic at 8.49 is washed out enough to fuel a reflex bounce before any continuation. Skew rank near 88 confirms downside protection is expensive, and speculative funds are already net short about 89,000 contracts. A crowded short into a washed oscillator is exactly the configuration that produces a violent counter-trend rally inside a continuing decline, which is why the plan fades a bounce and doesn't sell the low.
Fade the bounce, not the break
The plan sells a rally into the 29,715 to 29,760 confluence, the band where the translated positioning marks, the computed pivot and a stochastic threshold all land together, and it requires price to travel up to the zone rather than opening inside it. The stop is 29,845, above the confluence and beneath the nine-day crossover, so acceptance rather than a wick invalidates it, about 105 points from the 29,740 reference. Targets run to the 29,600 settle and flip, then 29,400, then the 29,175 confluence. A thirty-minute close above 29,845 closes the trade, and a cleanly absorbed 20-year auction breaks the oil-to-yields chain that's driving the whole move. performance methodology covers how we score it.
This was one theme selling, not the market, but it closed below the two marks that decide whether dealer hedging absorbs or amplifies. Below them the market runs, and the afternoon auction and minutes are the fuel.
The tilt is lower, but a crowded short into a washed-out oscillator squeezes hard. That's why the entry is up at the shelf and the stop sits above it.
This is the read our members get every session, before the bell, with the levels drawn and the setup defined. See how the same dealer-positioning work turns into systematic signals.
View pricingThe complete data picture
Every number behind Wednesday’s plan, charted first; the full numeric reference follows underneath.
Full numeric reference, every remaining figure from the review
| Average | Value | Settle vs |
|---|---|---|
| 5-day | 29,908.25 | below by about 322 |
| 20-day | 29,172.49 | above by about 414 |
| 50-day | 29,508.85 | sitting on it |
| 100-day | 28,733.72 | above by about 852 |
| 200-day | 27,237.46 | above by about 2,348 |
| Year-to-date | 27,551.24 | above |
| Level | Reference |
|---|---|
| 31,100.00 | 52-week high, Jun 3 |
| 30,343.00 | 1-month high, decline origin |
| 30,042 to 30,145 | second and third-SD resistance |
| 29,715 to 29,760 | primary fade band, four-way, desk pivot 29,740 |
| 29,586 to 29,611 | settle, gamma flip, 38.2% retracement |
| 29,442.00 | overnight low |
| 29,359 to 29,401 | first support confluence, three-way |
| 29,130 to 29,175 | five-way confluence, 20-day, deepest support |
| 27,201.50 | 1-month low, Jul 29 |
| Metric | Reading |
|---|---|
| Nasdaq dealer flow | minus 3 billion delta, call selling |
| Upper gamma concentration | 30,200 cash, rejected Monday |
| Volatility inflection | 29,640 cash, closed below |
| Lower gamma concentration | 29,600 cash, closed below |
| Dealer gamma flip line | 29,472 cash, near the settle |
| ETF put-to-call OI | 1.19, puts heavier |
| Implied-vol rank | 25.89 percent |
| Skew rank | 88.45 percent |
| Cohort | Weekly change |
|---|---|
| Leveraged funds | net short 89,125; shorts down 11,756 |
| Non-commercial | net short 39,302; shorts +12,477 |
| Asset managers | net long 61,665 |
| Commercial | net long 17,475 |
| Dealers | near flat, net long 2,897 |
| Input | |
|---|---|
| 10-year JGB yield | 2.967%, 30-year high |
| 10-year Bund yield | 3.272%, 15-year high |
| WTI crude | near 84 dollars, three-week high |
| Volatility index | 15.85, up 4% |
| Gold | below 4,400, no safe-haven bid |
| S&P 500 / Dow | down 0.69% / down 0.22% |
| When | Event |
|---|---|
| Wed Aug 19 | inventories 10:30, 20-yr auction 13:00, Fed minutes 14:00, vol expiration |
| Thu Aug 20 | jobless claims 08:30, Philadelphia survey, 30-yr TIPS 13:00 |
| Fri Aug 21 | flash PMIs, monthly options expiration |
| Tue Aug 26 | dominant chipmaker earnings |
| Aug 27-29 | central-bank symposium |
The economic releases referenced above are published on the official government calendars below. Price levels are derived from standard technical and statistical methods, and the market read is AlgoIndex's own analysis. How we grade these calls is set out in our performance methodology.
- US Census Bureau, New Residential Construction (housing starts and building permits)
- US Bureau of Labor Statistics, Import and Export Price Indexes
- Federal Reserve, Industrial Production and Capacity Utilization (G.17)
- Federal Reserve, FOMC calendar and meeting minutes
- US Department of the Treasury, auction schedule and results
- AlgoIndex performance methodology



