
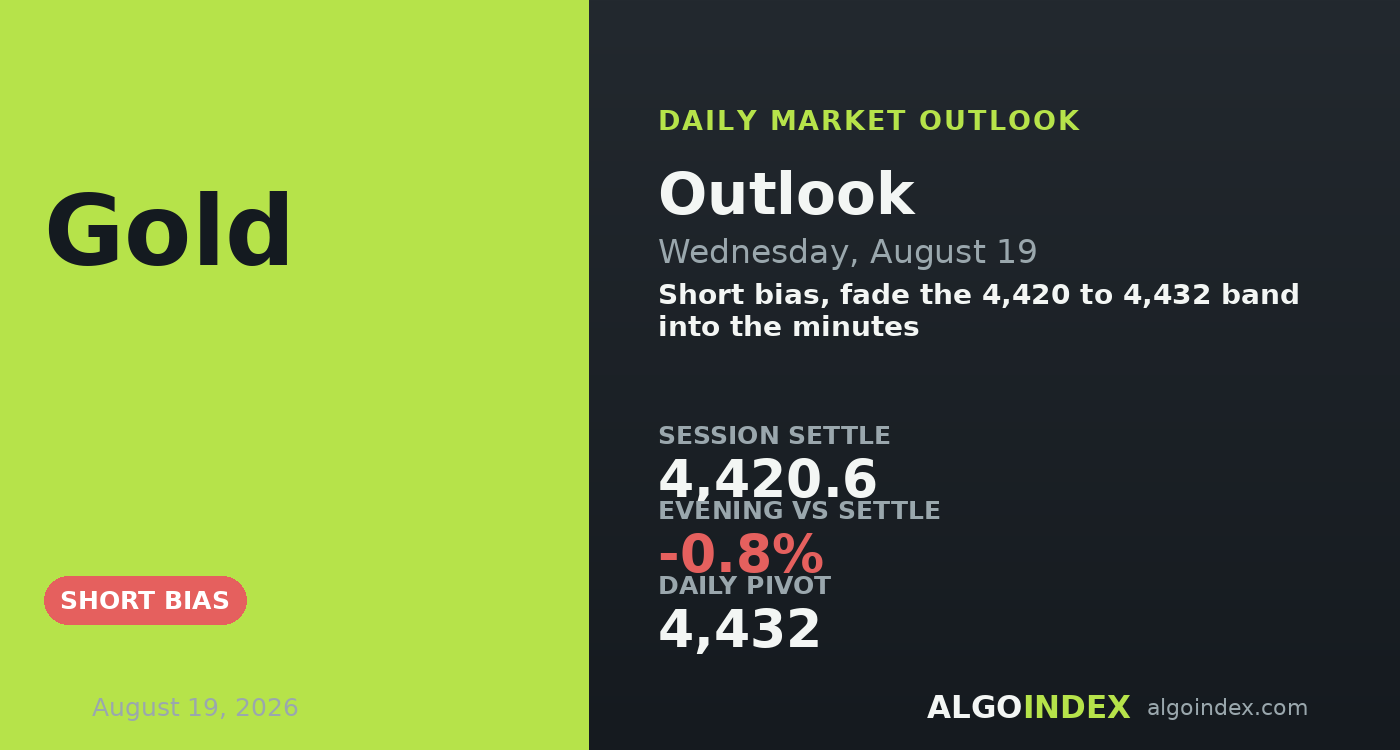
Gold closed Tuesday on the defensive, settling at 4,420.6 and then sliding into the evening toward the mid 4,380s, about 0.8 percent below the settle. The metal now sits under both the 4,432 daily pivot and the prior settle, which keeps the near-term burden of proof on buyers into Wednesday.
The driver is the bond market, not gold itself. Long-end yields have pushed sharply higher, with the 30-year running about 25 basis points above its late-July level, and the dollar has firmed off its recent lows. Rising real yields and a steadier dollar are the familiar headwind, and together they've capped the metal just beneath its early-August high near 4,485. Against that, soft labor data keeps the easing path alive and a tense geopolitical backdrop sustains a background bid, so this reads as a consolidation, not a top.
A strong run pausing under resistance
The intermediate trend is intact. Price holds well above its rising 20 and 50-day averages, and the multi-week advance off the summer base hasn't broken. Nothing about Tuesday's slide changes the larger picture; the metal is digesting a strong run rather than reversing it.
The short-term picture, though, has turned corrective. The intraday structure printed a lower high and a change of character, the faster stochastic has crossed down from 76 to 67, and dealer positioning now amplifies moves rather than damping them beneath the 396 proxy inflection. A market consolidating under resistance with hedging that feeds declines is one where a single scheduled event decides the next leg.
One event decides it
Everything funnels into the afternoon. A dovish set of minutes gives the uptrend room to reassert toward 4,432 and 4,481; a read that reinforces higher-for-longer, especially paired with a soft 20-year auction at one o'clock, opens the 4,354 to 4,322 shelf. The options proxy shows an implied-volatility percentile near the middle of its range and a skew in the upper third, so the market is paying for downside protection without pricing panic. That's a market braced for a single decisive event it can't yet handicap.
Fade the pivot, defer to the minutes
The plan sells a failed retest of the 4,420 to 4,432 band while the metal stays capped, with a structural stop above 4,449, roughly 23 points of risk from the middle of the zone. Targets run to the 4,379 session low, then the 4,354 half-way retracement, then the 4,322 projection. A reclaim of 4,449, or a dovish minutes reaction that closes the hour back above 4,432, voids the short outright. Because the release can restart the trend, the discipline is to stand aside into two o'clock and trade the reaction, not the anticipation. performance methodology explains how we grade both directions.
Gold is consolidating a strong advance directly under resistance, with hedging that now feeds declines and a long end that keeps lifting. The direction of the next leg isn't a chart question; it's a two o'clock question.
The setup is symmetric. A trend pausing under resistance is a fade at the ceiling and a buy on the dip, and which one wins is decided by the minutes, not the chart.
This is the read our members get every session, before the bell, with the levels drawn and the setup defined. See how the same dealer-positioning work turns into systematic signals.
View pricingThe complete data picture
Every number behind Wednesday’s plan, charted first; the full numeric reference follows underneath.
Full numeric reference, every remaining figure from the review
| Average | Value | Settle vs |
|---|---|---|
| 5-day | 4,429 | settle just below |
| 20-day | 4,278 | settle well above |
| 50-day | 4,226 | settle well above |
| 100-day | 4,483 | just below, immediate ceiling |
| 200-day | 4,624 | settle below |
| Year-to-date | 4,692 | below |
| Level | Reference |
|---|---|
| 4,509 | one-month high |
| 4,485 | early-August swing high |
| 4,483 | 100-day average, overhead ceiling |
| 4,461 to 4,471 | deviation resistance band |
| 4,449 | one-SD resistance, stop shelf |
| 4,432 | daily pivot, key line for Wednesday |
| 4,420.6 | prior settle |
| 4,398 to 4,405 | order-flow resistance band |
| 4,391.7 | 1.618 extension pivot |
| 4,379.6 | session low, two-SD support |
| 4,371.6 | first-support projection, key shelf |
| 4,354 | 50% retracement of range |
| 4,322 | second-support projection |
| 4,289 | 18-day average |
| Metric | Reading |
|---|---|
| Gold-ETF proxy last | about 397, down about 2% from 405 prior close |
| Net call gamma | about minus 380 million |
| Put gamma | about plus 98 million |
| Volatility inflection | about 396 proxy, accelerant beneath spot |
| Amplify-to-dampen transition | about 422 to 425 proxy |
| Put-to-call OI ratio | about 0.46, call-heavy |
| Heaviest dealer expiry | September monthly |
| Skew percentile | about 60 |
| Input | |
|---|---|
| 30-year Treasury yield | about 25 bp above the late-July level |
| Dollar index | firmer toward 99.6 |
| Payrolls | negative headline, a contraction |
| Retail sales | missed to the downside |
| Core CPI | in line with forecast |
| S&P 500 cash | eased about 0.7% |
| Nasdaq-100 cash | eased about 1.7% |
| Volatility index | firmed about 4% toward 15.9 |
| When | Event |
|---|---|
| Wed 02:00 ET | UK CPI, PPI, services inflation |
| Wed 10:30 ET | US crude oil inventories |
| Wed 13:00 ET | US 20-year bond auction |
| Wed 14:00 ET | US policy-meeting minutes, decisive catalyst |
| Thu 08:30 ET | jobless claims, regional manufacturing |
| Fri | global flash purchasing-manager surveys |
The economic releases referenced above are published on the official government calendars below. Price levels are derived from standard technical and statistical methods, and the market read is AlgoIndex's own analysis. How we grade these calls is set out in our performance methodology.
- US Census Bureau, New Residential Construction (housing starts and building permits)
- US Bureau of Labor Statistics, Import and Export Price Indexes
- Federal Reserve, Industrial Production and Capacity Utilization (G.17)
- Federal Reserve, FOMC calendar and meeting minutes
- US Department of the Treasury, auction schedule and results
- AlgoIndex performance methodology



