Wednesday's outlook planned to sell January crude into 85.90 to 86.20. The contract never got there. Its session high, 84.77, printed in the first 30-minute bar after Tuesday's 6:00 PM ET reopen, 1.13 beneath the bottom of the band, so the card never triggered and carries no result.
Crude fell instead. January settled at 82.31 on Wednesday, down 2.34 or 2.76 percent, after a 3.57 point range from 84.77 to 81.20. That is the lowest settle since 09/03/26 and the third straight session with a lower high and a lower low.
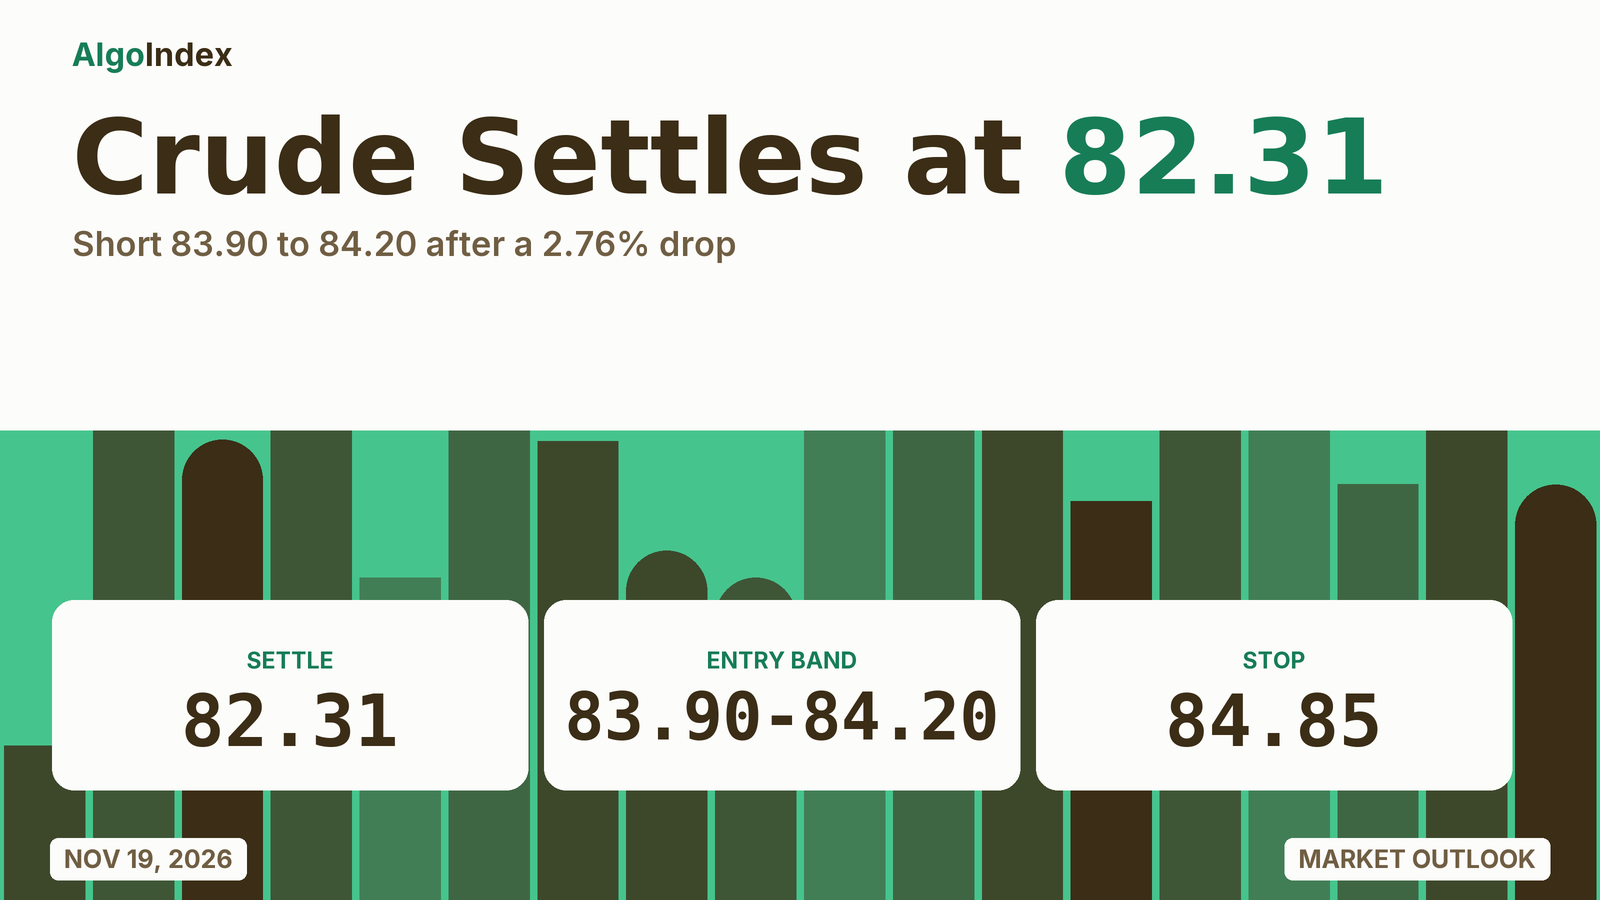
Thursday's plan keeps selling rebounds, now from a lower shelf: a short from 83.90 to 84.20, beneath Pivot R1 at 84.32, with the stop at 84.85 above Wednesday's high. US jobless claims and the Philadelphia Fed survey at 8:30 AM ET are the first scheduled inputs.
AT A GLANCE
- January settle 82.31, down 2.34 or 2.76 percent; range 84.77 to 81.20; lowest settle since 09/03/26.
- Thursday's setup: short 83.90 to 84.20, stop 84.85, objectives 83.20, 82.50 and an extended 81.60.
- Thesis negated on a settle above Wednesday's 84.77 high; two consecutive 30-minute closes above 84.20 remove the edge.
- The contract reopened at 81.85 at 6:00 PM ET, 0.46 beneath the settle.
- Calendar: jobless claims and Philadelphia Fed 8:30 AM ET, quarterly services report 10:00 AM ET, settlement 2:30 PM ET.
How Wednesday traded: the high came first, the low at midday
The session high of 84.77 printed in the 6:00 PM ET bar on Tuesday evening. Prices then slid through the Asian and European hours to 82.38 in the 3:30 AM ET bar, and a recovery carried the 7:00 AM ET bar to 84.39. It did not hold. The 9:30 AM ET bar fell 0.89, from 84.06 to 83.17.
The weekly petroleum status report at 10:30 AM ET showed a crude build of 3.380 million barrels against a forecast draw of 0.018 million, after a 4.657 million barrel build the week before, figures per the news-feed calendar. The 10:30 AM ET bar traded between 83.36 and 82.90 and closed 0.23 lower at 83.06.
The heavier selling came an hour later. The 11:30 AM ET bar dropped 1.12, from 82.70 to 81.58, the largest decline of any bar, and the 81.20 low printed in the 12:00 PM ET bar. No time-stamped crude headline sits inside that 11:30 AM ET bar, so we do not pin the move on a single item.
Buyers clawed some of it back. The 1:00 PM ET bar gained 0.46 to 81.95, alongside the 1:21 PM ET remark by the US defense secretary that an oil deal makes the Strait of Hormuz a non-factor. The 2:00 PM ET bar, which spans the FOMC minutes, added 0.44 to 82.34 before the 82.31 settle.
A second build, a firm dollar and a pipeline restart
Published market commentary tied the decline to three things: Iraq's restart of the Kirkuk to Ceyhan pipeline after a 12-year halt, at an initial 120,000 barrels a day; the inventory build, with US output at another record; and a dollar index at a 19-month high. That is attributed commentary.
The dollar index closed at 103.86, up 0.37, while the ten-year yield index eased to 5.07 from 5.10. A news-feed headline at 2:00 PM ET said a couple of FOMC participants saw a December hike of more than 25 basis points as possibly warranted, and Minneapolis Fed President Kashkari said at 4:27 PM ET that the Fed is clearly missing on the inflation side of its mandate. In our reading the firmer dollar and that hawkish tilt weighed on the whole commodity complex: gold's December contract fell 3.17 percent and silver's 4.85 percent.
Products fell too. December diesel settled at 3.9723 dollars a gallon and December gasoline at 2.4819, with gasoline at an 8.5-month low per published commentary. Against the December WTI settle of 83.26, the diesel margin stands at 83.58 dollars a barrel and the gasoline margin at 20.98.
After the settle, Iranian state media reported at 3:06 PM ET that three tankers caught fire after hitting sea mines east of the Strait of Hormuz, and at 3:09 PM ET Yemen's Houthis claimed strikes on targets in Riyadh. The 30-minute series shows no lift from either: the 3:00 PM ET bar closed 0.16 lower, and the contract reopened at 81.85, 0.46 beneath the settle.
The spreads moved too. December's premium over January narrowed to 0.95 from 1.36, and Brent's January premium over January WTI widened to 9.64 from 8.49 as Brent settled at 91.95.
The trade map for Thursday
The setup sells a rebound into 83.90 to 84.20, beneath Pivot R1 at 84.32 and one standard deviation resistance at 84.53. The stop at 84.85 sits above Wednesday's 84.77 high.
Objectives step down through known references: 83.20, above the Pivot Point at 82.76; 82.50, above Wednesday's 82.31 settle; and an extended 81.60, above the 81.20 low. From the 84.05 midpoint of the band, risk is 0.80 and the objectives sit 0.85, 1.55 and 2.45 away, about 1:1, 1:2 and 1:3.
The decline is stretched. The 9-day relative strength reads 29.40 and the 14-day raw stochastic 5.09 percent, which in our judgment makes a test of Pivot S1 at 80.75 more likely than a run to Pivot S2 at 79.19. Gulf tanker reports or a sharp reversal lower in the dollar can carry price through the stop in one move, so the setup is an analyst judgment that rebounds are sold rather than a measured edge.
| Item | Detail |
|---|---|
| Direction | Short |
| Contract | January WTI (CLF27), the front contract; the provider lists 12/21/26 as its expiration and 12/23/26 as its first notice date |
| Entry zone | 83.90 to 84.20 |
| Stop | 84.85, above Wednesday's 84.77 session high |
| Objective 1 | 83.20, above the Pivot Point at 82.76 |
| Objective 2 | 82.50, beneath the Pivot Point at 82.76 and above Wednesday's 82.31 settle |
| Objective 3 (extended) | 81.60, above Wednesday's 81.20 session low |
| Risk from band midpoint | 0.80; reward 0.85, 1.55 and 2.45, about 1:1, 1:2 and 1:3 |
| Invalidation | A settle above Wednesday's 84.77 high negates the thesis. Short of that, the edge is removed by acceptance above the entry band rather than by a touch, defined as two consecutive 30-minute closes above 84.20. |
| What could change it | Confirmed damage to Gulf tanker traffic or production, a sharp reversal lower in the dollar, or a constructive outcome from the leaders' meeting that lifts risk assets would lift the contract. In that scenario a move through the 84.85 stop invalidates the short before the objectives, and two standard deviation resistance at 85.45 becomes the reference, 0.60 beyond the stop and inside one 14-day average true range of 3.78. |
How Thursday could unfold
Night Session (6:00 PM ET Wednesday to 3:00 AM ET Thursday, Globex/Asia)
Globex reopened at 6:00 PM ET on Wednesday with the January contract at 81.85, 0.46 beneath the settle. Australian employment figures are listed for 7:30 PM ET on Wednesday by the news-feed calendar, unconfirmed. In our judgment the overnight session is likely to trade around the band from Pivot S1 at 80.75 to the Pivot Point at 82.76, with further Gulf reports the main source of a move outside it; expected band roughly 80.90 to 82.90.
London Session (3:00 AM to 8:00 AM ET Thursday)
Remarks by Bank of England policymaker Dhingra are listed for 7:15 AM ET on Thursday by the news-feed calendar, unconfirmed. Bias lower beneath the Pivot Point at 82.76, expected band roughly 80.90 to 83.10, with the dollar's direction and Gulf reports the main inputs ahead of the US data.
Morning Session (9:00 AM to 12:00 PM ET Thursday, US Open / Pit Session)
US jobless claims and the Philadelphia Fed survey are listed for 8:30 AM ET on Thursday by the news-feed calendar, unconfirmed, and the cash open at 9:30 AM ET sets the first directional test for the related markets. The advance quarterly services report is scheduled for 10:00 AM ET on Thursday, November 19, 2026, per the verified forward calendar. A rebound into the 83.90 to 84.20 band beneath Pivot R1 at 84.32 is the test the setup needs; expected band roughly 81.20 to 84.30.
Afternoon Session (12:00 PM to 2:30 PM ET Thursday, NYMEX Pit Close)
Remarks by Chicago Fed President Goolsbee are listed for 12:30 PM ET on Thursday, a 10-year inflation-protected note auction for 1:00 PM ET and remarks by Fed Governor Barr for 2:15 PM ET, by the news-feed calendar, unconfirmed. Expected band roughly 80.80 to 83.80, with the Pivot Point at 82.76 the reference for the 2:30 PM ET settle.
Night Session Forward (6:00 PM ET Thursday)
Japanese consumer prices and remarks by Philadelphia Fed President Paulson are listed for 6:30 PM ET on Thursday by the news-feed calendar, unconfirmed. Monthly options expiration on Friday, November 20, 2026, appears on a published key-date list and is unconfirmed, and remarks by Fed Governor Waller are scheduled for 8:25 AM ET on Friday, November 20, 2026, per the verified forward calendar.
Our base case holds beneath the Pivot Point at 82.76 overnight, attempts a rebound toward 83.90 to 84.20 after the 8:30 AM ET data, fails beneath Pivot R1 at 84.32 and trades back toward the 81.20 low. A settle above 84.77 would bring the 85.28 5-day average and two standard deviation resistance at 85.45 back into play. On the other side, a break of the 80.72 to 80.86 band without a rebound could carry the contract toward one standard deviation support at 80.09 before the setup triggers.
The complete data picture
Every level, average, oscillator and range figure from Wednesday's review, charted first and then listed in full.
| Time (Thursday) | Event |
|---|---|
| 8:30 AM ET | US jobless claims (consensus 198,000) and Philadelphia Fed survey (consensus 20.55), news-feed calendar, unconfirmed |
| 9:30 AM ET | Cash open; an initial public offering by an AI developer is listed as tentative, unconfirmed |
| 10:00 AM ET | Advance quarterly services report, verified forward calendar |
| 12:30 PM ET | Chicago Fed President Goolsbee, unconfirmed |
| 1:00 PM ET | 10-year inflation-protected note auction, unconfirmed |
| 2:15 PM ET | Fed Governor Barr, unconfirmed |
| 2:30 PM ET | NYMEX crude settlement |
| 6:30 PM ET | Japanese consumer prices and Philadelphia Fed President Paulson, unconfirmed |
| Thursday, no time | Meeting of the US, Chinese and Russian leaders, on a published key-date list, unconfirmed |
| Friday 8:25 AM ET | Fed Governor Waller, verified forward calendar; monthly options expiration Friday, unconfirmed |
Full numeric reference: every figure from Wednesday's review
Executive Summary
The January crude contract settled at 82.31 on Wednesday, down 2.34 or 2.76 percent from Tuesday's settle of 84.65, after trading between 84.77 and 81.20, a 3.57 point daily range. The settle finished 1.11 above the low and 2.46 beneath the high, in the lower third of the range. Wednesday printed a lower high, 1.20 beneath Tuesday's 85.97, and a lower low, 2.21 beneath Tuesday's 83.41, the third consecutive session with both a lower high and a lower low, and the 3.57 point range was the widest since the 4.44 point range of 11/16/26.
The 82.31 settle is the lowest since the 81.93 settle of 09/03/26, and the 81.20 low is the lowest since the 80.71 low of 09/04/26; the provider publishes 81.20 as the one-month low. Over five sessions the January contract is down 3.12 from the 85.43 settle of 11/11/26, a decline of 3.65 percent. The settle now sits beneath the 5-day, 9-day, 20-day, 50-day and 100-day settlement averages and above only the 200-day, and it is the first settle beneath the 100-day average since 08/07/26.
The expiring December contract settled at 83.26, down 2.75 or 3.20 percent, and its premium over January narrowed to 0.95 from 1.36. The weekly petroleum status report at 10:30 AM ET showed a crude build of 3.380 million barrels against a forecast draw of 0.018 million, per the news-feed calendar. The provider's market commentary tied the decline to Iraq's restart of the Kirkuk to Ceyhan pipeline after a 12-year halt, to the unexpected inventory build with US output at a record, and to a dollar index at a 19-month high; that is attributed commentary and was not recomputed.
After the settle the news feed carried an Iranian state media report at 3:06 PM ET that three tankers caught fire after hitting sea mines east of the Strait of Hormuz, and at 3:09 PM ET a claim by Yemen's Houthis of strikes on targets in Riyadh. The 30-minute series shows no lift from those reports: the 3:00 PM ET bar closed 0.16 lower, and the January contract reopened at 81.85 at 6:00 PM ET, 0.46 beneath the settle, per the provider's record of the new session.
The composite multi-indicator read published on Wednesday evening is "48% SELL" with strength "Weak" and direction "Strengthening", against "24% SELL" a session earlier. The Primary Setup in section 8 is a short from the 83.90 to 84.20 band, beneath Pivot R1 at 84.32 and one standard deviation resistance at 84.53, stopped at 84.85, with objectives at 83.20, 82.50 and an extended 81.60. In this review's judgment US jobless claims and the Philadelphia Fed survey at 8:30 AM ET on Thursday, listed by the news-feed calendar and unconfirmed, are the first scheduled inputs for the related markets, while Gulf reports and the meeting of the US, Chinese and Russian leaders remain the main unscheduled inputs for crude.
Price Action & Technical Structure
2.1 Intraday and Session Review
The January contract opened Wednesday's session at 84.50 at the Tuesday 6:00 PM ET reopen, 0.15 beneath Tuesday's settle, traded between 84.77 and 81.20 and settled at 82.31 at 2:30 PM ET, per the provider's January settlement record. The chart's continuous series has carried the January contract since the roll at Tuesday's reopen; its completed Wednesday daily bar reads 84.50, 84.77, 81.20 and 82.31, equal to the provider's January row, and its prior bar closes at 84.65, equal to Tuesday's January settle.
On the 30-minute series the session high of 84.77 printed in the 6:00 PM ET bar on Tuesday evening, the first bar of the session. The contract then drifted lower through the Asian and European hours, reaching 82.38 in the 3:30 AM ET bar, before a recovery carried the 7:00 AM ET bar to a high of 84.39. The 8:00 AM ET bar traded across 0.88 and closed at 83.84, and the 9:30 AM ET bar fell 0.89, from 84.06 to 83.17.
The weekly petroleum status report was released at 10:30 AM ET on Wednesday, November 18, 2026, per the verified forward calendar, and the 10:30 AM ET bar traded between 83.36 and 82.90 and closed 0.23 lower at 83.06. The largest decline of any bar in the session came in the 11:30 AM ET bar, which fell 1.12 from 82.70 to 81.58, and the session low of 81.20 printed in the 12:00 PM ET bar. The captured news feed carries no time-stamped crude headline inside the 11:30 AM ET bar, so this review does not attribute that move to a single item.
The 1:00 PM ET bar gained 0.46 and closed at 81.95; it coincided with the news feed's 1:21 PM ET item in which the US defense secretary said an oil deal makes the Strait of Hormuz a non-factor. The 2:00 PM ET bar, which spans the FOMC minutes at 2:00 PM ET on Wednesday, November 18, 2026, per the verified forward calendar, gained 0.44 to 82.34, and the settlement followed at 82.31. After the settle the 3:00 PM ET bar, which spans the tanker and Riyadh reports, fell 0.16, and the 4:30 PM ET bar closed at 81.88.
Globex reopened at 6:00 PM ET, so the provider's January overview, read at 6:17 PM ET, already carries the new session dated Thursday, with an open of 81.85, a high of 82.07, a low of 81.85 and a previous close field of 82.31; those prices belong to Thursday's session, not to Wednesday's. The chart's header read 82.13, down 0.22 percent, which implies a prior close of 82.31 and matches the provider's previous close field.
Wednesday's completed-session high and low were recovered from the published pivot ladder with the outer pairs. Pivot R3 at 87.89 minus Pivot S3 at 77.18, divided by three, returns 3.57, and Pivot R2 at 86.33 minus Pivot S2 at 79.19, divided by two, returns the same 3.57. The published Pivot Point is 82.76. Three times that value, less the 82.31 settle, gives a high plus low sum of 165.97, which with the 3.57 range solves to a high of 84.77 and a low of 81.20. That pair, with the 82.31 settle, reproduces all seven published rungs. These are the completed-session inputs behind the published pivot ladder rather than an independently read bar, and the provider's January settlement row carries the same 84.77 high and 81.20 low; the provider's published one-month low of 81.20 is independent corroboration of the low.
2.2 Daily Structure
Wednesday printed a lower high and a lower low against Tuesday and settled 2.34 lower, 1.11 above the low and beneath the 82.99 midpoint of the range. Settlements over the last six sessions read 85.43, 87.69, 87.29, 84.47, 84.65 and 82.31, so Wednesday erased Tuesday's 0.18 gain and settled 2.16 beneath Monday's 84.47.
Highs over the last four sessions read 88.49 on 11/13/26, 88.21 on 11/16/26, 85.97 on 11/17/26 and 84.77 on Wednesday, three consecutive lower highs, and lows read 86.80, 83.77, 83.41 and 81.20, three consecutive lower lows. The provider publishes 103.01 as the 52-week, 13-week and one-month high, printed on 10/30/26, and 75.92 as the 13-week low. The settle sits 2.67 beneath the 84.98 level published as the 61.8 percent retracement from the 52-week low and 2.91 above the 79.40 level published as the 50 percent retracement of the 52-week range.
In this review's interpretation the third consecutive session of lower highs and lower lows, with a settle in the lower third of a range wider than Tuesday's, extends the decline from the 103.01 high of 10/30/26 rather than pausing it, while the reopen beneath the settle shows no immediate rebound.
2.3 4-Hour and Swing Structure
The 3.57 point range followed ranges of 1.69 on 11/13/26, 4.44 on 11/16/26 and 2.56 on 11/17/26. Daily ranges over the last ten sessions, from 11/05/26, ran 4.18, 3.24, 6.17, 2.98, 2.75, 4.06, 1.69, 4.44, 2.56 and 3.57.
The swing sequence since the 103.01 high of 10/30/26 shows a three-session recovery to 88.49 on 11/13/26 followed by three sessions of lower highs and lower lows. The 81.20 low undercut the 82.83 low of 11/10/26 that had stood as the one-month low, and the next published reference beneath it is the 80.86 projection for the 3-10 day average crossover stall, followed by the 80.72 target price and the 80.75 Pivot S1.
The published grid places the 9-day average crossing at 85.30, the 61.8 percent retracement at 84.98 and the 14 day stochastic stall at 86.39 above the settle, with the 3-10 day average crossover stall at 80.86 beneath it.
2.4 Moving Averages
The averages cited here were computed from the provider's daily settlement series for the January contract, which holds 259 completed sessions from 11/07/25 through Wednesday; the partial Thursday row of the reopened Globex session was excluded before counting, and each average is carried at full precision and rounded once to the cent. The 5-day average stands at 85.28, the 9-day at 85.78, the 20-day at 91.86, the 50-day at 90.57, the 100-day at 83.37 and the 200-day at 78.19.
The 82.31 settle sits 2.97 beneath the 5-day average, 3.47 beneath the 9-day, 9.55 beneath the 20-day, 8.26 beneath the 50-day and 1.06 beneath the 100-day, and 4.12 above the 200-day. It is the third consecutive settle beneath the 5-day average, the last settle above it on 11/13/26, the thirteenth consecutive settle beneath the 9-day and the 20-day averages, the last settle above both on 10/30/26, and the eleventh consecutive settle beneath the 50-day, the last settle above it on 11/03/26. The 5-day average fell from Tuesday's 85.91 and the 9-day from 86.54.
The 5-day average sits beneath the 9-day because the four older settlements in the 9-day window averaged higher, at 86.39. The 5-day sits beneath the 20-day because the 15 older settlements in the 20-day window averaged higher, at 94.05. The 20-day average sits above the 50-day because the 30 older settlements in the 50-day window averaged lower, at 89.71. The 50-day sits above the 100-day because the 50 older settlements in the 100-day window averaged lower, at 76.16, and the 100-day sits above the 200-day because the 100 older settlements in the 200-day window averaged lower, at 73.01.
2.5 Oscillator and Trend Readings
The oscillator figures below are as published on the provider's January technical page, read at 6:17 PM ET after the 6:00 PM ET reopen on a page titled for Thursday, so they may already reflect the live Globex price rather than Wednesday's settle; they are the provider's readings, not this review's computations. The 9-day relative strength reads 29.40, the 14-day relative strength 35.07 and the 20-day relative strength 39.54.
The 9-day raw stochastic reads 11.26 percent and the 14-day raw stochastic 5.09 percent, while the 14-day stochastic %K reads 7.41 percent and the 14-day stochastic %D 12.87 percent. The 9-day directional index ADX reads 42.88 with the 9-day +DI at 10.82 and the 9-day -DI at 33.90, and the 14-day directional index ADX reads 33.92 with the 14-day +DI at 13.03 and the 14-day -DI at 29.90, so negative direction leads on both systems. The 9-day historic volatility reads 32.63 percent and the 14-day historic volatility 52.48 percent.
The composite multi-indicator read published on Wednesday evening is "48% SELL", with signal strength "Weak" and direction "Strengthening". The snapshot history reads "24% SELL" for the prior session, "24% SELL" a week ago and "100% BUY" a month ago. The short horizon group averages "60% SELL", the medium group "50% SELL" and the long group "HOLD", and the trend composite reads "SELL".
2.6 Volatility and Expected Range
The published 14-day average true range stands at 3.78 points and the 14-day average daily range at 4.29 points; the 9-day average true range is 3.80 with a 9-day average daily range of 3.50, and the 20-day average true range is 3.67 with a 20-day average daily range of 3.93. Wednesday's 3.57 point range sat inside the 14-day average daily range.
Adding and subtracting the 14-day average true range of 3.78 from the 82.31 settle frames Thursday between 78.53 and 86.09. The published standard-deviation bands, built from five settlements, span 80.09 to 84.53 at one deviation, 79.17 to 85.45 at two and 78.46 to 86.16 at three. These bands describe dispersion, not intraday reach. In this review's judgment, with the captured calendars carrying no petroleum report for Thursday, the outlook points to a range nearer the 9-day average daily range of 3.50, with Gulf reports the main source of any expansion.
Key Levels
3.1 Resistance
Above the 82.31 settle, the first reference is the Pivot Point at 82.76, followed by the 83.17 close of the 9:30 AM ET bar on the 30-minute series. Pivot R1 at 84.32, one standard deviation resistance at 84.53 and Wednesday's 84.77 session high form the next band, with the 84.98 retracement and the 85.28 5-day average above it. The 9-day crossing projection at 85.30, two standard deviation resistance at 85.45 and the 9-day average at 85.78 follow, with three standard deviation resistance at 86.16 and Pivot R2 at 86.33 beyond them.
3.2 Support
Beneath the settle sit the 81.85 reopening print and the 81.20 session low, which the provider publishes as the one-month low. The 80.86 crossover stall, Pivot S1 at 80.75 and the 80.72 target price form the next band, followed by one standard deviation support at 80.09. The 79.40 retracement, Pivot S2 at 79.19 and two standard deviation support at 79.17 are the deeper references, with three standard deviation support at 78.46 and Pivot S3 at 77.18 beyond them.
Macro Drivers
4.1 OPEC and Supply Policy (Quotas, Compliance, Saudi/Russia Signals)
No producer-group statement was captured on Wednesday. The provider's market commentary said Iraq restarted crude flows through the pipeline linking the Kirkuk fields with the Turkish port of Ceyhan after a 12-year halt, at an initial rate of 120,000 barrels a day, and said signs of larger global supplies weighed on prices; that is attributed commentary and was not recomputed. A press report carried by the news feed at 5:01 PM ET said China is burning less oil and coal as the conflict involving Iran reshapes its energy mix.
4.2 EIA and API Inventory (Crude Stocks, Gasoline, Distillates, Cushing, SPR)
The weekly petroleum status report released at 10:30 AM ET on Wednesday, November 18, 2026, per the verified forward calendar, showed a crude build of 3.380 million barrels against a forecast draw of 0.018 million and a 4.657 million barrel build previously, figures per the news-feed calendar. The provider's commentary said US crude production rose to another record; that is attributed. The 10:30 AM ET bar on the 30-minute series closed 0.23 lower, and the larger decline came an hour later in the 11:30 AM ET bar.
In this review's interpretation a second weekly build, after Tuesday's industry estimate had also shown a build, leaves the inventory side without support for crude into next week's report.
4.3 Geopolitical Backdrop (Middle East, Iran, Russia/Ukraine, Venezuela)
At 12:35 PM ET the news feed carried a US military statement that no US personnel had been injured in any attempted Iranian attacks this week, and at 1:21 PM ET the US defense secretary said an oil deal makes the Strait of Hormuz a non-factor. At 2:18 PM ET Iranian press reports said Iran had held constructive talks with Oman. After the settle, at 3:06 PM ET and 3:07 PM ET, Iranian state media reported that three tankers caught fire after hitting sea mines east of the Strait of Hormuz, having ignored navy warnings, and at 3:09 PM ET Yemen's Houthis claimed strikes on King Khalid Airport and the financial center in Riyadh.
At 3:41 PM ET press reports said the US defense secretary walked out of NATO talks after admonishing Ukraine, and at 4:16 PM ET Iran said it had exercised maximum restraint in defensive strikes. At 6:01 PM ET a press report said Equinor, the largest supplier of pipeline gas to Europe, is fighting an ongoing cyberattack. These are reports carried by the feeds; the January contract reopened 0.46 beneath its settle, and the settlement record does not establish that any single item caused a particular move.
4.4 Demand and Refining (Refinery Utilization, Crack Spreads, Seasonal Pattern)
Diesel's December contract settled at 3.9723 dollars a gallon and gasoline's December contract at 2.4819, per the news feed, and the provider's commentary put the gasoline decline at 2.09 percent with gasoline at an 8.5-month low, which is attributed. Measured on the December contracts, the diesel margin over December WTI stands at 83.58 dollars a barrel and the gasoline margin at 20.98. Natural gas's December contract settled at 3.3720. US housing starts printed 1.309 million against a 1.25 million forecast and building permits 1.295 million against 1.375 million, figures per the news-feed calendar. In this review's interpretation the product declines kept pace with crude on Wednesday, so the selling was broad across the petroleum complex rather than specific to crude.
4.5 Dollar and Cross-Asset (DXY, Commodities Complex, Equity Risk-On/Off)
The dollar index's daily record closed at 103.86, up 0.37 from Tuesday's 103.49, and the provider's commentary described a 19-month high, which is attributed. The ten-year yield index closed at 5.07, down from 5.10 on Tuesday. Gold's December contract fell 3.17 percent and silver's December contract 4.85 percent, while the S&P 500 cash index fell 0.23 percent and the volatility index eased 0.90 points to 24.56.
The FOMC minutes at 2:00 PM ET showed, per a news-feed headline at that time, that a couple of participants said a December hike of more than 25 basis points may be warranted, and Minneapolis Fed President Kashkari said at 4:27 PM ET that the Fed is clearly missing on the inflation side of its mandate, per the news feed. In this review's interpretation a stronger dollar and a hawkish tilt in the minutes added pressure to the commodity complex, with crude's decline smaller in percentage terms than silver's and gold's.
4.6 Institutional Positioning (COT, Money Manager vs Commercial Hedger, Speculator Length)
The latest weekly positioning report on the provider's overview, for the week to Tuesday, November 10, 2026, shows managed money at 148,092 long, up 710, against 122,378 short, down 3,276, as listed and not recomputed. January volume was 243,420 contracts on Wednesday against 190,606 on Tuesday, per the settlement record. December's premium over January narrowed to 0.95 from 1.36 as December settled 2.75 lower at 83.26 and January 2.34 lower at 82.31, and Brent's January premium over January WTI widened to 9.64 from 8.49 as Brent's January contract settled at 91.95, down 1.19. The provider lists 12/21/26 as the January contract's expiration date and 12/23/26 as its first notice date.
Forecast
Night Session (6:00 PM ET Wednesday to 3:00 AM ET Thursday, Globex/Asia)
Globex reopened at 6:00 PM ET on Wednesday with the January contract at 81.85, 0.46 beneath the settle. Australian employment figures are listed for 7:30 PM ET on Wednesday by the news-feed calendar, unconfirmed. In this review's judgment the overnight session is likely to hold between Pivot S1 at 80.75 and the Pivot Point at 82.76, with further Gulf reports the main source of a move outside it; expected band roughly 80.90 to 82.90.
London Session (3:00 AM to 8:00 AM ET Thursday)
Remarks by Bank of England policymaker Dhingra are listed for 7:15 AM ET on Thursday by the news-feed calendar, unconfirmed. Bias lower beneath the Pivot Point at 82.76, expected band roughly 80.90 to 83.10, with the dollar's direction and Gulf reports the main inputs ahead of the US data.
Morning Session (9:00 AM to 12:00 PM ET Thursday, US Open / Pit Session)
US jobless claims and the Philadelphia Fed survey are listed for 8:30 AM ET on Thursday by the news-feed calendar, unconfirmed, and the cash open at 9:30 AM ET sets the first directional test for the related markets. The advance quarterly services report is scheduled for 10:00 AM ET on Thursday, November 19, 2026, per the verified forward calendar. A rebound into the 83.90 to 84.20 band beneath Pivot R1 at 84.32 is the test the setup needs; expected band roughly 81.20 to 84.30.
Afternoon Session (12:00 PM to 2:30 PM ET Thursday, NYMEX Pit Close)
Remarks by Chicago Fed President Goolsbee are listed for 12:30 PM ET on Thursday and a 10-year inflation-protected note auction for 1:00 PM ET on Thursday by the news-feed calendar, unconfirmed. Remarks by Fed Governor Barr are listed for 2:15 PM ET on Thursday by the news-feed calendar, unconfirmed. Expected band roughly 80.80 to 83.80, with the Pivot Point at 82.76 the reference for the settle at 2:30 PM ET.
Night Session Forward (6:00 PM ET Thursday)
Japanese consumer prices and remarks by Philadelphia Fed President Paulson are listed for 6:30 PM ET on Thursday by the news-feed calendar, unconfirmed. Monthly options expiration on Friday, November 20, 2026, appears on a published key-date list and is unconfirmed, and remarks by Fed Governor Waller are scheduled for 8:25 AM ET on Friday, November 20, 2026, per the verified forward calendar.
Expected Range (Thursday Full Session)
- Low-range scenario: 81.00 to 83.60
- Mid-range scenario (most likely): 80.40 to 84.30
- High-range scenario: 79.20 to 85.40
Most Likely Path
In this review's analyst judgment, the most probable path holds beneath the Pivot Point at 82.76 through the overnight hours, attempts a rebound toward the 83.90 to 84.20 band after the 8:30 AM ET data and fails beneath Pivot R1 at 84.32, then trades back toward the 81.20 low. Three consecutive lower highs and lower lows, the settle beneath every average but the 200-day, the composite at "48% SELL" with direction "Strengthening" and a second weekly crude build support that reading, while the 9-day relative strength of 29.40 and a 14-day raw stochastic of 5.09 percent argue that the decline is extended and that a test of Pivot S1 at 80.75 is more likely than a run to Pivot S2 at 79.19.
The alternative that would invalidate this reading is a settle above Wednesday's 84.77 high, which would bring the 85.28 5-day average and two standard deviation resistance at 85.45 back into play; confirmed damage to Gulf tanker traffic or infrastructure, or a reversal lower in the dollar, are the inputs most likely to drive that alternative. On the other side, a break of the 80.72 to 80.86 band without a rebound could carry the contract toward one standard deviation support at 80.09 before the setup triggers.
Thursday Economic Calendar
Wednesday's releases are complete. US housing starts and building permits were released at 8:30 AM ET on Wednesday, November 18, 2026, per the verified forward calendar, with starts at 1.309 million against a 1.25 million forecast and permits at 1.295 million against 1.375 million, figures per the news-feed calendar and unconfirmed. The weekly petroleum status report was released at 10:30 AM ET on Wednesday, November 18, 2026, per the verified forward calendar, with a crude build of 3.380 million barrels against a forecast draw of 0.018 million, figures per the news-feed calendar and unconfirmed.
Pending home sales fell 4.7 percent against a 2 percent decline forecast at 10:00 AM ET on Wednesday and the 20-year bond auction at 1:00 PM ET on Wednesday stopped at 5.459 percent with a bid-to-cover of 2.630, figures per the news-feed calendar and unconfirmed. The FOMC minutes were released at 2:00 PM ET on Wednesday, November 18, 2026, per the verified forward calendar, and remarks by Minneapolis Fed President Kashkari followed from 4:17 PM ET per the news feed, unconfirmed. December WTI settled at 2:30 PM ET at 83.26 and January at 82.31.
Thursday brings US jobless claims and the Philadelphia Fed survey at 8:30 AM ET on Thursday, listed by the news-feed calendar with consensus figures of 198,000 claims and a reading of 20.55, unconfirmed. The advance quarterly services report is scheduled for 10:00 AM ET on Thursday, November 19, 2026, per the verified forward calendar. An initial public offering by an AI developer is listed for 9:30 AM ET on Thursday by the news-feed calendar as tentative and unconfirmed.
Remarks by Chicago Fed President Goolsbee are listed for 12:30 PM ET on Thursday, a 10-year inflation-protected note auction for 1:00 PM ET on Thursday and remarks by Fed Governor Barr for 2:15 PM ET on Thursday by the news-feed calendar, unconfirmed. A meeting of the US, Chinese and Russian leaders appears on a published key-date list for Thursday, unconfirmed. In this review's judgment the captured calendars carry no crude-specific release for Thursday, so the dollar's reaction to the 8:30 AM ET data and Gulf reports are the first-order inputs for crude on Thursday.
Sources and methodology
Prices are for the January WTI contract (CLF27), the front contract on the chart since the roll at Tuesday's 6:00 PM ET reopen. The intraday sequence comes from the January 30-minute series; settlement averages were computed from 259 completed January daily settlements; oscillators, the composite read, the standard-deviation bands and the pivot ladder are quoted as published. No options positioning data set is used for crude.
The prior card, in Wednesday's outlook, sold January crude into 85.90 to 86.20 with an 86.80 stop and objectives at 85.30, 84.55 and 83.80. It is graded on the January 30-minute path across Wednesday's full session: the high was 84.77, so the band never traded, no entry was taken and no objective counts.
Every outlook is graded in public against its own levels; the running record sits on our performance statement.
Three lower highs in a row. Thursday shows whether a fourth forms beneath 84.32.
This article is market commentary for educational purposes and is not investment advice. Futures and options trading involves substantial risk of loss and is not suitable for every investor. Past results do not guarantee future results.