Tuesday's outlook sold December crude into 86.70 to 87.00. The band traded in the 8:00 AM ET bar, the December contract reached 87.38 in the 9:00 AM ET bar, 0.42 short of the 87.80 stop, and then turned lower. The first objective at 85.90 traded in the 12:00 PM ET bar, 0.80 beneath the bottom of the band.
That was as far as the card got. The second objective at 84.95 and the extended 84.00 did not trade on the December path, whose afternoon low was 85.28. December settled at 86.01.
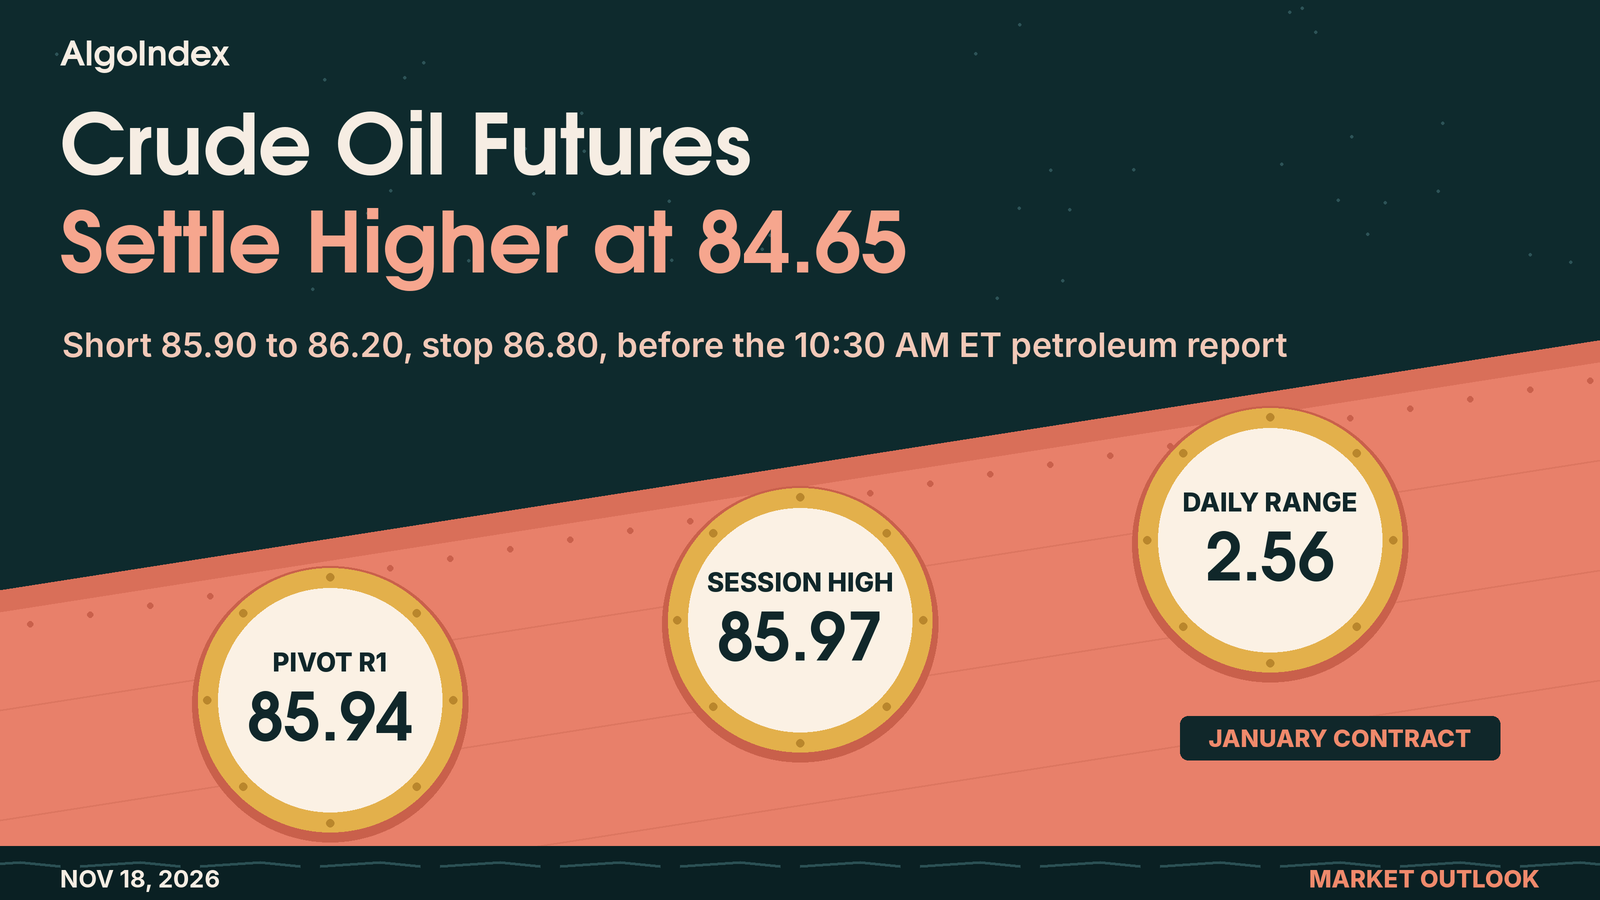
This outlook moves to the January contract (CLF27), which became the front month at Tuesday's 6:00 PM ET reopen. January settled at 84.65, up 0.18, and our plan sells a rebound into 85.90 to 86.20 ahead of the 10:30 AM ET petroleum status report.
At a glance
- January settle 84.65, up 0.18; range 83.41 to 85.97; lower high and lower low against Monday.
- Wednesday's setup on January: short 85.90 to 86.20, stop 86.80, objectives 85.30, 84.55 and an extended 83.80.
- Thesis negated on a settle above two standard deviation resistance at 86.77; two consecutive 30-minute closes above 86.20 remove the edge.
- Contract roll: the chart moved from December to January at Tuesday's 6:00 PM ET reopen; December settled at 86.01, 1.36 above January.
- Calendar: housing starts 8:30 AM ET, petroleum status report 10:30 AM ET, FOMC minutes 2:00 PM ET, settle 2:30 PM ET.
How Tuesday traded: a morning high, then fading into the settle
The December contract set its 84.68 low early, in the 2:00 AM ET bar, and climbed through the European morning. The 8:00 AM ET bar added 0.56, the biggest gain of the day, and the 87.38 high came in the 9:00 AM ET bar, after the 8:30 AM ET retail sales report.
Supply worries carried the morning. Published commentary pointed to US strikes on Iran's Qeshm Island after a third Iranian drone attack on Bahrain in under a week, and to stepped-up Ukrainian attacks on Russian refineries. Prices came off the highs after an Iranian semi-official agency said Tehran is pursuing a diplomatic exit.
The 2:30 PM ET bar, just after the settle, fell 0.62 while the feed carried the Qeshm strike and a reported vessel explosion in the Strait of Hormuz. The series does not show those reports lifting the price. On the January contract, Tuesday ran from 83.41 to 85.97 and settled at 84.65, 1.24 above the low.
A 5.3 million barrel build and soft product margins
The industry inventory estimate at 4:45 PM ET showed a crude build of 5.3 million barrels against a forecast draw of 0.50 million. Gasoline stocks rose 5.1 million barrels and distillates 0.351 million, while Cushing drew 1.7 million barrels, the one supportive line.
Product margins narrowed again. Measured on the December contracts, the heating oil margin over WTI slipped to 83.99 dollars a barrel from 85.72 and the gasoline margin to 20.46 from 20.87. In our reading that points to soft product demand rather than crude-specific strength.
The January contract reopened at 84.50, 0.15 beneath the settle, after evening reports of drone attacks and explosions in Kuwait. It sits beneath the 5-day average at 85.91 and the 9-day at 86.54, above the 100-day at 83.23, and the composite multi-indicator read holds at "24% SELL" with minimum strength.
The trade map for Wednesday
The setup sells a rebound into 85.90 to 86.20 on the January contract, at Pivot R1 at 85.94, Tuesday's 85.97 high and one standard deviation resistance at 86.15. The stop at 86.80 sits above two standard deviation resistance at 86.77.
Objectives step down through known references: 85.30, beneath the 85.38 crossover projection; 84.55, beneath the Pivot Point at 84.68 and Tuesday's 84.65 settle; and an extended 83.80, above Tuesday's 83.41 low and Pivot S1 at 83.38. From the 86.05 midpoint of the band, risk is 0.75 and the objectives sit 0.75, 1.50 and 2.25 away.
Gulf headlines are the upside risk. A large official draw at 10:30 AM ET, confirmed attacks on Gulf infrastructure or vessels, or a weaker dollar is the most likely route through 86.80, which would bring Pivot R2 at 87.24 into view.
| Item | Detail |
|---|---|
| Direction | Short |
| Contract | January WTI (CLF27), the front contract since Tuesday's 6:00 PM ET reopen |
| Entry zone | 85.90 to 86.20 |
| Stop | 86.80, above two standard deviation resistance at 86.77 |
| Objective 1 | 85.30, beneath the 85.38 crossover projection |
| Objective 2 | 84.55, beneath the Pivot Point at 84.68 and Tuesday's 84.65 settle |
| Objective 3 (extended) | 83.80, above Tuesday's 83.41 session low and Pivot S1 at 83.38 |
| Risk from band midpoint | 0.75; reward 0.75, 1.50 and 2.25, about 1:1, 1:2 and 1:3 |
| Invalidation | A settle above two standard deviation resistance at 86.77 negates the thesis. Short of that, the edge is removed by acceptance above the entry band rather than by a touch, defined as two consecutive 30-minute closes above 86.20. |
| What could change it | A large official crude draw at 10:30 AM ET, confirmed attacks on Gulf infrastructure or vessels, or a reversal lower in the dollar would lift the contract. In that scenario a move through the 86.80 stop invalidates the short before the targets, and Pivot R2 at 87.24 becomes the reference, 0.44 beyond the stop and well inside one 14-day average true range of 3.80. |
How Wednesday could unfold
Night Session (6:00 PM ET Tuesday to 3:00 AM ET Wednesday, Globex/Asia)
Globex reopened at 6:00 PM ET on Tuesday with the January contract at 84.50, 0.15 beneath the settle, after the 4:45 PM ET industry inventory estimate's build and the Kuwait reports between 4:42 PM ET and 4:53 PM ET. Remarks by the Reserve Bank of Australia governor are listed for 6:00 PM ET on Tuesday and UK consumer prices for 2:00 AM ET on Wednesday by the news-feed calendar, unconfirmed. In our judgment the overnight session is likely to hold between Pivot S1 at 83.38 and Pivot R1 at 85.94, with further Gulf reports the main source of a move outside it; expected band roughly 83.70 to 85.60.
London Session (3:00 AM to 8:00 AM ET Wednesday)
Final eurozone consumer prices are listed for 5:00 AM ET on Wednesday by the news-feed calendar, unconfirmed. Bias neutral beneath Pivot R1 at 85.94, expected band roughly 83.80 to 85.70, with the dollar's direction and Gulf reports the main inputs ahead of the US data.
Morning Session (9:00 AM to 12:00 PM ET Wednesday, US Open / Pit Session)
US housing starts and building permits are scheduled for 8:30 AM ET on Wednesday, November 18, 2026, per the verified forward calendar, and the cash open at 9:30 AM ET sets the first directional test for the related markets. The weekly petroleum status report follows at 10:30 AM ET on Wednesday, November 18, 2026, per the verified forward calendar, the first-order release for crude on the day. A crude build in line with the industry estimate could carry the contract toward the 83.41 low, while a draw near the listed consensus could lift it into the 85.90 to 86.20 band. Expected band roughly 83.30 to 86.20.
Afternoon Session (12:00 PM to 2:30 PM ET Wednesday, NYMEX Pit Close)
Remarks by Fed Governor Barr are listed for 1:35 PM ET on Wednesday by the news-feed calendar, unconfirmed. The FOMC minutes are scheduled for 2:00 PM ET on Wednesday, November 18, 2026, per the verified forward calendar, inside the half hour before the 2:30 PM ET settlement. A 20-year bond auction is listed for 1:00 PM ET by the news-feed calendar, unconfirmed. Expected band roughly 83.40 to 86.00, with the Pivot Point at 84.68 the reference for the settle.
Night Session Forward (6:00 PM ET Wednesday)
Australian employment figures are listed for 7:30 PM ET on Wednesday and US jobless claims for 8:30 AM ET on Thursday by the news-feed calendar, unconfirmed. A meeting of the US, Russian and Chinese leaders is listed for Wednesday by the news-feed calendar and for Thursday by a second key-date list, unconfirmed, and the December contract's expiration on 11/20/26, listed by the data service, follows on Friday.
Most Likely Path
In our analyst judgment, the most probable path holds between Pivot S1 at 83.38 and Pivot R1 at 85.94 into the 10:30 AM ET report, rebounds toward the 85.90 to 86.20 band on Gulf reports or a draw and fails there, then trades back toward the Pivot Point at 84.68 and Tuesday's 83.41 low. A lower high, a lower low, the composite at "24% SELL", the industry estimate's crude build and the settle beneath the 9-day, 20-day and 50-day averages support that reading, while the twelve consecutive settles beneath the 9-day average and a 9-day relative strength of 34.08 argue that the decline is extended and that a test of Pivot S1 at 83.38 is more likely than a run beneath the 82.83 one-month low. The alternative that would invalidate this reading is a settle above two standard deviation resistance at 86.77, which would bring Pivot R2 at 87.24 back into play; a confirmed escalation in the Gulf, including further attacks on Kuwait or on vessels in the Strait of Hormuz, or an official crude draw are the inputs most likely to drive that alternative. On the other side, an official build near the industry estimate could carry the contract through Pivot S1 at 83.38 toward the 82.83 one-month low without the rebound the setup needs.
The complete data picture
Every January level behind Wednesday's plan, charted first; the full numeric reference from Tuesday's review follows underneath.
| Resistance, top to bottom | Support, top to bottom |
|---|---|
| 87.24 Pivot R2 and three standard deviation resistance | 84.47 Monday's settle |
| 87.09 40-day average stall | 84.00 Published target price |
| 86.77 Two standard deviation resistance | 83.41 Tuesday's session low |
| 86.54 9-day average | 83.38 Pivot S1 |
| 86.27 38.2% retracement from the 13-week low | 83.15 One standard deviation support |
| 86.21 9-day average crossing | 82.83 One-month low of 11/10/26 |
| 86.15 One standard deviation resistance | 82.53 Two standard deviation support and 3-10 day crossover stall |
| 85.97 Tuesday's session high | 82.12 Pivot S2 |
| 85.94 Pivot R1 | 82.06 Three standard deviation support |
| 85.91 5-day average | 80.82 Pivot S3 |
| 85.38 18-40 day average crossover projection | |
| 84.98 61.8% retracement from the 52-week low | |
| 84.68 Pivot Point |
- Pivot ladder (January): R3 88.50, R2 87.24, R1 85.94, Pivot Point 84.68, S1 83.38, S2 82.12, S3 80.82.
- Standard-deviation bands: 83.15 to 86.15 at one deviation, 82.53 to 86.77 at two and 82.06 to 87.24 at three. The 14-day average true range of 3.80 frames 80.85 to 88.45.
- Further stalls on the published grid: 14-day stochastic stall at 87.82 and MACD average stall at 87.88.
Full numeric reference: every remaining figure from Tuesday's review
Executive Summary
The January crude contract, now the front contract on the chart after the roll from December, settled at 84.65 on Tuesday, up 0.18 or 0.21 percent from Monday's settle of 84.47, after trading between 85.97 and 83.41, a 2.56 point daily range. The settle finished 1.24 above the low and 1.32 beneath the high, just beneath the midpoint of the range. Tuesday printed a lower high, 2.24 beneath Monday's 88.21, and a lower low, 0.36 beneath Monday's 83.77, and the 2.56 point range was the narrowest since the 1.69 point range of 11/13/26, against a published 14-day average daily range of 4.24 points.
Tuesday was the first higher settle after two lower settles, and the 83.41 low is the lowest since the 82.83 low of 11/10/26, which the data service publishes as the one-month low. Over five sessions the January contract is down 0.21 from the 84.86 settle of 11/10/26, a decline of 0.25 percent. The settle sits above the 100-day and 200-day settlement averages and beneath the 5-day, 9-day, 20-day and 50-day, and it is the second consecutive settle beneath the 5-day average.
The expiring December contract settled at 86.01, up 0.29, and its premium over January widened to 1.36 from 1.25. The data service's market commentary attributed support on Tuesday to US strikes on several locations on Iran's Qeshm Island, described as a response to a third Iranian drone attack against Bahrain in less than a week, and to stepped-up Ukrainian attacks on Russian refineries, and said prices came off their highs after an Iranian semi-official news agency report that Iran is pursuing a diplomatic exit; that is attributed commentary and was not recomputed.
After the 2:30 PM ET settle the industry inventory estimate at 4:45 PM ET showed a crude build of 5.3 million barrels against a forecast draw of 0.50 million, per the news feed, and between 4:42 PM ET and 4:53 PM ET the news feed carried reports of Kuwaiti air defences countering drone attacks and of explosions heard in Kuwait. The January contract reopened at 84.50 at 6:00 PM ET, 0.15 beneath the settle, per the data service's record of the new session.
The composite multi-indicator read published on Tuesday evening is "24% SELL" with strength "Minimum" and direction "Average", unchanged from "24% SELL" a session earlier. The setup is a short from the 85.90 to 86.20 band, at Pivot R1 at 85.94 and beneath one standard deviation resistance at 86.15, stopped at 86.80, with objectives at 85.30, 84.55 and an extended 83.80. In our judgment the weekly petroleum status report at 10:30 AM ET on Wednesday, per the verified forward calendar, is the first-order scheduled input for crude after the industry estimate's build, with Gulf reports the main unscheduled one.
Price Action & Technical Structure
2.1 Intraday and Session Review
The January contract opened Tuesday's session at 83.90 at the Monday 6:00 PM ET reopen, 0.57 beneath Monday's settle, traded between 83.41 and 85.97 and settled at 84.65 at 2:30 PM ET, per the data service's January settlement record. Those four prices come from the data service's daily record; the chart's intraday series was not on the January contract for Tuesday's session, as described below, so our review does not cite a January intraday path.
The chart's continuous series rolled at the 6:00 PM ET reopen on Tuesday. Its completed daily bars through Tuesday equal the December contract's settlement record less a constant 1.36, which is the December premium over January at Tuesday's settle, and its 30-minute series for Tuesday's session equals the December contract less a constant 1.22. With the 1.22 added back, the 30-minute series reproduces the December contract's open of 85.16, high of 87.38 and low of 84.68, so it describes the December contract's path and is cited here only in December prices.
On that December series the low of 84.68 printed in the 2:00 AM ET bar, during the overnight hours. The contract then rose through the European morning, and the 8:00 AM ET bar gained 0.56, the largest gain of any bar in the session. The December high of 87.38 printed in the 9:00 AM ET bar, which followed the US retail sales report at 8:30 AM ET on Tuesday, November 17, 2026, per the verified forward calendar.
The 2:00 PM ET bar closed at 86.02 in December terms, one cent from the December settle of 86.01, and the 2:30 PM ET bar, which spans the minutes after the settlement, fell 0.62, the largest decline of any bar in the session. That bar coincided with the news feed's 2:25 PM ET report of a US strike on a missile launch site on Qeshm Island and its 2:41 PM ET report from Iranian state media of an explosion of a vessel in the Strait of Hormuz; the series does not show those reports lifting the price. The 4:30 PM ET bar, which spans the 4:45 PM ET industry inventory estimate, traded across 0.35 and closed at 85.61 in December terms, 0.40 beneath the December settle.
Globex reopened at 6:00 PM ET, so the data service's January overview, read at 6:23 PM ET, already carries the new session dated Wednesday, with an open of 84.50, a high of 84.67, a low of 84.47 and a previous close field of 84.65; those prices belong to Wednesday's session, not to Tuesday's. The chart's header read 84.53, down 0.12, which implies a prior close of 84.65 and matches the data service's previous close field.
The published Pivot Point is 84.68.
2.2 Daily Structure
Tuesday printed a lower high and a lower low against Monday and settled 0.18 higher, 1.24 above the low and just beneath the 84.69 midpoint of the range. Settlements over the last six sessions read 84.86, 85.43, 87.69, 87.29, 84.47 and 84.65, so Tuesday recovered 0.18 of Monday's 2.82 point decline and settled 0.21 beneath the 84.86 settle of 11/10/26.
The 83.41 low is the lowest since the 82.83 low of 11/10/26, which the data service publishes as the one-month low. The data service publishes 103.01 as the 52-week, 13-week and one-month high, printed on 10/30/26, and 75.92 as the 13-week low. The settle sits 0.33 beneath the 84.98 level published as the 61.8 percent retracement from the 52-week low and 1.62 beneath the 86.27 level published as the 38.2 percent retracement from the 13-week low.
In our interpretation a narrow day with a settle near the middle of the range, after Monday's wide decline, reads as a pause rather than a reversal, with a lower high and a lower low intact. The structure of lower highs from the 103.01 high of 10/30/26 is unchanged, with the settle beneath the 9-day, 20-day and 50-day averages.
2.3 4-Hour and Swing Structure
The 2.56 point range followed ranges of 4.06 on 11/12/26, 1.69 on 11/13/26 and 4.44 on Monday. Daily ranges over the last ten sessions, from 11/04/26, ran 9.55, 4.18, 3.24, 6.17, 2.98, 2.75, 4.06, 1.69, 4.44 and 2.56, so Tuesday's range was the second narrowest of the ten.
The swing sequence since the 103.01 high of 10/30/26 shows highs of 90.12 on 11/09/26 and 85.81 on 11/10/26, three higher highs at 87.38, 88.11 and 88.49 from 11/11/26 to 11/13/26, and two lower highs since, at 88.21 on Monday and 85.97 on Tuesday. The lows read 82.83 on 11/10/26, 84.63 on 11/11/26, 84.05 on 11/12/26, 86.80 on 11/13/26, 83.77 on Monday and 83.41 on Tuesday, two consecutive lower lows, and Tuesday's low held 0.58 above the 82.83 one-month low.
The published grid places the 18-40 day average crossover projection at 85.38, the 9-day average crossing at 86.21, the 40-day average stall at 87.09, the 14 day stochastic stall at 87.82 and the MACD average stall at 87.88, with the 3-10 day average crossover stall at 82.53 beneath the settle.
2.4 Moving Averages
The averages cited here were computed from the data service's daily settlement series for the January contract, which holds 259 completed sessions from 11/06/25 through Tuesday; the partial Wednesday row of the reopened Globex session was excluded before counting, and each average is carried at full precision and rounded once to the cent. The 5-day average stands at 85.91, the 9-day at 86.54, the 20-day at 92.52, the 50-day at 90.65, the 100-day at 83.23 and the 200-day at 78.08.
The 84.65 settle sits 1.26 beneath the 5-day average, 1.89 beneath the 9-day, 7.87 beneath the 20-day and 6.00 beneath the 50-day, and 1.42 above the 100-day and 6.57 above the 200-day. It is the second consecutive settle beneath the 5-day average, the last settle above it on 11/13/26, the twelfth consecutive settle beneath the 9-day and the 20-day averages, the last settle above both on 10/30/26, and the tenth consecutive settle beneath the 50-day, the last settle above it on 11/03/26. The 5-day average fell from Monday's 85.95 as Tuesday's settle replaced the 84.86 settle of 11/10/26, and the 9-day fell from 86.81 as the 87.10 settle of 11/04/26 left the window.
The 5-day average sits beneath the 9-day because the four older settlements in the 9-day window averaged higher, at 87.34. The 5-day sits beneath the 20-day because the 15 older settlements in the 20-day window averaged higher, at 94.72. The 20-day average sits above the 50-day because the 30 older settlements in the 50-day window averaged lower, at 89.41. The 50-day sits above the 100-day because the 50 older settlements in the 100-day window averaged lower, at 75.81, and the 100-day sits above the 200-day because the 100 older settlements in the 200-day window averaged lower, at 72.93.
2.5 Oscillator and Trend Readings
The oscillator figures below are as published on the data service's January technical page, read at 6:23 PM ET after the 6:00 PM ET reopen on a page titled for Wednesday, so they may already reflect the live Globex price rather than Tuesday's settle; they are the data service's readings, not our computations. The 9-day relative strength reads 34.08, the 14-day relative strength 38.52 and the 20-day relative strength 42.31.
The 9-day raw stochastic reads 22.11 percent and the 14-day raw stochastic 9.02 percent, while the 14-day stochastic %K reads 13.08 percent and the 14-day stochastic %D 16.96 percent. The 9-day directional index ADX reads 41.79 with the 9-day +DI at 12.08 and the 9-day -DI at 30.63, and the 14-day directional index ADX reads 33.50 with the 14-day +DI at 13.97 and the 14-day -DI at 27.58, so negative direction leads on both systems. The 9-day historic volatility reads 35.01 percent and the 14-day historic volatility 52.29 percent.
The composite multi-indicator read published on Tuesday evening is "24% SELL", with signal strength "Minimum" and direction "Average". The snapshot history reads "24% SELL" for the prior session, "32% SELL" a week ago and "100% BUY" a month ago. The short horizon group averages "60% SELL", the medium group "25% SELL" and the long group "67% BUY", and the trend composite reads "SELL".
2.6 Volatility and Expected Range
The published 14-day average true range stands at 3.80 points and the 14-day average daily range at 4.24 points; the 9-day average true range is 3.83 with a 9-day average daily range of 3.56, and the 20-day average true range is 3.67 with a 20-day average daily range of 3.94. Tuesday's 2.56 point range sat well inside the 14-day average daily range.
Adding and subtracting the 14-day average true range of 3.80 from the 84.65 settle frames Wednesday between 80.85 and 88.45. The published standard-deviation bands, built from five settlements, span 83.15 to 86.15 at one deviation, 82.53 to 86.77 at two and 82.06 to 87.24 at three. These bands describe dispersion, not intraday reach. In our judgment the weekly petroleum status report and the Gulf reports make a range nearer the 14-day average more likely on Wednesday than a repeat of Tuesday's contraction.
Key Levels
3.1 Resistance
Above the 84.65 settle, the first references are the Pivot Point at 84.68 and the 84.98 level published as the 61.8 percent retracement from the 52-week low, with the 85.38 crossover projection just above. The 5-day average at 85.91, Pivot R1 at 85.94 and Tuesday's 85.97 session high form the next band, followed by one standard deviation resistance at 86.15, the 86.21 crossing of the 9-day average and the 86.27 retracement from the 13-week low. The 9-day average at 86.54 and two standard deviation resistance at 86.77 follow, with the 87.09 stall of the 40-day average and Pivot R2 at 87.24, where three standard deviation resistance also sits, beyond them.
3.2 Support
Beneath the settle sit Monday's 84.47 settle and the 84.00 target price published by the data service. Tuesday's 83.41 session low and Pivot S1 at 83.38 form the next band, followed by one standard deviation support at 83.15 and the 82.83 one-month low of 11/10/26. Two standard deviation support at 82.53, where the 3-10 day crossover stall also sits, and Pivot S2 at 82.12 are the deeper references, with three standard deviation support at 82.06 and Pivot S3 at 80.82 beyond them.
Macro Drivers
4.1 OPEC and Supply Policy (Quotas, Compliance, Saudi/Russia Signals)
No producer-group statement was captured on Tuesday. The data service's market commentary said concerns about tighter global supplies underpinned crude after Ukraine stepped up its attacks on Russian refineries, which is attributed commentary. Investment-bank commentary carried by the news feed said crude prices have remained well above pre-war expectations in 2026, with a smaller impact than initially feared given the prolonged disruption to traffic through the Strait of Hormuz; that is attributed and was not recomputed. The 69th joint ministerial monitoring committee meeting of the producer group is listed for November 29, 2026, per the verified forward calendar.
4.2 EIA and API Inventory (Crude Stocks, Gasoline, Distillates, Cushing, SPR)
The industry inventory estimate released at 4:45 PM ET on Tuesday showed a crude build of 5.3 million barrels against a forecast draw of 0.50 million and a 9.8 million barrel draw previously, a Cushing draw of 1.7 million barrels against a 5.1 million build previously, a gasoline build of 5.1 million barrels and a distillate build of 0.351 million, per the news feed. The weekly petroleum status report is scheduled for 10:30 AM ET on Wednesday, November 18, 2026, per the verified forward calendar, and the news-feed calendar lists a draw of 0.018 million barrels as the consensus against a 4.657 million barrel build previously, figures that are unconfirmed.
In our interpretation the industry estimate's crude and gasoline builds point to a softer official report than the consensus, while the Cushing draw is the one supportive line; the official figures can differ materially from the industry estimate.
4.3 Geopolitical Backdrop (Middle East, Iran, Russia/Ukraine, Venezuela)
At 2:25 PM ET the news feed carried a US military official's statement that US fighter aircraft struck an Iranian missile launch site on Qeshm Island, followed at 2:28 PM ET by press reports that a US official described the strike as self-defense and at 2:29 PM ET that the United States had reacted to Iran's targeting of US personnel and assets. At 2:41 PM ET it carried an Iranian state media report of an explosion of a third vessel in the Strait of Hormuz. Earlier, at 2:02 PM ET, press reports said the diplomatic track between the United States and Iran had not seen a breakthrough, and at 2:17 PM ET an Iranian semi-official news agency said Iran is seriously pursuing a diplomatic end to the impasse.
After the settle, at 4:05 PM ET, the news feed carried a statement from Qatar's prime minister that diplomatic efforts between Iran and the United States continue, and at 4:42 PM ET a statement that Kuwaiti air defences were countering hostile drone attacks, followed at 4:50 PM ET by reports of air raid sirens at US bases in Kuwait and at 4:53 PM ET by reports of several explosions heard in Kuwait. These are reports carried by the feeds; the January contract reopened at 84.50 at 6:00 PM ET, 0.15 beneath its settle, and the settlement record does not establish that any single item caused a particular move.
4.4 Demand and Refining (Refinery Utilization, Crack Spreads, Seasonal Pattern)
Heating oil's December contract settled at 4.0475 dollars a gallon, down 0.84 percent, and gasoline's December contract at 2.5349, down 0.12 percent, against a 0.34 percent gain in December crude. Measured on the December contracts, the heating oil margin over December WTI narrowed to 83.99 dollars a barrel from 85.72, and the gasoline margin narrowed to 20.46 from 20.87. Natural gas's December contract settled at 3.208, up 2.75 percent. The US retail sales report printed a 0.2 percent monthly gain against a 0.1 percent forecast, per the news-feed calendar and unconfirmed. In our interpretation a second session of narrowing product margins, alongside the industry estimate's gasoline build, points to soft product demand rather than to crude-specific strength.
4.5 Dollar and Cross-Asset (DXY, Commodities Complex, Equity Risk-On/Off)
The dollar index's daily record closed at 103.49, down 0.06 from Monday's 103.55, and a news-feed headline at 1:30 PM ET described the index fading from a 19-month high after the retail sales report, which is attributed. The ten-year yield index closed at 5.10, down from 5.12 on Monday. Gold's December contract rose 0.29 percent and silver's December contract 1.06 percent, while the S&P 500 cash index fell 1.03 percent and the volatility index rose 2.55 points to 25.46.
After the equity close, the news feed carried NVIDIA's quarterly results from 4:23 PM ET, with revenue of 115.8 billion dollars against an estimate of 109.33 billion and a fourth-quarter revenue outlook of 130 billion plus or minus 3 percent. In our interpretation a softer dollar helped crude hold Monday's low area on Tuesday, while the equity decline and the risk-off tone limited the rebound.
4.6 Institutional Positioning (COT, Money Manager vs Commercial Hedger, Speculator Length)
The latest weekly positioning report on the data service's overview, for the week to Tuesday, November 10, 2026, shows managed money at 148,092 long, up 710, against 122,378 short, down 3,276, as listed and not recomputed. January volume was 172,377 contracts on Tuesday against 165,372 on Monday, and January open interest fell to 257,256 from 265,553, per the settlement record. December's premium over January widened to 1.36 from 1.25 as December settled 0.29 higher at 86.01 and January 0.18 higher at 84.65, and Brent's January premium over January WTI widened to 8.49 from 7.97 as Brent's January contract settled at 93.14, up 0.70. The data service lists 11/20/26 as the December contract's expiration date, and 12/21/26 as the January contract's expiration date and 12/23/26 as its first notice date.
No Liquid Options Proxy
This outlook covers crude without a positioning dataset; listed crude options trade, but no dealer-positioning dataset for them was read in this edition. There is no gamma map, no options concentration levels and no flow attribution, and none is inferred from any other instrument. Every level in section 3 originates in published pivot arithmetic, published standard-deviation bands, published retracement and moving-average projections, settlement averages computed from the data service's daily record, or the completed-session extremes described in section 2.1.
This is a statement about our coverage, not about the existence or liquidity of listed crude options. No such dataset was read, so no claim resting on one appears anywhere in our review or in the derived public post. The positioning inputs used for crude are the Brent spread, the front calendar spread, the product margins, the volume and open interest record and the weekly positioning figures in section 4.6.
Forecast
Night Session (6:00 PM ET Tuesday to 3:00 AM ET Wednesday, Globex/Asia)
Globex reopened at 6:00 PM ET on Tuesday with the January contract at 84.50, 0.15 beneath the settle, after the 4:45 PM ET industry inventory estimate's build and the Kuwait reports between 4:42 PM ET and 4:53 PM ET. Remarks by the Reserve Bank of Australia governor are listed for 6:00 PM ET on Tuesday and UK consumer prices for 2:00 AM ET on Wednesday by the news-feed calendar, unconfirmed. In our judgment the overnight session is likely to hold between Pivot S1 at 83.38 and Pivot R1 at 85.94, with further Gulf reports the main source of a move outside it; expected band roughly 83.70 to 85.60.
London Session (3:00 AM to 8:00 AM ET Wednesday)
Final eurozone consumer prices are listed for 5:00 AM ET on Wednesday by the news-feed calendar, unconfirmed. Bias neutral beneath Pivot R1 at 85.94, expected band roughly 83.80 to 85.70, with the dollar's direction and Gulf reports the main inputs ahead of the US data.
Morning Session (9:00 AM to 12:00 PM ET Wednesday, US Open / Pit Session)
US housing starts and building permits are scheduled for 8:30 AM ET on Wednesday, November 18, 2026, per the verified forward calendar, and the cash open at 9:30 AM ET sets the first directional test for the related markets. The weekly petroleum status report follows at 10:30 AM ET on Wednesday, November 18, 2026, per the verified forward calendar, the first-order release for crude on the day. A crude build in line with the industry estimate could carry the contract toward the 83.41 low, while a draw near the listed consensus could lift it into the 85.90 to 86.20 band. Expected band roughly 83.30 to 86.20.
Afternoon Session (12:00 PM to 2:30 PM ET Wednesday, NYMEX Pit Close)
Remarks by Fed Governor Barr are listed for 1:35 PM ET on Wednesday by the news-feed calendar, unconfirmed. The FOMC minutes are scheduled for 2:00 PM ET on Wednesday, November 18, 2026, per the verified forward calendar, inside the half hour before the 2:30 PM ET settlement. A 20-year bond auction is listed for 1:00 PM ET by the news-feed calendar, unconfirmed. Expected band roughly 83.40 to 86.00, with the Pivot Point at 84.68 the reference for the settle.
Night Session Forward (6:00 PM ET Wednesday)
Australian employment figures are listed for 7:30 PM ET on Wednesday and US jobless claims for 8:30 AM ET on Thursday by the news-feed calendar, unconfirmed. A meeting of the US, Russian and Chinese leaders is listed for Wednesday by the news-feed calendar and for Thursday by a second key-date list, unconfirmed, and the December contract's expiration on 11/20/26, listed by the data service, follows on Friday.
Expected Range (Wednesday Full Session)
- Low-range scenario: 83.60 to 85.70
- Mid-range scenario (most likely): 82.90 to 86.30
- High-range scenario: 81.90 to 87.20
Most Likely Path
In our analyst judgment, the most probable path holds between Pivot S1 at 83.38 and Pivot R1 at 85.94 into the 10:30 AM ET report, rebounds toward the 85.90 to 86.20 band on Gulf reports or a draw and fails there, then trades back toward the Pivot Point at 84.68 and Tuesday's 83.41 low. A lower high, a lower low, the composite at "24% SELL", the industry estimate's crude build and the settle beneath the 9-day, 20-day and 50-day averages support that reading, while the twelve consecutive settles beneath the 9-day average and a 9-day relative strength of 34.08 argue that the decline is extended and that a test of Pivot S1 at 83.38 is more likely than a run beneath the 82.83 one-month low.
The alternative that would invalidate this reading is a settle above two standard deviation resistance at 86.77, which would bring Pivot R2 at 87.24 back into play; a confirmed escalation in the Gulf, including further attacks on Kuwait or on vessels in the Strait of Hormuz, or an official crude draw are the inputs most likely to drive that alternative. On the other side, an official build near the industry estimate could carry the contract through Pivot S1 at 83.38 toward the 82.83 one-month low without the rebound the setup needs.
Wednesday Economic Calendar
Tuesday's releases are complete. The US retail sales report was released at 8:30 AM ET on Tuesday, November 17, 2026, per the verified forward calendar, with a 0.2 percent monthly gain against a 0.1 percent forecast and core sales up 0.6 percent against 0.4 percent, and import prices rose 1.1 percent against a 0.7 percent forecast, figures per the news-feed calendar and unconfirmed. Industrial production was released at 9:15 AM ET on Tuesday, November 17, 2026, per the verified forward calendar, falling 0.4 percent against a 0.1 percent forecast per the news-feed calendar, unconfirmed. Business inventories followed at 10:00 AM ET on Tuesday, November 17, 2026, per the verified forward calendar, up 0.5 percent per the news-feed calendar, unconfirmed.
Remarks by New York Fed President Williams were carried by the news feed from 2:26 PM ET, including that tariffs and the energy shock are still affecting inflation readings, a news-feed report that is unconfirmed. December WTI settled at 2:30 PM ET at 86.01 and January at 84.65. The industry inventory estimate followed at 4:45 PM ET per the news feed, and the NVIDIA results conference call was scheduled for 5:00 PM ET on Tuesday, November 17, 2026, per the verified forward calendar.
Wednesday brings US housing starts and building permits at 8:30 AM ET on Wednesday, November 18, 2026, per the verified forward calendar, and the weekly petroleum status report at 10:30 AM ET on Wednesday, November 18, 2026, per the verified forward calendar. Remarks by ECB President Lagarde are listed for 9:25 AM ET, pending home sales for 10:00 AM ET, remarks by San Francisco Fed President Daly for 12:15 PM ET and a 20-year bond auction for 1:00 PM ET on Wednesday by the news-feed calendar, unconfirmed.
Remarks by Fed Governor Barr are listed for 1:35 PM ET on Wednesday by the news-feed calendar, unconfirmed. The FOMC minutes are scheduled for 2:00 PM ET on Wednesday, November 18, 2026, per the verified forward calendar. Remarks by Minneapolis Fed President Kashkari are listed for 4:15 PM ET on Wednesday by the news-feed calendar, unconfirmed. In our judgment the 10:30 AM ET petroleum status report is the first-order scheduled input for crude on Wednesday, with the FOMC minutes the main cross-asset release and Gulf reports the main unscheduled one.
Primary Trade Setup
Direction: Short
Rationale: The January contract printed a lower high and a lower low on Tuesday, settled beneath the Pivot Point at 84.68 and beneath the 5-day, 9-day, 20-day and 50-day averages, and the industry estimate after the settle showed a 5.3 million barrel crude build. A rebound into the 85.90 to 86.20 band, at Pivot R1 at 85.94 and beneath one standard deviation resistance at 86.15, offers a short with a defined risk point above two standard deviation resistance at 86.77. The twelve consecutive settles beneath the 9-day average and the 9-day relative strength of 34.08 point to an extended decline, and the Gulf reports carry upside risk, so the setup is an analyst judgment that rebounds are sold into the petroleum report, not a measured edge.
Entry Zone: 85.90 to 86.20
Stop Loss: 86.80 (above two standard deviation resistance at 86.77)
Target 1 (T1): 85.30 (beneath the 85.38 crossover projection)
Target 2 (T2): 84.55 (beneath the Pivot Point at 84.68 and Tuesday's 84.65 settle)
Target 3 (T3, extended): 83.80 (above Tuesday's 83.41 session low and Pivot S1 at 83.38)
Risk-to-Reward: Approximately 1:1 to T1, 1:2 to T2, 1:3 to T3
Invalidation: A settle above two standard deviation resistance at 86.77 negates the thesis. Short of that, the edge is removed by acceptance above the entry band rather than by a touch, defined as two consecutive 30-minute closes above 86.20.
Macro override: A large official crude draw at 10:30 AM ET, confirmed attacks on Gulf infrastructure or vessels, or a reversal lower in the dollar would lift the contract. In that scenario a move through the 86.80 stop invalidates the short before the targets, and Pivot R2 at 87.24 becomes the reference, 0.44 beyond the stop and well inside one 14-day average true range of 3.80.
Sources and methodology
January prices, settlements, volume and open interest come from the exchange settlement record for the January contract (CLF27), which settles at 2:30 PM ET. The chart's continuous series rolled from December to January at Tuesday's 6:00 PM ET reopen and its history is back-adjusted, so Tuesday's 30-minute path is cited only in December prices, adding back the constant 1.22 offset. Moving averages were computed from 259 completed January daily settlements; oscillators, the composite read and the pivot ladder are quoted as published. No options positioning data set is used for crude.
The prior card, in Tuesday's outlook, was written on the December contract and is graded on the December 30-minute path across Tuesday's full session; no fill is assumed beyond the band edge first traded, and an objective counts only when it traded after the band first traded. The band traded at 86.70 in the 8:00 AM ET bar, the 85.90 objective traded in the 12:00 PM ET bar, 84.95 and 84.00 did not trade, and the 87.80 stop never traded.
Every outlook is graded in public against its own levels; the running record sits on our performance statement.
The industry estimate pointed to a build. The 10:30 AM ET report confirms it or reverses it.
This article is market commentary for educational purposes and is not investment advice. Futures and options trading involves substantial risk of loss and is not suitable for every investor. Past results do not guarantee future results.