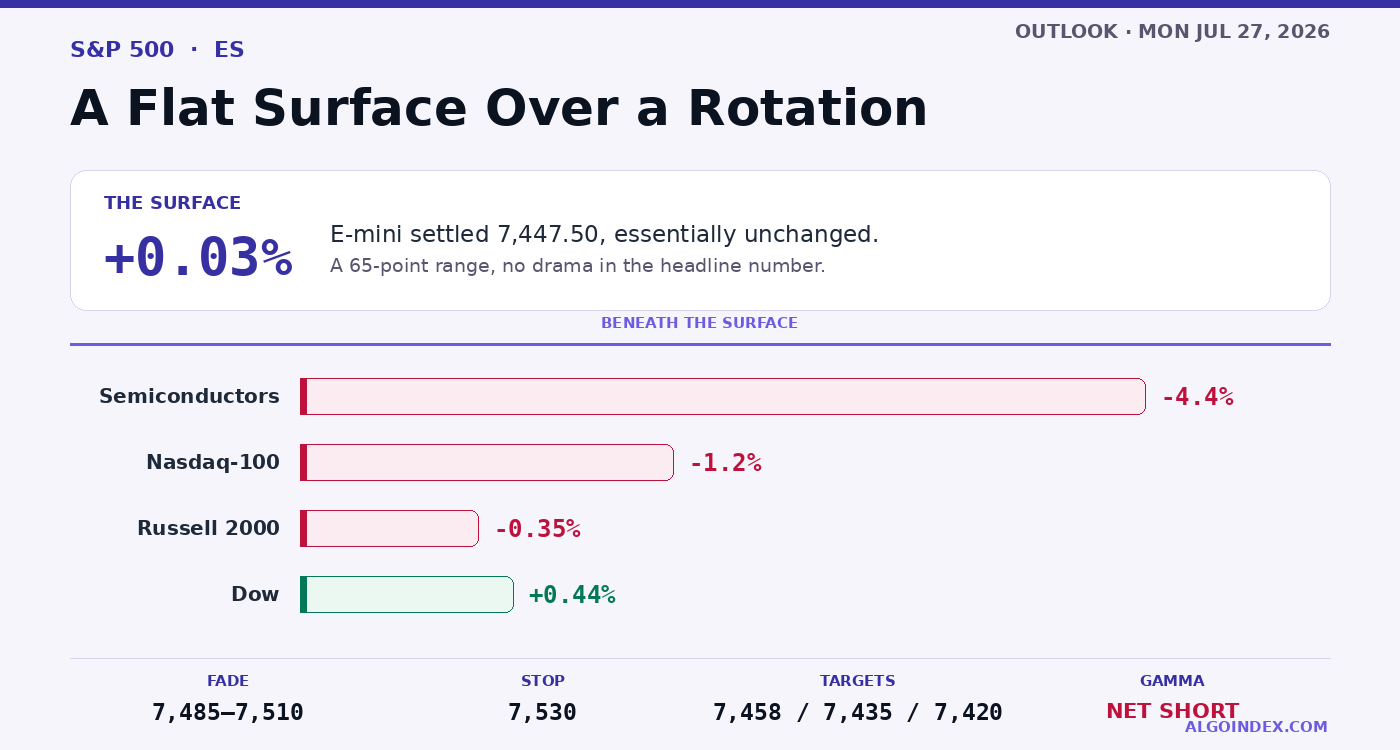
The S&P 500 closed flat while chips fell 4.4 percent and money rotated into value, leaving the index pinned and its leadership thinner. Dealer gamma is net short and turns pro-cyclical below 7,400 cash. Fade 7,485 to 7,510; a break of 7,435 opens 7,393 and the 7,357 low.
The 60-second read
The S&P 500 closed Friday almost exactly unchanged, the September E-mini closing at 7,447.50, a gain of 2.50. That calm is a costume. Underneath, chips fell about 4.4 percent, the Nasdaq-100 shed 1.2 percent while the Dow added 0.44, so this was a rotation out of crowded mega-cap technology into value and cyclicals that left the cap-weighted index pinned while its growth engine weakened. The E-mini now sits beneath its 5-day, its 20-day and its 50-day lines but well over the 100- and 200-day, a pullback inside a longer uptrend. Dealer books have flipped to net short gamma, and below 7,400 cash the hedging turns pro-cyclical. All of it sets up into one of the heaviest weeks of the quarter, a policy decision, growth data, the monthly inflation print, plus four giant technology names reporting Wednesday and Thursday. We lean defensive: fade the band from 7,485 up to 7,510, and treat a clean loss of 7,435 as the signal for something deeper.
A flat close isn't the same as a still one. Friday’s index level barely moved, but what moved beneath it changed the character of this market. Thursday’s note had the market breaking below its average shelf; Friday it stopped falling at the index level while the damage kept moving underneath.
The intraday path tells the story better than the settle. The contract opened around 7,450, pushed into the 7,490s in the morning, then rolled over through the afternoon as the hedging picture soured, swinging from roughly plus 4 billion of delta to minus 4 billion across late morning into mid-afternoon. The index shed roughly 78 basis points in those two hours before buyers returned near the bell to lift the settle to unchanged. Across the week the E-mini still leaked about 50 points lower.
A flat surface over a rotation
+0.03%
E-mini, the surface
-4.4%
Semiconductors
-1.2%
Nasdaq-100
+0.44%
Dow
The index held while its leadership rotated out. That supports the surface for a while, and it thins what carries the market higher.
The rotation is the risk, not the relief
Money leaving semiconductors for value and cyclicals looks healthy on a breadth screen, and in the short run it is, as far as it goes: the Dow up, the index flat, no drama in the headline number. The catch is what it does to concentration. A cap-weighted index carried by a handful of giant technology names does not need those names to rally to stay up, but it does need them to quit falling. When the place the money rotates into can't hold its own bid, there's nothing left underneath.
The single-name flow was just as lopsided. A single mega-cap maker of electric vehicles drove close to 83 percent of the day's negative equity hedging on longer-dated put buying, while a large enterprise-software name bounced 7 percent off its dealer hedging shelf as longer-dated call demand came in. That's a market picking through individual stories rather than moving as one.
An index can look calm and be fragile at the same time. Rotation holds the surface steady while quietly narrowing what is holding it up, which is exactly the setup that breaks badly when a real catalyst arrives.
Net short gamma, and a line at 7,400
The mechanical picture matters more than usual into next week. Dealer books have flipped to net short gamma, call gamma around 3.15 billion set against put gamma near minus 4.25 billion, for a net negative notional around 1.6 billion. Above roughly 7,400 on the cash index, dealer hedging still works as a stabilizer and dampens moves. Below it, the hedging flips pro-cyclical: dealers sell into weakness and the decline feeds itself. In E-mini terms that line sits around 7,435.
Friday’s trade was shaped by exactly this machinery. A large same-day iron condor set at 7,470 and 7,475 up top, 7,345 and 7,350 beneath, compressed the intraday swing and effectively drew the day’s band. Those positions expire; the structure they imposed doesn't carry into Monday.
The market may be underpricing the week
Here's the detail worth pausing on. Event-week implied volatility reads roughly 13.5 percent for Wednesday and 15.2 percent for Thursday, while the forward measure for those very same sessions runs far higher, 19.6 percent and 21.8. That gap says the options market has not yet fully priced the risk it knows is coming. With a policy decision, growth data, the monthly inflation print, and four giant technology reports landing in 48 hours, a volatility index at 18.57 looks like a market that is not adequately hedged.
The volatility-of-volatility measure near 100.7 hints that some desks see it too, hedging demand building underneath a placid surface. Monday itself is tame by comparison: one durable-goods report, two note auctions, no mega-cap earnings. It's a positioning session, not a catalyst.
The band and the base: 7,510 above, 7,435 below
Two zones frame Monday. Overhead, the band from 7,485 up to 7,510 stacks the first pivot resistance, a deviation band and Friday’s high, with the heavier moving-average shelf and the 7,515 risk-pivot just above that. Reclaim and hold 7,515 and the near-term dealer read flips constructive, opening the shelf that runs 7,534 up to 7,550. Until then, rallies into that supply are there to be sold.
Beneath price, the 7,435 base is the number that matters, the E-mini equivalent of the 7,400 cash line where hedging turns pro-cyclical. Lose it with conviction and 7,393 comes into play, then the 7,355-to-7,357 zone where the third pivot support meets the one-month low.
The trade
The base case is a fade: sell a rejection of 7,485 to 7,510 after the 09:45 gate, stop if it reclaims and holds over 7,530, scaling down to the 7,458 pivot, then the 7,435 base, then 7,420. That runs roughly 1:1.2 to the first target and about 1:2.9 to the last. A thin-calendar Monday favors mean reversion inside the range, and the overhead grouping is dense enough to lean on.
The alternate is the higher-energy path: if 7,435 gives way in the cash session, look for follow-through into 7,393, then 7,355, with 7,458 reclaimed as the stop. Skip the fade entirely if price opens over 7,515 and stays there, skip the breakdown if price is still above 7,445 at midday, and cut size for the pre-decision environment. Nothing in this setup is worth carrying through a weekend geopolitical shock or an outsized reaction to the durable-goods print.
The complete data picture
Every number behind Monday’s plan, charted first; the full numeric reference follows underneath.
CHARTED
Level map
CME S&P 500 E-mini, September front month · every reference from the review, to scale
BELOW 7,435: PRO-CYCLICAL 7,100-7,435ABOVE THE PIVOT: CONSTRUCTIVE 7,515-7,720FADE-THE-RALLY SUPPLY BAND 7,485-7,510
The E-mini settled 7,447.50, effectively flat, boxed between a dense 7,485-to-7,510 supply band and the 7,435 line where dealer positioning turns pro-cyclical. Reclaiming the 7,515 risk-pivot flips the read constructive; losing 7,435 opens 7,393 and the 7,357 one-month low.
The split beneath a flat index
A rotation day, not a calm one
The headline calm hid a sharp split. Chips fell about 4.4 percent and the Nasdaq-100 dropped 1.2 percent while the Dow rose 0.44 percent, so money rotated out of crowded mega-cap technology into value and cyclicals. That keeps the cap-weighted index anchored at the surface, but it thins the leadership that carried the market higher.
Moving-average stack
Below the short and medium lines, above the long ones
Against the 7,447.50 settle the 5-day at 7,492.55, the 20-day at 7,535.49 and the 50-day at 7,535.54 all sit overhead as resistance, while the 100-day at 7,254.51 and the 200-day at 7,123.69 hold up the longer-term scaffolding. Below the short and intermediate averages but above the long-term ones is the signature of a corrective pullback inside a primary uptrend, not a reversal.
Momentum
Soft, but nowhere near washed out
The 14-day relative strength at 43.57 and the 9-day at 38.62 sit below the midline but well clear of oversold, and short stochastics near 24 to 31 percent are approaching without confirming. The directional study shows a 14-day index of 20.57 with the negative line at 23.15 over the positive at 10.23, a modest bearish trend on the shorter horizon. The composite reads a 24 percent sell tilt.
Expected range
A one-ATR envelope around the settle
The 14-day average true range is 89.73 points (1.20 percent), the 9-day 86.62 and the 20-day 92.02, with average daily range near 80.71 and 14-day historic volatility near 9.8 percent. That frames a typical envelope of roughly 7,360 to 7,535, and scaled modestly for pre-decision positioning, a Monday band of about 7,400 low, 7,450 mid and 7,510 high.
Primary setup
Fade the supply band while below the risk-pivot
Short-side interest on a rejection of 7,485 to 7,510 after the 09:45 gate, stop on a sustained reclaim above 7,530. Targets the 7,458 pivot, then the 7,435 base, then 7,420. A decisive loss of 7,435 during regular hours flips to the breakdown continuation toward 7,393 and 7,355, using a reclaim of 7,458 as the stop. Reduce size given the pre-decision environment.
Dealer positioning
Net short gamma, with the cushion gone below 7,400 cash
Dealer gamma is net short: call gamma near 3.15 billion against put gamma near negative 4.25 billion, a net negative notional around 1.6 billion. Above roughly 7,400 cash, hedging still dampens moves; below it, flows turn pro-cyclical and can accelerate a decline. Friday’s real-time hedging flow swung from about positive 4 billion to negative 4 billion before closing near negative 1.6, and a large same-day iron condor at 7,470/7,475 over 7,345/7,350 effectively defined the day’s band. Implied-volatility rank sits near 33 percent with an implied daily move around 72 cash-index points.
The week ahead
All times Eastern · Monday is the calm before a very heavy week
Monday is data-light and earnings-light. The one first-order US input is the 08:30 durable-goods report (forecast plus 1.5 percent against a prior negative 4.5). The week then turns heavy: a policy decision Wednesday with Microsoft and Meta, growth and inflation data Thursday with Apple and Amazon, and a Bank of Japan decision Friday.
Full numeric reference , every remaining figure from the review
Contract
CME S&P 500 E-mini front month, September. Review prepared Friday evening July 24 for the Monday July 27 regular session. Levels are E-mini with cash-index equivalents where relevant; the two domains carry an approximate 35-point basis on the day.
Session prints
The September E-mini settled 7,447.50, up 2.50 points (0.03 percent), after opening near 7,450.50, reaching 7,496.50 and dipping to 7,431.50, a 65-point range. The cash index closed near 7,412, below the roughly 7,480 dealer risk-pivot. The Nasdaq-100 fell 1.2 percent, the Dow rose 0.44 percent, the Russell 2000 fell 0.35 percent, and semiconductors dropped about 4.4 percent. The five-day change is negative 50.25 points (0.67 percent). Cash-index hedging flow swung from roughly positive 4 billion to negative 4 billion between late morning and mid-afternoon, coinciding with a 78 basis-point decline between 12:30 and 2:30 PM ET.
Range context
The one-month high is 7,632.00 and the one-month low 7,357.25, placing the settle in the lower-middle of that band. The 52-week high of 7,693.75 is about 3.2 percent overhead; the 52-week low of 6,401.75 sits 16.3 percent below; the 13-week low is 7,187.00. The intermediate structure shows a lower-high sequence off 7,632 with failed rallies beneath the 7,530 to 7,545 shelf; near-term swing pivots sit around 7,491 and 7,483 above and 7,419 below.
Moving averages
Against the 7,447.50 settle: the 5-day at 7,492.55, the 20-day at 7,535.49 and the 50-day at 7,535.54 all sit overhead as resistance, while the 100-day at 7,254.51 and the 200-day at 7,123.69 provide the longer-term scaffolding. Price below the short and intermediate averages but above the long-term ones is the signature of a corrective pullback inside a primary uptrend.
Oscillators and trend
The 14-day relative strength reads 43.57 and the 9-day 38.62, both below the midline but clear of oversold. Short-timeframe stochastics near 24 to 31 percent are approaching but not confirming oversold. The 14-day directional index is 20.57 with the negative line at 23.15 above the positive at 10.23, a modest bearish trend on the shorter horizon. The multi-indicator composite reads 24 percent sell across thirteen studies.
Volatility
The 14-day average true range is 89.73 points (1.20 percent), the 9-day 86.62, the 20-day 92.02, with a 14-day average daily range of 80.71 and 14-day historic volatility near 9.8 percent. A one-ATR band around the settle frames roughly 7,360 to 7,535. Monday's expected band runs about 7,400 low, 7,450 mid and 7,510 high, a roughly 110-point envelope consistent with the 14-day range near 90 points scaled modestly for pre-decision positioning. The volatility index eased to 18.57 (down 0.64 percent) with the volatility-of-volatility measure near 100.7, an elevated read. Implied-volatility rank sits near 33 percent and the options-implied daily move is about 72 cash-index points.
Key levels
Resistance: the 7,458.50 daily pivot; 7,485.50 first pivot resistance with the 7,496.14 one-SD band and the 7,496.50 session high (a dense 7,485 to 7,500 supply band); then the 9-day crossing near 7,519, the 40-day near 7,534 and the 18-day near 7,545 alongside the 7,523.50 second pivot and the 7,515 dealer risk-pivot (about 7,480 cash); then 7,550.50 third pivot and the 7,565 intermediate top. Support: the 7,445.00 prior close and 7,431.50 session low; 7,420.50 first pivot support with the 7,419 swing reference; the 7,435 line (7,400 cash) where positioning flips increasingly negative; then 7,393.50 second pivot, 7,378.71 two-SD, 7,355.50 third pivot and the 7,357.25 one-month low. Computed target price 7,425.58.
Options and dealer positioning
Dealer gamma is net short: call gamma near 3.15 billion against put gamma near negative 4.25 billion, a net negative notional around 1.6 billion. Above roughly 7,400 cash, hedging dampens moves; below it, flows turn pro-cyclical. Friday's hedging flow swung from about positive 4 billion to negative 4 billion before closing near negative 1.6 billion, driven by longer-dated call selling and short-dated put selling. A large same-day iron condor at 7,470/7,475 over 7,345/7,350 compressed intraday volatility and defined the band. The cash-index dealer map reads resistance at 7,460, 7,500, 7,530, 7,575 and 7,600; the risk-pivot at 7,480; support at 7,480, 7,400 and 7,300. Fixed-strike implied volatility fell 0.7 to 3.0 points across the curve. Event-week implied volatility reads about 13.5 percent for July 29 and 15.2 for July 30 while forward implied volatility for those dates is 19.6 and 21.8, suggesting event risk may be underpriced. Based on the PM desk note dated July 24 at 5:18 PM ET.
Macro drivers
The dollar index was flat near 101.47 and the 10-year yield held around 4.68 percent, easing modestly. Semiconductors fell roughly 4.4 percent, with a double-digit price-increase announcement from a major chipmaker underscoring margin and demand crosscurrents. One mega-cap electric-vehicle maker accounted for roughly 83 percent of the negative equity hedging flow on longer-dated put buying, while a large enterprise-software name rebounded 7 percent off a dealer hedging shelf. Crude fell about 3.1 percent to roughly 89.31, gold rose 0.5 percent to about 4,070, and Bitcoin slipped 1.4 percent. Geopolitical headlines stayed heavy (coalition strikes on Houthi sites, Iran messaging, tariff commentary toward Canada, a potential Saudi nuclear arrangement) without producing a risk-off equity move. Weekly futures positioning for the period ended July 21 was released after the close.
Setup and paths
Primary fade: sell a rejection of 7,485 to 7,510, stop on a sustained reclaim above 7,530; T1 7,458 (daily pivot), T2 7,435 (support base and negative-gamma inflection), T3 7,420 (first pivot support); about 1:1.2, 1:2.3 and 1:2.9 from the mid-entry. Alternate breakdown: a conviction loss of 7,435 targets 7,393 then 7,355, with a reclaim of 7,458 as the stop. Paths: A range consolidation 55 percent (oscillate 7,435 to 7,510), B downside break 25 percent (lose 7,435 toward 7,393 and 7,355), C risk-pivot reclaim 20 percent (above 7,515 opens the 7,534 to 7,550 shelf). Skip the fade if price opens and holds above 7,515; skip the breakdown if price holds above 7,445 into midday; no entries before 09:45 ET; reduce size for the pre-decision environment.
Calendar
04:00 ET German business-climate and expectations surveys, the primary European pre-market driver; 08:30 ET US durable goods orders (forecast plus 1.5 percent versus a prior negative 4.5) and core durable goods (forecast plus 0.9 percent), the one US release that can move the open; 11:30 ET 2-year note auction; 13:00 ET 5-year note auction. No mega-cap earnings Monday. The week's dominant events land Wednesday (a policy decision plus a Governor appearance, with Microsoft and Meta reporting) and Thursday (quarterly growth data and monthly inflation, with Apple and Amazon), followed by a Bank of Japan decision Friday.
AlgoIndex publishes institutional-grade reviews on ES, NQ, GC, and CL, built on professional-grade market data and our own analysis, priced for individual traders.