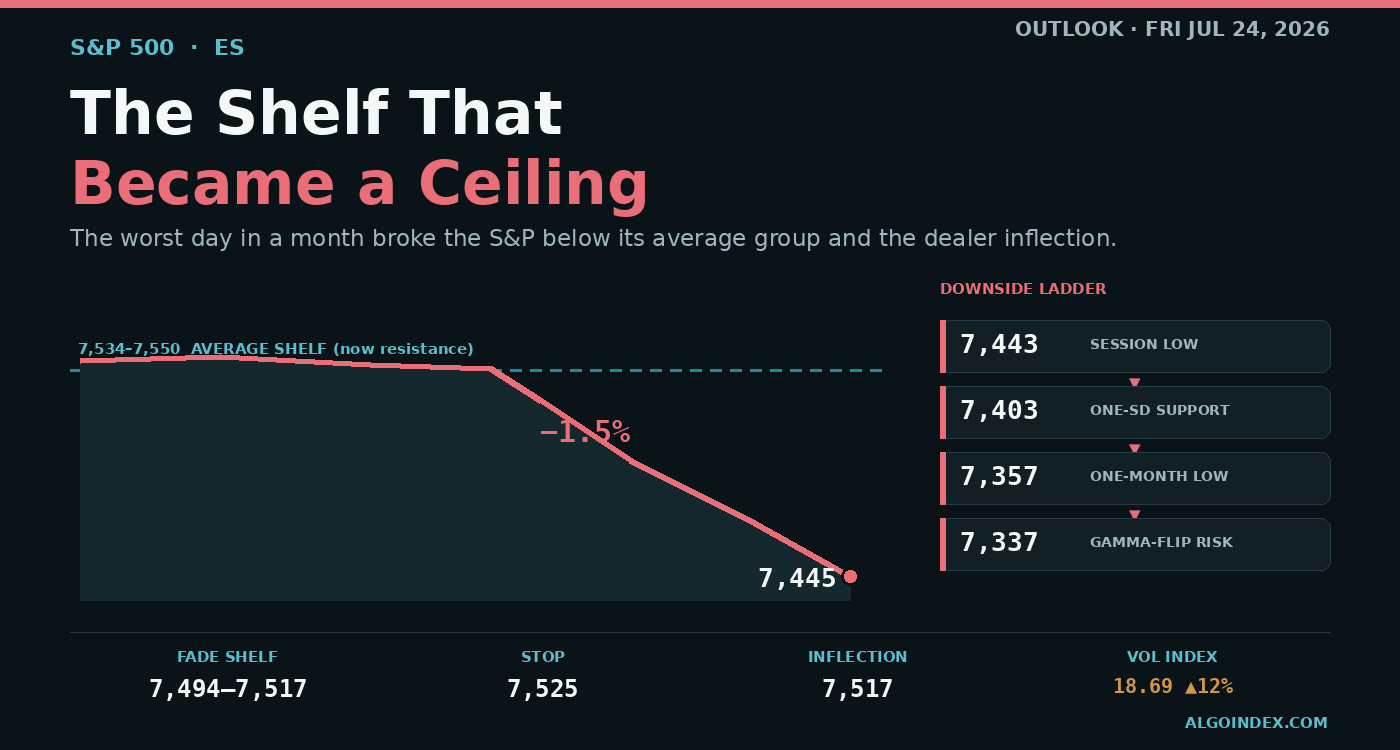
The S&P 500 fell about 1.5 percent in a risk-off session as a mega-cap AI-spending repricing and an oil spike broke price below its average shelf and the 7,480 dealer inflection. Lean short: fade rallies into 7,494 to 7,517 toward 7,443 and 7,403; a reclaim of 7,517 neutralizes it.
The 60-second read
The S&P 500 had its ugliest day in about a month on Thursday. The September E-mini settled near 7,445, off roughly 1.5 percent, and the cash index closed 7,408.30, down 1.21 percent, in a real risk-off session, not a rotation. Two forces fed each other: a violent repricing of the biggest technology names on artificial-intelligence spending worries, and a crude-oil spike tied to Middle East conflict risk. The Nasdaq-100 took the worst of it, down about 2.26 percent, its steepest drop since the April 2025 tariff shock. Price broke below its clustered short and medium averages and closed under the 7,480 dealer inflection, which puts the market on its back foot. We lean short into Friday, fading rallies into the 7,494-through-7,517 shelf, mindful that a thin-calendar session and stretched near-term readings still allow a sharp bounce if oil eases.
This was a change of character, not just a down day. For weeks the market chopped sideways near its highs. Then it broke, and the way it broke matters more than the size of the drop. Wednesday’s note had it pinned at 7,500 into the earnings, with the options structure holding the strike; the reports landed and the pin gave way.
Look at what led the decline. The very names that carried the whole climb turned into the center of the selling, and the damage was concentrated, not broad-based rotation. That's the signature of a market re-pricing a crowded theme rather than one quietly handing leadership from one sector to the next.
The worst day in a month
-1.5%
E-mini settle
-2.26%
Nasdaq-100
18.69
Volatility index
7,445
ES settle
A close on the lows, below the average group and the dealer inflection, with the volatility index up 12 percent. Defensive, but still above the long-term trend.
A mega-cap repricing, with an oil accelerant
The fulcrum was mega-cap technology and the argument over what all that artificial-intelligence spending will earn. Alphabet slid about 7 percent after lifting its capital-spending plan for the year toward 205 billion, up from 190 and well over twice what it spent last year, and that reignited the worry that the payoff on that outsized spending may let shareholders down. Tesla shed 14 to 16 percent on a report that paired falling profit with its own spending surge. Together the biggest technology names had their ugliest run in over a year, since the April 2025 tariff rout, and about three-quarters of the index hedging came from that group.
The second engine was energy. September crude soared more than 6 percent above 90 on hardening conflict rhetoric around the Strait of Hormuz, now up about 28 percent since July began. That matters for stocks in two ways at once: it lifts inflation expectations and it taxes growth, which is why an oil spike and a technology unwind hit the market together rather than offsetting.
When the volatility index jumps and crude soars but gold eases and yields firm, the havens are telling you this is not the usual flight to safety. It's an energy-inflation shock layered onto a crowded technology unwind.
The shelf that became a ceiling
The technical damage is clean and quick. Price closed below the tight band of short and medium averages, the 9-, 20-, 40- and the 50-day lines all packed into a narrow 7,534-to-7,550 band, and that band now becomes the wall any recovery has to climb rather than the base it used to lean on. The daily candle was a wide bearish bar that shut on its lows and pushed past the prior week’s low, a near-term shift of character lower.
It's not a reversal, though, and that distinction is the whole trade. The 100-day near 7,249 and the 200-day near 7,121 sit far below and still rising, so the primary uptrend's intact even as the medium-term one pauses. This is the familiar shape of a hard pullback inside a bull run: the short and medium averages break, the long-term ones stay untouched. What flips that read is acceptance below the 7,357 low.
The line that matters: 7,480 cash, 7,517 on the E-mini
Everything mechanical turns on the dealer inflection. The cash index closed under 7,480, the level that separates a constructive posture above from a defensive one below, and in E-mini terms the line to reclaim is 7,517. Net dealer gamma is still positive on paper. But the cushion is stranded: the stabilizing level now sits about 170 points above the market, no longer underneath price. The zone that would turn the hedging pro-cyclical is 7,300 cash, roughly 7,337 on the E-mini; lose it and moves start to feed on themselves.
Overhead, the 7,494-through-7,517 shelf is where rallies are there to be sold until the inflection is reclaimed, backed by the heavier 7,525-to-7,538 supply where the average group sits. Beneath, the 7,443 session low is the first trigger, then 7,403 and the 7,357 one-month low.
The trade
The base case leans short: fade a rejection of the 7,494-through-7,517 shelf after the 09:45 gate with a stop above 7,525, or press a confirmed 30-minute hold under 7,442, risk above 7,462. Scale down to 7,443, then 7,403, then the 7,357 low, with 7,337 the extension if dealer gamma flips negative. The reward against risk runs roughly 1:2 to the first target and about 1:4 to the last from the fade, so selling the bounce beats chasing the break.
The counter-trade's real and worth naming. This is a data-light Friday whose one scheduled catalyst is the 09:45 flash purchasing-manager batch, and short-term readings are stretched. A firm print or an easing in oil can spark a fast short-covering bounce back up into the 7,494-through-7,517 zone, where sellers should re-engage, so a nimble long into the inflection is viable as a fade of an oversold market, not a trend position. Above all, a 30-minute close back over 7,517 says stand aside: the bearish structure is gone.
The complete data picture
Every number behind Friday’s plan, charted first; the full numeric reference follows underneath.
CHARTED
Level map
CME S&P 500 E-mini, September front month · every reference from the review, to scale
BELOW THE LOW: ACCELERATION RISK 7,150-7,443ABOVE INFLECTION: TONE IMPROVES 7,517-7,720FADE-THE-RALLY SHELF 7,494-7,517
Thursday broke hard below the prior-week low and closed on the lows near 7,445, under the 7,517 dealer inflection. The 7,494 to 7,517 shelf is the fade zone; a break of the 7,443 session low opens 7,403 then 7,357, and 7,337 is where dealer hedging could turn pro-cyclical and amplify the drop.
Moving-average stack
The medium-term shelf flipped from support to a ceiling
Price at 7,445 has dropped below the tightly grouped 9, 20, 40 and 50-day averages, all bunched in a 7,534 to 7,550 shelf that now caps any recovery. It still holds well above the 100-day at 7,249 and the 200-day at 7,121, both far below and rising, so this is a sharp pullback inside a primary uptrend, not a trend reversal, at least not yet.
Where the damage was
A mega-cap repricing, not a broad rotation
The selling concentrated in the names that led the advance. Alphabet fell about 7 percent on a lifted capital-spending plan near 205 billion, Tesla dropped 14 to 16 percent, and roughly three-quarters of the index hedging flow came from the mega-cap group. Energy was the lone green sector as crude surged; this was a defensive repricing, not a healthy handoff.
Momentum
Rolled over into a developing downtrend
The 14-day relative strength has fallen near 43 and is declining, with room before an oversold washout. The directional system has turned bearish, the negative line near 24.4 well above the positive near 10.8, and the composite reads about 24 percent buy, roughly a 76 percent sell tilt, with the short-term component near 80 percent sell. Momentum has genuinely shifted lower.
An energy-inflation selloff, not a flight to safety
The cross-asset tell
The configuration was unusual: the volatility index jumped 12.3 percent to 18.69 and crude soared more than 6 percent above 90, yet gold eased and Treasury yields firmed. Havens did not catch a bid, which says the move was an energy-inflation and technology-repricing event rather than the usual rush to safety.
Primary setup
Fade the rally shelf, or press the break
Short-side interest on a rejection of 7,494 to 7,517 after the 09:45 gate, stop above 7,525; or press a 30-minute acceptance below 7,442 with a stop above 7,462. Targets 7,443, then 7,403, then the 7,357 one-month low, with 7,337 the extension if dealer gamma flips negative. A 30-minute close back above 7,517 neutralizes the bearish read.
Dealer positioning
A positive-gamma cushion, but it sits above the market
Net dealer gamma is still positive on paper, call gamma near 6.32 billion against negative 3.01 billion in puts, but the stabilizing level sits about 170 points above Thursday’s close, so the cushion is no longer beneath price. With the cash index below its 7,480 inflection and the focus shifting to the 7,300 zone, a further push could turn dealer gamma negative and open the door to larger swings. One-month implied volatility near 13.3 percent against realized near 9.3 keeps protection expensive.
Friday’s calendar
All times Eastern · one first-order print, then momentum
The single first-order event is the 09:45 flash purchasing-manager batch (manufacturing near 54.4, services near 51.5): a same-day growth read that can move the market either way and carries the session’s best trend potential. The heavier events, the July 29 policy meeting with Microsoft and Meta and July 30 growth data, sit the following week.
Full numeric reference , every remaining figure from the review
Contract
CME S&P 500 E-mini front month (ESU26). Review prepared Thursday evening July 23 for the Friday July 24 regular session. Levels are ES-domain with cash equivalents where relevant (ES trades at roughly a 37-point premium to cash).
Session prints
The September E-mini settled near 7,445.00, down about 1.50 percent; the cash index closed 7,408.30, off 90.66 points or 1.21 percent, the sharpest single-session decline in about a month. The Nasdaq-100 fell roughly 2.26 percent, its heaviest day since the April 2025 tariff selloff. The Globex reopen held a narrow 7,442.75 to 7,454.00 band, last near 7,447. The heaviest selling arrived in the first 90 minutes, consistent with roughly 4 billion of net equity selling concentrated early. Wednesday's close was near 7,557.
Range context
Lower highs since the early-June peak near 7,694 (the 52-week high), a distribution phase in the 7,530 to 7,632 zone through mid-July, then Thursday's wide bearish bar closing on its lows and pushing through the prior week's low near 7,475. Range position sits in the lower third of the one-month band (7,357 to 7,632). The 4-hour structure printed a break of structure lower from 7,540 to the 7,442 session low before a shallow bounce.
Moving averages
Price at 7,445 sits below the 9-day near 7,537, the 18-day near 7,550, the 20-day at 7,534, the 40-day near 7,538 and the 50-day at 7,536, all grouped in a tight 7,534 to 7,550 shelf that now caps recovery attempts. The 100-day at 7,249 and the 200-day at 7,121 remain far below and rising, keeping the primary trend intact: short and medium averages breached, long-term averages untouched.
Oscillators and trend
The 14-day relative strength has fallen near 43 and is declining, with room before oversold. The directional system is bearish: the 14-day directional index near 19 with the negative line at 24.4 well above the positive at 10.8, and the 9-day near 25 with a negative reading close to 27. The multi-indicator composite reads about 24 percent (a roughly 76 percent sell tilt), with the short-term component near 80 percent sell and the longer-horizon model neutral.
Volatility
The 14-day average true range is near 91.6 points (about 1.23 percent), the 9-day 89.3, the 20-day 93.4, with average daily range near 82. Dealer-derived options imply a one-day move of roughly 63 points on the cash index, about 0.85 percent. A reasonable one-sigma band for Friday is on the order of 80 to 92 points around 7,445, skewed to the downside given the risk-off close and rising hedging demand. The volatility index closed near 18.69 (up 12.3 percent), its second-order gauge near 102 (up about 7 percent).
Key levels
Resistance (ES / cash): 7,462 to 7,469 (7,425 to 7,432, retracement plus daily pivot); 7,487 to 7,504 (one and two-SD); the 7,517 dealer inflection (7,480, the pivotal line); the heavy 7,525 to 7,538 shelf (the moving-average group and first pivot) backed by the 18-day near 7,550; then 7,575, 7,606, the one-month high 7,632, 7,663 and the 52-week high 7,694. Support: the 7,443 session low (7,406) and the 7,433 target; 7,403 to 7,407 (one-SD and implied-move low); 7,388 (first support pivot), 7,373 (three-SD), 7,357 (one-month low); 7,337 (7,300 cash, the gamma-flip risk zone) and 7,331 (second support pivot); then 7,250 (100-day) and 7,187 (13-week low). Cash equivalents run about 37 points lower: resistance 7,425 to 7,432, 7,450 to 7,467, 7,480, 7,488 to 7,501, 7,513, 7,538, 7,569, 7,595, 7,626 and 7,657; support 7,406, 7,396, 7,366 to 7,370, 7,351, 7,336, 7,320, 7,300, 7,294, 7,213 and 7,150.
Options and dealer positioning
The dealer-positioning surface is the primary flow read. Net gamma is positive on paper, call gamma near 6.32 billion against negative 3.01 billion in puts, but the lower volatility-structure level sits at 7,580 cash, about 170 points above Thursday's close, so the stabilizing positioning is no longer beneath price. The cash index closed below the 7,480 inflection; the focus for Friday shifts to the 7,300 zone, where continued put demand could push dealer gamma negative and open larger swings. Skew rank near 26; one-month implied volatility near 13.3 percent versus realized near 9.3. Put-to-call open interest near 1.28; leveraged funds net-short against a net-long asset-manager base. The session was orderly given the size of the move, the intraday range about 99 basis points. Read based on the evening note dated July 23 at 5:23 PM ET.
Macro drivers
Mega-cap technology was the fulcrum: Alphabet fell about 7 percent after lifting its 2026 capital-spending plan to roughly 205 billion from 190, Tesla dropped 14 to 16 percent, and about three-quarters of index hedging came from that group. Energy was the lone green sector as September WTI soared more than 6 percent above 90, now roughly 28 percent higher than at the start of July. The dollar index firmed near 101.44 and the 10-year yield sits around 4.68 to 4.70 percent; consumer prices have eased to 3.5 percent and producer prices to 5.5. A new set of forced-labor tariffs of 10 to 12.5 percent (including 10 percent on India) adds a trade overhang; oil, gas, fertilizer and foodstuffs were exempted.
Setup and paths
Primary short: fade a rejection of 7,494 to 7,517 (stop above 7,525), or press a 30-minute acceptance below 7,442 (stop above 7,462); T1 7,443, T2 7,403, T3 7,357 with 7,337 the extension if dealer gamma flips negative; about 1:2, 1:3 and 1:4 from the fade. Invalidation on a 30-minute close back above 7,517. Alternate long: on a firm 09:45 PMI and a reclaim of 7,494 to 7,504, toward 7,517 then 7,525 to 7,538, stop below 7,480 (a fade of the oversold condition, not a trend trade). Paths: A bearish continuation about 45 percent (break 7,443 to 7,403 then 7,357), B range and stabilize about 35 percent (hold 7,403 to 7,443), C relief bounce about 20 percent (firm PMI or easing oil lifts to 7,494 to 7,517). Friday expected bands: low 7,400 to 7,405, mid 7,440 to 7,460, high 7,490 to 7,505; overnight around 7,440 to 7,460, with 7,470 the de-escalation drift and 7,420 the downside on another oil leg. No overnight hold; no entries before 09:45 ET.
Calendar
09:45 ET S&P Global flash purchasing-manager indexes (manufacturing forecast 54.4, services 51.5, composite 51.8), the single first-order event; 10:00 ET new home sales (forecast 0.606 million, prior 0.580 million); 11:30 ET remarks from a European Central Bank policymaker; before the bell, second-quarter results from American Express and Verizon. The heavier events sit the following week: the July 29 policy meeting with Microsoft and Meta, and July 30 second-quarter growth data.
AlgoIndex publishes institutional-grade reviews on ES, NQ, GC, and CL, built on professional-grade market data and our own analysis, priced for individual traders.