
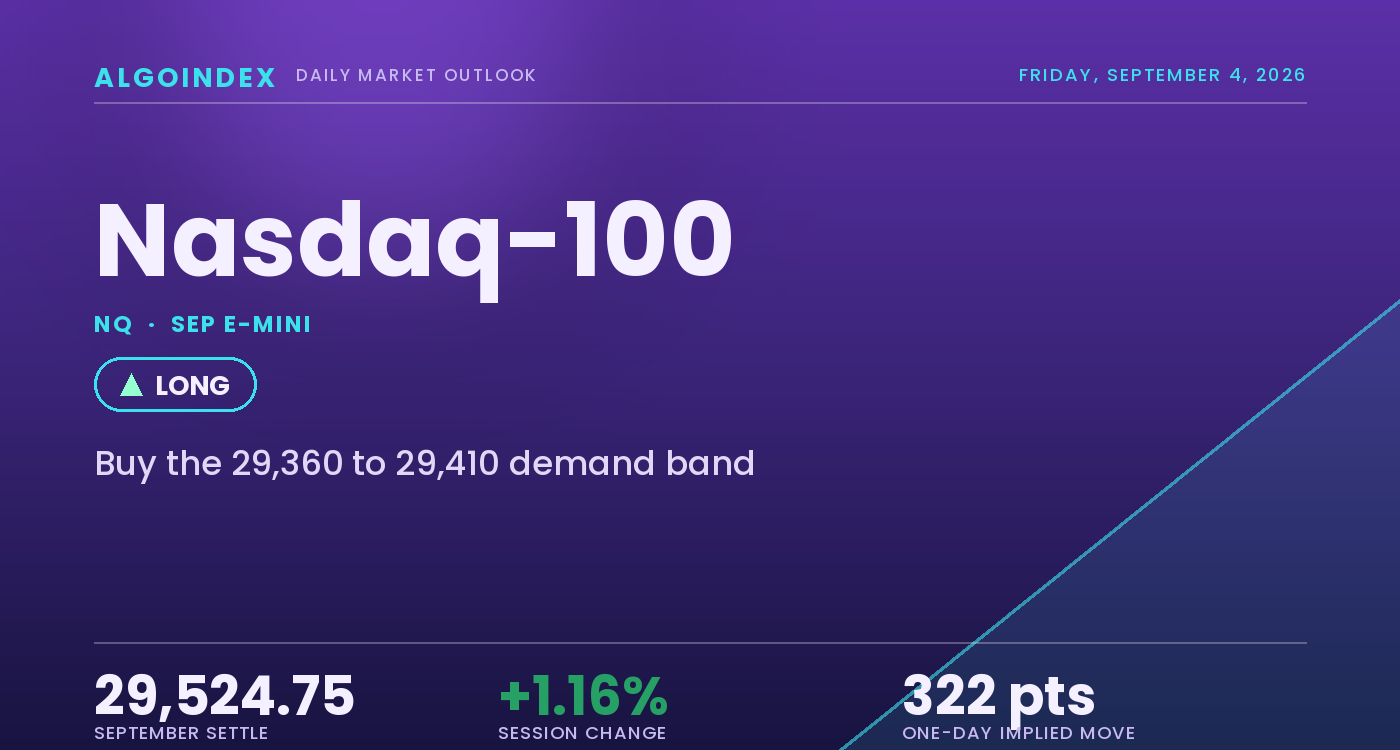
The September Nasdaq-100 settled Thursday at 29,524.75, up 338.50 points or 1.16 percent, after a session that opened at 29,177.00, drifted to a 29,075.00 low before the cash open and closed 59.50 points below a 29,584.25 high in the upper fifth of the day’s range at 88.3 percent. The cash Nasdaq-100 index closed at 29,482.32, also up 1.16 percent, placing the measured futures basis at plus 42.43 points, the conversion used throughout this review. The advance was the strongest single-session gain in roughly a month and it was broad, the S&P 500 adding 1.06 percent and the Dow 1.18 percent. The driver was policy rather than earnings. At 8:30 AM ET a Federal Reserve governor said he was seeing early signs of disinflation and would support holding rates steady if the August inflation report confirms progress toward the 2 percent objective, a remark that cut priced odds of a September increase from roughly 63 percent to about 50 percent, pulled the 10-year yield down 2 basis points to 4.77 percent and sent the dollar index to 99.001, its weakest since May. Volatility collapsed alongside it, the volatility index down 5.79 percent to 14.31.
The structural contradiction into Friday is sharp. Price closed near the top of its range yet 48.91 points beneath the 20-day moving average at 29,573.66, after the 29,584.25 high pushed 10.59 points through that average and failed to hold, the third consecutive lower weekly high after 30,343.00 and 29,811.50. Directional trend strength is close to absent, the 14-day directional index at 14.82. The internal composition argues against a clean growth read: semiconductors added only 0.2 percent and the largest merchant accelerator supplier fell 2.74 percent, while leadership sat in rate-sensitive and liquidity-sensitive names, bitcoin up 5.31 percent to 81,410 and the crypto-linked equities up between 10 and 18 percent. Yet the option surface on the Nasdaq exchange-traded fund carries net negative dealer gamma of roughly 2.97 billion dollars, which amplifies rather than dampens whatever the Friday payroll report produces. The setup that follows buys a pullback into the 29,360 to 29,410 confluence rather than chasing a rejected average, held at reduced size across a first-order release and a three-day Labor Day weekend.
Above every average except the 20-day
The structural read starts with location, and it is constructive with a single obstacle. At 29,524.75 the contract sits above its 5-day average at 29,368.25, its 50-day at 29,373.10, its 100-day at 29,242.77 and its 200-day at 27,413.50, above the year-to-date average at 27,667.81, and beneath only the 20-day at 29,573.66. Price is above every average in the stack except one, the signature of a market whose longer-term uptrend is intact and whose intermediate-term momentum has stalled. The single most important daily-structure fact of the session was the interaction with that 20-day: the high reached 29,584.25, cleared the average by 10.59 points, and the settle closed 48.91 points beneath it. A probe-and-fail at a widely watched average, on declining volume, at the top of an established band, is a rejection until proven otherwise, reinforced by three nearby computed references at 29,545.62, 29,587.38 and 29,626.00. The band from roughly 29,545 to 29,635 is where the intermediate-term question gets answered.
Momentum is neutral without being stretched, which is itself the finding. Relative strength reads 53.13 on the 9-day window, 51.87 on the 14-day after gaining 5.23 on the session, 51.40 on the 20-day and 52.37 on the 50-day, nothing stretched in either direction. Stochastics disagree across horizons: the 9-day raw sits at 67.57 percent against a 39.18 percent smoothed value, the mechanical footprint of a fresh upward thrust, while the 14-day and 20-day raw values both sit at 42.20 percent with smoothed values at 24.43, closer to washed-out than overbought. Trend strength is the decisive input, the directional index reading 18.07 on the 9-day, 14.82 on the 14-day and 13.31 on the 20-day, beneath the twenty threshold at every lookback, with the negative directional indicator above the positive on each window. The multi-indicator composite reads 40 percent buy with weak strength and a strengthening direction, an improvement from an 8 percent sell reading on Wednesday, its short-term components averaging 20 percent buy and its long-term components 67 percent.
The 29,360 to 29,410 confluence anchors Friday
Two structures frame the session. Beneath the market, the band from 29,388 to 29,410 is the densest demand confluence on the board and the location of the entry, four independent references inside 22 points: the computed pivot at 29,394.67, the 9-day average crossover at 29,387.91, the 14-day relative-strength midpoint at 29,404.85 and the 38.2 percent retracement from the four-week low at 29,409.05, with the entry zone extending to 29,360 to capture the 5-day at 29,368.25 and the 50-day at 29,373.10. Beneath it, the 29,329.33 one-standard-deviation support marks where the higher-low ladder built from the 29,075.00 low would be considered broken. Overhead, the first task is a reclaim of the 29,584.25 session high, and above it the 29,626 to 29,635 supply shelf, where the 18-day average, a three-versus-ten-day crossover and the 14-day raw stochastic midpoint converge, is what converts the rejection into a genuine breakout. Friday turns on the 8:30 AM ET employment report, an hour before the cash open.
Buy the pullback, scale at the reclaim, size it down
The plan buys a retracement into the 29,360 to 29,410 band, where four independent computed references converge inside 22 points and the 5-day and 50-day averages sit, leaning on a higher-low ladder from the 29,075.00 low that remains intact and a settle above every moving average except the 20-day. The stop is 29,285, beneath the one-standard-deviation support at 29,329.33 and the 14-day raw stochastic 30 percent level at 29,351.97, roughly 100 points from the 29,385 entry midpoint. Targets run to 29,584 at the session high and the current week high, the level whose reclaim reverses the rejection, then 29,690 at an interior swing high immediately below the paired pivot and one-standard-deviation resistance at 29,714.33 and 29,720.17, then an extended 29,811 at the three-week swing high and the ceiling of the twelve-session band, valid only if the 29,626 to 29,635 shelf clears on expanding volume, for approximately 1 to 2.0, 1 to 3.1 and 1 to 4.3. A sustained thirty-minute close beneath 29,285 breaks the higher-low ladder and shifts the working reference to 29,205 and then the 29,075 low. Two items override the technical structure. An average hourly earnings print of 0.4 percent or higher at 8:30 AM ET revives September increase pricing and removes the discount-rate mechanism that produced the advance, voiding the setup regardless of price. A headline payroll figure deeply negative in the manner of the prior report replaces the policy question with a growth question and is equally disqualifying. Reduced size is appropriate given a net negative dealer gamma position of roughly 2.97 billion dollars on the fund surface, which amplifies the release, and three calendar days of headline exposure into the Labor Day holiday. The higher-conviction structure if the print is hot is the mirror image, a short from 29,690 to 29,720 on a failed test of the paired resistance, stop 29,795, targeting 29,525, 29,410 and 29,330. Our published record lays out how we grade these calls.
A settle above every moving average except the 20-day, with the session high rejected 10.59 points through that average, yet net negative dealer gamma of roughly 2.97 billion dollars on the fund surface that amplifies rather than absorbs. The 29,360 to 29,410 demand confluence is the referee: a pullback that holds it works toward a reclaim of the 29,584.25 high, while a sustained break of 29,285 shifts the reference to the 29,075 low.
A market above its stack but capped by the 20-day is a pullback to buy at the 29,360 to 29,410 confluence, not a rejected average to chase. The edge is a hold of that band above the 29,075 higher-low ladder, and the invalidation is a sustained break of 29,285.
This is the read our members get every session, before the bell, with the levels drawn and the setup defined. See how the same dealer-positioning work turns into systematic signals.
View pricingThe complete data picture
Every number behind Friday’s plan, charted first; the full numeric reference follows underneath.
Full numeric reference, every remaining figure from the review
| Average | Value | Settle vs |
|---|---|---|
| 5-day | 29,368.25 | settle above by 156.50, 0.53 percent |
| 20-day | 29,573.66 | settle below by 48.91, 0.17 percent, the only average overhead and the level rejected Thursday |
| 50-day | 29,373.10 | settle above by 151.65, 0.52 percent |
| 100-day | 29,242.77 | settle above by 281.98, 0.96 percent |
| 200-day | 27,413.50 | settle above by 2,111.25, 7.70 percent, the widest gap in the stack |
| Year-to-date | 27,667.81 | settle above by 1,856.94, 6.71 percent |
| Level | Reference |
|---|---|
| 30,975.50 | two-quarter high, set June 16, a structural rather than tactical reference |
| 30,343.00 | one-month high, set August 17, the origin of the current lower-high sequence, cash 30,301 |
| 29,903.92 | second pivot resistance, above the two- and three-standard-deviation resistances at 29,801.11 and 29,863.22, cash 29,861 |
| 29,811.50 | prior-week high set August 28, the ceiling of the twelve-session band and the extended third target, cash 29,769 |
| 29,765.70 | 38.2 percent retracement of the decline from the four-week high, the first upside trend-change line, cash 29,723 |
| 29,720.17 | one-standard-deviation resistance, paired with the first pivot resistance at 29,714.33 within six points, cash 29,678 |
| 29,690.00 | interior swing high and target two, immediately below the paired pivot and standard-deviation resistance, cash 29,648 |
| 29,635.13 | 14-day raw stochastic midpoint and top of the first supply shelf, cash 29,593 |
| 29,626.00 | 18-day average, the first genuine supply shelf and breakout gate, paired with the three-versus-ten-day crossover at 29,631.04, cash 29,584 |
| 29,584.25 | session high and current week high, target one, the level whose reclaim reverses the rejection, cash 29,542 |
| 29,573.66 | 20-day moving average, 48.91 points above the settle, the only average overhead and the rejection level, cash 29,531 |
| 29,542.00 | next mapped upside gamma reference at the round index level, cash 29,500 |
| 29,524.75 | September settle, the reference point for the session, cash 29,482 |
| 29,509.00 | Globex session high and immediate shelf top, paired with the final-hour low at 29,499.25 and the computed target 29,508.22, cash 29,467 |
| 29,482.00 | Globex session low, a thin-liquidity reference rather than a structural one, cash 29,440 |
| 29,410.00 | demand confluence top and buy-zone top, the 38.2 percent retracement from the four-week low at 29,409.05, cash 29,368 |
| 29,404.85 | 14-day relative-strength midpoint inside the demand band, cash 29,362 |
| 29,394.67 | computed pivot, the centre of the 29,388 to 29,410 demand confluence, cash 29,352 |
| 29,387.91 | 9-day average crossover, the base of the dense demand confluence, cash 29,345 |
| 29,373.10 | 50-day moving average, inside the buy zone, cash 29,331 |
| 29,368.25 | 5-day moving average, inside the buy zone, cash 29,326 |
| 29,360.00 | buy-zone base, the lower edge of the entry, cash 29,318 |
| 29,351.97 | 14-day raw stochastic 30 percent level, cash 29,310 |
| 29,329.33 | one-standard-deviation support, beneath which the higher-low ladder is considered broken, cash 29,287 |
| 29,317.00 | primary gamma concentration strike and call-side ceiling, cash 29,275 |
| 29,285.00 | protective stop, beneath the one-standard-deviation support and the stochastic level, cash 29,243 |
| 29,245.26 | 40-day average crossover, paired with the two-standard-deviation support at 29,248.39, cash 29,203 |
| 29,242.77 | 100-day moving average, 281.98 points below the settle, cash 29,200 |
| 29,205.08 | first pivot support, above the third-standard-deviation support at 29,186.28, cash 29,163 |
| 29,186.25 | Wednesday settle and third-standard-deviation support, cash 29,144 |
| 29,112.00 | derived volatility inflection equivalent, index 29,070, the reference the session low undercut and reclaimed, cash 29,070 |
| 29,075.00 | session low and base of the advance, cash 29,033 |
| 29,042.00 | derived key strike at the round index level, index 29,000, cash 29,000 |
| 28,927.25 | multi-week low set September 2 and base of the twelve-session band, cash 28,885 |
| 28,893.00 | derived dealer gamma flip equivalent, index 28,851, where hedging shifts from dampening to amplifying, cash 28,851 |
| 28,042.00 | derived put-side support base, index 28,000, relevant only on a sustained breakdown, cash 28,000 |
| 27,667.81 | year-to-date average, 1,856.94 points beneath the settle, cash 27,625 |
| 27,413.50 | 200-day moving average, 2,111.25 points beneath the settle, the widest gap in the stack, cash 27,371 |
| 27,201.50 | two-quarter low set July 29, cash 27,159 |
| Metric | Reading |
|---|---|
| Fund and futures surface | fund 30-day implied volatility 17.88 percent against 12.86 percent realised, a 5.02-point premium, with an implied volatility rank of 20.27 percent, a 24.57 percent volatility-forecast rank and a 39.53 percent skew rank; the September futures surface carries 17.32 percent implied volatility with fourteen days to the September 17 expiration |
| Implied one-day move | about 322 points, 1.09 percent, roughly 79 percent of the 406.14-point 14-day average daily range, with the fund surface implying a comparable 1.116 percent or about 329 points |
| Dealer gamma, index context | the broad S&P complex carries positive gamma notional of 189.9 million with a 1.06 tilt, positioned to dampen moves, the direct contrast to the Nasdaq fund |
| Dealer gamma, fund | call gamma negative 322.44 million against put gamma negative 2.65 billion, a net negative of roughly 2.97 billion, a 0.704 tilt and negative 581.9 million notional, positioned to amplify rather than absorb a payroll surprise |
| Options volume skew | fund puts 1.04 million against calls 848,300 for a 1.225 ratio, open-interest put-call 1.33; on the index put volume 8,342 against call volume 6,462 for a 1.291 ratio, open interest 1.232 |
| Index gamma references | volatility inflection index 29,070 near 29,112 futures, gamma flip index 28,851 near 28,893, primary gamma concentration and call ceiling index 29,275 near 29,317, and the put-side support base index 28,000 near 28,042 |
| Flow composition | index-level hedging flow negative 3.5 billion delta from same-day call selling ahead of the weekend, single-stock flow positive 5.4 billion delta from longer-dated call buying, 3.2 billion of it megacap, a rotation signature rather than index accumulation |
| Expiry and basis | top gamma expiration September 17 and top delta expiration June 2027, with the September futures at a 42.43-point premium to the cash index on the measured basis |
| Cohort | Weekly change |
|---|---|
| Dealers and intermediaries | 59,255 long against 122,503 short as of August 25, a net short of 63,248 with the short side up 25,041 |
| Commercial participants | 156,048 long against 193,184 short, a net short of 37,136 with shorts up 22,886 |
| Leveraged funds | 51,841 long against 93,073 short, a net short of 41,232 having cut shorts by 14,188, the largest single change in the report |
| Asset managers | 109,400 long against 36,184 short, a net long of 73,216 |
| Non-commercials and open interest | net long 10,039 after adding 5,106 longs and cutting 15,349 shorts, with total open interest 293,414 contracts |
| Money-market assets | a record 7.98 trillion dollars in money-market fund assets reported during the session, a large pool declining to participate at these levels |
| Input | |
|---|---|
| Federal Reserve policy | a Federal Reserve governor said at 8:30 AM ET he is seeing early signs of disinflation and would support holding rates steady if the August inflation report confirms progress toward the 2 percent objective, cutting priced September increase odds from roughly 63 percent to about 50 percent |
| Rates and dollar | the 10-year Treasury yield fell 2 basis points to 4.77 percent and the dollar index fell 0.58 percent to 99.001, its weakest since May, the primary transmission channel for a long-duration index |
| Semiconductor lag | semiconductors added only 0.2 percent while the index gained 1.16 percent and the largest merchant accelerator supplier fell 2.74 percent, a discount-rate advance the artificial-intelligence hardware complex did not lead |
| Single-stock leadership | software gained roughly 3 percent and the megacap complex roughly 2 percent, with the standout in liquidity-sensitive names as bitcoin rose 5.31 percent to 81,410 and crypto-linked equities rose between 10 and 18 percent, a cloud data-platform gaining 17 percent on results and an electric-vehicle maker 5 percent on a product launch |
| Cross-asset and volatility | the volatility index fell 5.79 percent to 14.31 with the volatility-of-volatility measure at 83.80, gold gained 1.85 percent with futures near 4,524.8, crude added 0.53 percent to 91.78, a falling-dollar, falling-yield, rising-gold and rising-bitcoin configuration that reads as currency debasement rather than growth |
| Geopolitical | the Middle East conflict remains active, with an Iranian spokesman stating after the cash close that recent strikes hit only military targets, and the yen the most direct overnight threat to the carry positioning that supports long-duration equity into a three-day weekend |
| When | Event |
|---|---|
| Thu Sep 3 | the reviewed session, a 1.16 percent advance to 29,524.75 on a Federal Reserve disinflation remark, the strongest single-session gain in roughly a month |
| Fri Sep 4 | the outlook session, the August payroll report at 8:30 AM ET, a 55,000 consensus against a negative 23,000 prior with the unemployment rate held at 4.1 percent, the single first-order input for the next four sessions |
| Mon Sep 7 | the United States market closed for Labor Day, with an abbreviated futures session halting at 1:00 PM ET and futures reopening at 6:00 PM ET under the Tuesday trade date |
| Beyond | an artificial-intelligence summit and a three-year note auction September 8, a device event and a ten-year note auction September 9, then the European Central Bank decision, United States producer prices and the August consumer price report across September 10 and 11 |
| Sep 15 to 18 | the policy decision on September 15 and 16, the largest gamma expiration September 17 and monthly expiration September 18, also the September futures expiration |
The economic releases referenced above are published on the official government calendars below. Price levels are derived from standard technical and statistical methods, and the market read is AlgoIndex's own analysis. How we grade these calls is set out in our performance methodology.
- US Bureau of Economic Analysis, Personal Income and Outlays (PCE)
- US Bureau of Economic Analysis, Gross Domestic Product
- US Bureau of Economic Analysis, release schedule
- US Census Bureau, Advance Durable Goods (M3) release schedule
- US Energy Information Administration, Weekly Petroleum Status Report
- US Department of the Treasury, auction schedule and results
- AlgoIndex performance methodology



