
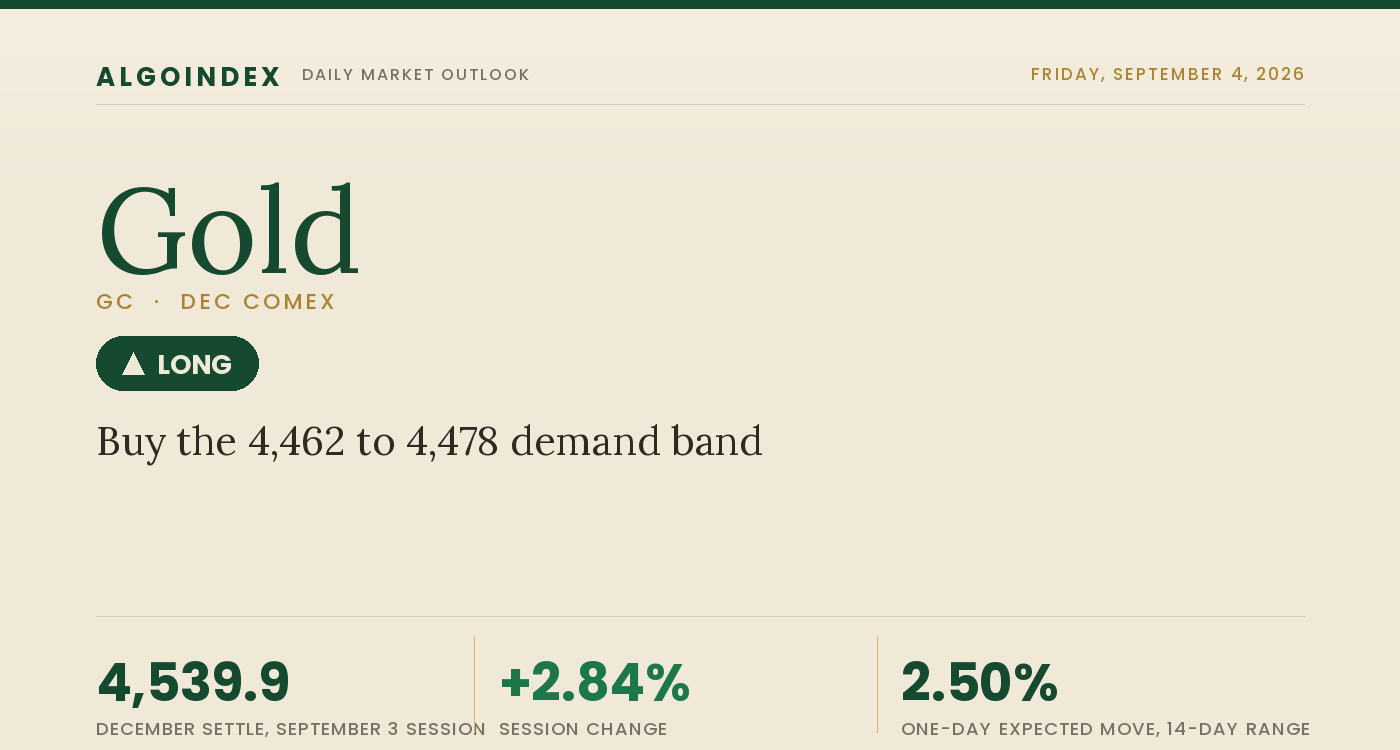
Gold turned in a directional rebound on Thursday, and the strength was in the close as much as the point gain. The December contract settled at 4,539.9, up 125.3 points or 2.84 percent from Wednesday's 4,414.6, after opening near 4,436.4, pressing to a regular-session high of 4,558.5 and holding the advance to finish roughly 86 percent of the way up the 131.8-point band. The settlement held into the daily maintenance break rather than fading, the signature of a session where sellers never regained control after the morning move higher. Volume of 203,265 contracts was healthy for a trending day and open interest of 314,259 pointed to engaged participation rather than a thin squeeze. The driver was monetary rather than defensive: a Federal Reserve governor said at 8:30 AM ET that the data finally show early signs of disinflation and signaled a willingness to keep policy steady, markets read the remarks as dovish, the dollar index slipped 0.57 percent to 99.00 and the 10-year Treasury yield eased toward 4.77 percent. A weaker dollar and softer nominal yields are the two most reliable tailwinds for gold, and both moved in its favor at once.
That the metal rallied while the volatility gauge fell nearly 6 percent to 14.31 and equities gained about 1.06 percent marks this as a rate-and-dollar advance rather than a flight to safety, layered over a standing Persian Gulf risk premium rather than an acute one. The contradiction into Friday is that the rebound sits inside a larger correction. Gold remains about 21.5 percent below its 52-week high at 5,781.8 and has lost 145 points, or 3.11 percent, over the trailing five sessions despite Thursday's surge. Price has reclaimed the 5, 20, 50 and 100-day averages but sits beneath the 200-day at 4,643.0, now the overhead line that matters most, and the multi-indicator composite has swung from 72 percent Buy a month ago through a 16 percent Sell reading last week back to a 24 percent Buy with a strengthening direction, a snapshot of a correction attempting to turn. Everything is subordinate to Friday's 8:30 AM ET employment report, the single first-order event of the session.
A rate-and-dollar rebound that reclaimed four averages beneath the 200-day
The daily picture is a strong bullish body that reclaimed several averages in a single session. Gold cleared the 20-day at 4,516.4 and closed above it, sits just under the descending 9-day reference near 4,566.5, and settled at 4,539.9, roughly 67 percent of the way up the last month's span between the 4,098.1 one-month low and the 4,755.0 one-month high, in the upper third rather than the middle. The settlement sits above the daily pivot at 4,508.4, keeping price on the constructive side of its own session midline, and the reclaim of the 100-day at 4,458.2 alongside the rising 50-day at 4,292.2 well beneath price frames the rebound. The 200-day at 4,643.0 is the single most important overhead reference: a reclaim would argue the correction is over, while rejection there would keep the larger down-leg intact.
Momentum is neutral-to-constructive with room to extend. The 14-day relative strength index reads 55.00, above the midline but well short of overbought, with the 9-day at 52.97 and the 20-day at 54.99. The 14-day stochastic is the more telling read, the percent-K at 24.19 and percent-D at 23.36 both low and turning up while sitting above the conventional 20 boundary, better described as depressed and recovering than as washed out, a constructive posture alongside a strong up-day. The 14-day directional index at 26.73 is rising and signals a strengthening trend, with the positive directional line at 24.03 now edging above the negative at 22.13, an early tilt back toward the upside. The multi-indicator composite reads 24 percent Buy with a strengthening direction, having moved from 72 percent Buy a month ago through a 16 percent Sell last week.
The 4,462 to 4,478 support base and the 4,558 to 4,578 ceiling frame Friday
Two areas frame the session. Beneath the settle, the first support base is the 4,458 to 4,478 area, where the first standard support and 100-day average at 4,458.2 pair with the one-standard-deviation reference at 4,475.0 and the 5-day average at 4,468.3, and it is where a controlled pullback is bought. Above it lies the 4,500 to 4,516 shelf, the daily pivot at 4,508.4 sitting just above the two-standard-deviation reference at 4,500 and just beneath the reclaimed 20-day at 4,516.4. The immediate ceiling is the 4,558 to 4,578 band, where Thursday's regular-session high at 4,558.5 sits beneath the descending 9-day reference at 4,566.5, the line the market must clear to confirm continuation; above it the first standard resistance at 4,590.0 leads to the 4,640.2 second standard resistance, which lands almost exactly on the 200-day at 4,643.0, the most important single reference for whether the broader correction has ended. Beneath price, a decisive loss of the 4,426.7 session low, the 4,414.6 prior settlement and the 4,376.6 second standard support reopens the corrective read toward the 4,326.4 third standard support and the rising 50-day near 4,292.2.
Buy the support base, respect 4,412, keep the employment report in view
The plan buys a controlled pullback into the 4,462 to 4,478 support base, a retest of the first standard support and 100-day at 4,458.2, the one-standard-deviation reference at 4,475.0 and the 5-day at 4,468.3, or a reclaim of that band once Friday's employment reaction settles, rather than chasing the strong close into the 4,558 to 4,578 ceiling. The entry sits below the 4,508.4 daily pivot while the broader bias is constructive above it, so the setup is a tactical buy at deeper support and does not require the pivot to be reclaimed first, though a reclaim would confirm it. The stop is 4,412, below the 4,414.6 prior settlement and the 4,426.7 session-low structure, about 58 points from the 4,470 entry midpoint. Targets run to 4,558 at Thursday's regular-session high and the base of the overhead band, then 4,578 at the upper boundary of the near-term target band, which straddles the 9-day reference at 4,566.5, then an extended 4,643 at the 200-day, the decisive correction marker, worked only if momentum carries through the second target on volume, for reward-to-risk near 1 to 1.5, 1 to 1.9 and 1 to 3.0. One event governs the trade in real time. Friday's 8:30 AM ET employment report, with nonfarm payrolls seen near plus 55,000 against a prior minus 23,000, is the first-order input: a soft or in-line print keeps the dollar heavy and argues for a push through 4,558 toward the 200-day, while a clearly hot print lifts the dollar and yields and presses the metal back toward the 4,458 to 4,475 base and potentially the 4,376.6 second standard support. A hotter-than-expected report that reprices the rate path toward a firmer dollar and rising real yields, or a sharp dollar reversal higher, would negate the long, as would a clear geopolitical de-escalation that lifts risk appetite and the dollar together. Our published record lays out how we grade these calls.
Thursday turned in a directional rebound: a 125.3-point gain to a 4,539.9 settlement near the session high, rate-and-dollar led with the dollar index at 99.00 and the 10-year at 4.77 percent. Price reclaimed the 5, 20, 50 and 100-day averages but sits beneath the 200-day at 4,643.0, the decisive overhead line, and the 4,558 to 4,578 band is the ceiling the advance must convert. Buying a controlled pullback into the 4,462 to 4,478 support base toward that band, with Friday's 8:30 AM ET employment report the first-order event, is the trade.
A rate-and-dollar rebound that reclaimed four averages beneath the 200-day, bouncing into a payrolls print. The edge is buying the 4,462 to 4,478 support base toward the 4,558 to 4,578 band, and a decisive loss of the 4,376.6 second standard support is the line that reopens the correction.
This is the read our members get every session, before the bell, with the levels drawn and the setup defined. See how the same dealer-positioning work turns into systematic signals.
View pricingThe complete data picture
Every number behind Friday’s plan, charted first; the full numeric reference follows underneath.
Full numeric reference, every remaining figure from the review
| Average | Value | Settle vs |
|---|---|---|
| 5-day | 4,468.3 | above by 71.6 |
| 20-day | 4,516.4 | above by 23.5 |
| 50-day | 4,292.2 | above by 247.7 |
| 100-day | 4,458.2 | above by 81.7 |
| 200-day | 4,643.0 | below by 103.1 |
| Level | Reference |
|---|---|
| 5,781.8 | 52-week high, a distant structural ceiling |
| 4,999.9 | 61.8 percent retracement from the 52-week low, a distant upside marker |
| 4,901.0 | 70 percent momentum reference, the extended objective |
| 4,758.0 | half retracement of the 52-week span, a distant upside marker |
| 4,755.0 | one-month high, the extended objective |
| 4,721.8 | third computed resistance pivot |
| 4,682.4 | year-to-date average, well overhead |
| 4,680.0 | moving-average-cross reference |
| 4,643.0 | 200-day average, the decisive correction marker |
| 4,640.2 | second computed resistance pivot, on the 200-day |
| 4,590.0 | first computed resistance pivot |
| 4,578.0 | upper boundary of the near-term target band, the second target |
| 4,566.5 | descending 9-day moving-average reference, the ceiling confluence |
| 4,558.5 | Thursday regular-session high, the base of the overhead band, the first target |
| 4,539.9 | December settle |
| 4,516.4 | 20-day average, reclaimed |
| 4,508.4 | daily pivot point, the constructive line |
| 4,500.0 | 2 standard deviation reference |
| 4,478.0 | top of the support base, the long entry ceiling |
| 4,475.0 | 1 standard deviation reference |
| 4,468.3 | 5-day average, inside the support base |
| 4,462.0 | bottom of the support base, the long entry |
| 4,462 to 4,478 | support base, the long entry, bought once Friday employment reaction settles |
| 4,458.2 | first computed support and 100-day average, the support base |
| 4,426.7 | Thursday regular-session low, the half retracement of the four-week span |
| 4,414.6 | prior settlement |
| 4,412.0 | stop, below the prior settlement and session-low structure |
| 4,376.6 | second computed support, the corrective-read line |
| 4,354.2 | a secondary downside reference beneath the second computed support |
| 4,326.4 | third computed support |
| 4,292.2 | 50-day average, rising beneath price |
| 4,098.1 | one-month low |
| 3,734.9 | 52-week low, the deep backstop |
| Metric | Reading |
|---|---|
| Gold-ETF proxy price | 410.05, up 1.80 percent from a prior 402.78, the positioning reference for the metal |
| Futures-to-proxy multiplier | about 11.07, so the 410 proxy area maps to the 4,540 futures zone |
| Call-side dealer gamma | about negative 428 million, a net short call-gamma posture on the upside |
| Put-side dealer gamma | about positive 153 million, the smaller leg |
| Net configuration | net short gamma on the upside, a posture that can push dealers to chase a continuation higher rather than dampen it |
| Flow balance | call volume of 590,460 dwarfed put volume of 72,370, with the put-to-call open-interest ratio at 0.47, both consistent with demand tilting bullish into the rebound |
| Implied-volatility rank | near 31.5 percent, in the lower third of its trailing range, so options are not yet pricing an outsized move with the employment report one session away |
| Top expiry concentration | the heaviest gamma sits at the September 17 tenor |
| Input | |
|---|---|
| Dollar | the dollar index slipped 0.57 percent to 99.00, the main daily driver working in gold favor as long as it stays capped below the 100 handle |
| 10-year yield | the nominal 10-year Treasury yield eased toward 4.77 percent, down on the day, a softer real-rate backdrop that lowers the opportunity cost of holding a non-yielding asset |
| Fed and policy | a Federal Reserve governor said at 8:30 AM ET that the data finally show early signs of disinflation and signaled a willingness to hold policy steady, read as dovish, and expectations for a September increase were pared back toward a hold, though a separate Fed voice cautioned that underlying inflation has not meaningfully improved |
| Geopolitics | a persistent Persian Gulf risk premium, with the Strait of Hormuz reported constrained pending Iranian conditions, defensive-strike statements from Tehran and a prior drone strike on a Saudi refinery, a standing safe-haven and inflation-hedge underpin |
| Crude oil | US crude settled firm at 91.30 and the international grade near 95.52, with record retail diesel pricing underscoring the energy-cost channel that feeds the inflation-hedge case |
| Equities and volatility | the broad-market volatility gauge fell nearly 6 percent to 14.31 and equities rose about 1.06 percent, an unusual pairing with a gold gain that confirms a rate-and-dollar bid rather than a fear trade |
| Silver and the metals complex | silver outperformed with a 3.42 percent gain to 67.71 against gold 2.84 percent, pulling the gold-silver ratio down to about 67.0, a risk-on tilt within the metals that often accompanies a broad precious-metals bid |
| Central-bank demand | no fresh official-sector purchase data crossed this session, leaving structural reserve accumulation a slow, supportive background bid rather than a Friday catalyst |
| Positioning | no new weekly positioning report was released, so the latest speculative-length read is stale rather than freshly confirmed, while the composite momentum read at 24 percent Buy with a strengthening direction is the cleaner proxy for the sentiment shift |
| When | Event |
|---|---|
| Fri Sep 4 | the US employment report at 8:30 AM ET, nonfarm payrolls seen near plus 55,000 against a prior minus 23,000, the decisive forward catalyst for the rate path |
| Sun Sep 6 | the metals contract reopens on Globex at 6:00 PM ET after no Friday evening reopen, carrying the payrolls verdict into the new week |
| Mon Sep 7 | Labor Day, with US cash markets closed and the metals contract trading an abbreviated holiday session before the regular schedule resumes that evening |
| Sep 17 | the heaviest gamma and delta expiration on the gold-ETF proxy, about two weeks out |
The economic releases referenced above are published on the official government calendars below. Price levels are derived from standard technical and statistical methods, and the market read is AlgoIndex's own analysis. How we grade these calls is set out in our performance methodology.
- US Bureau of Economic Analysis, Personal Income and Outlays (PCE)
- US Bureau of Economic Analysis, Gross Domestic Product
- US Bureau of Economic Analysis, release schedule
- US Census Bureau, Advance Durable Goods (M3) release schedule
- US Energy Information Administration, Weekly Petroleum Status Report
- US Department of the Treasury, auction schedule and results
- AlgoIndex performance methodology



