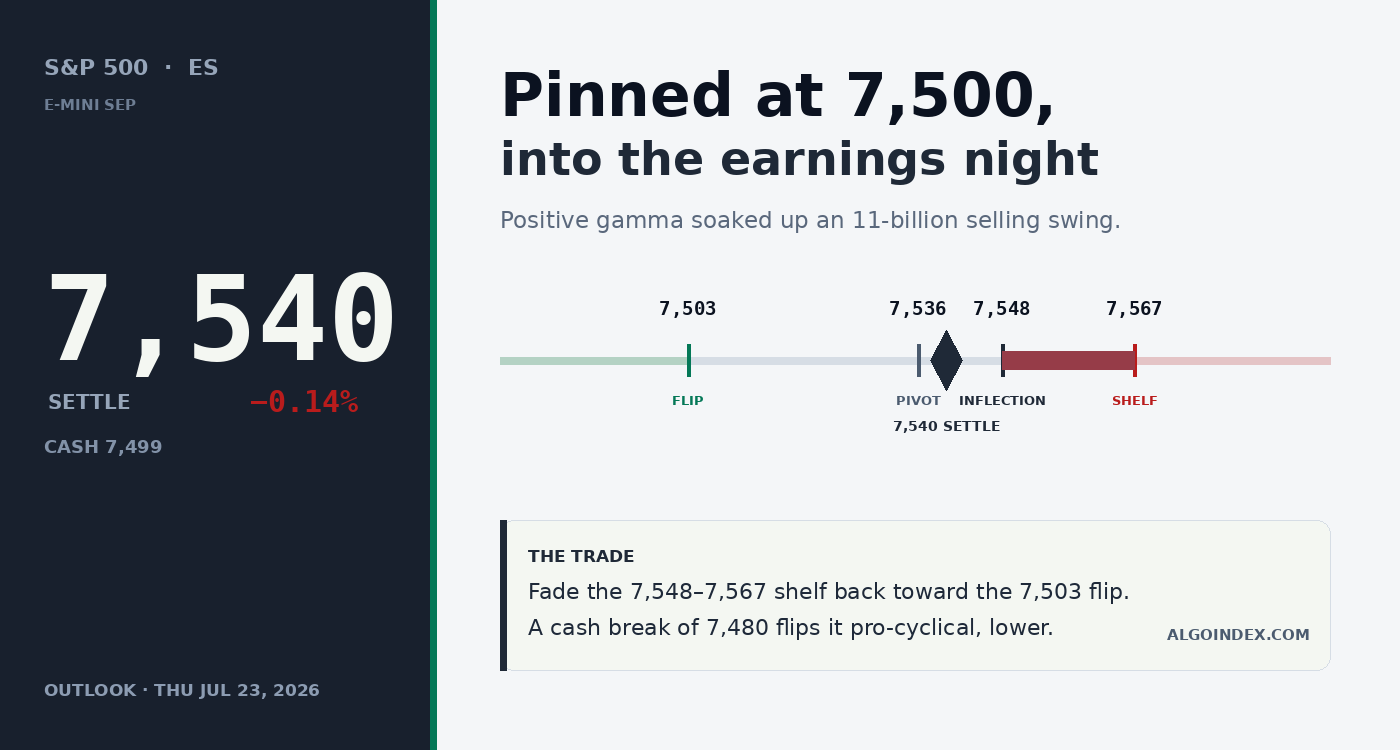
The S&P 500 pinned flat at 7,499 as positive dealer gamma absorbed an implied 11 billion of delta selling into the biggest night of tech earnings, where the two largest reporters fell. Neutral with a bearish lean: fade the 7,548 to 7,567 shelf toward the 7,503 flip; a cash break of 7,480 turns it pro-cyclical lower.
The 60-second read
Wednesday was a study in stillness. The cash S&P 500 finished at 7,499, a rounding-error 0.14 percent lower, and the September E-mini settled 7,540.25 in a band so narrow it could only mean one thing: nobody wanted a position an hour before the busiest night of the technology earnings season. The calm on top hid a rough undercurrent. The delta that dealers were hedging flipped hard, from roughly plus 3 billion to minus 8 billion, which is about 11 billion of selling pressure, and the market shrugged it off because a positive-gamma shelf near the 7,500 line kept absorbing it. Then the two biggest names reported, and both dropped. Thursday therefore opens with a soft lean and a firm cushion at once. Our plan is to sell the shelf from 7,548 up to 7,567 back toward the 7,503 flip, and to turn genuinely bearish only if the cash index gives up 7,480.
Think of it as a compressed spring rather than a dead session. The very thing that kept price still is the thing that can make it jump on Thursday, and it goes by one name: dealer gamma. Wednesday’s note flagged that same positive-gamma shelf heading into the reports; now the results are in and the shelf is being tested for real.
The mechanics are worth walking through. With dealers sitting long gamma near the 7,500 line, any drift off that magnet pulled in hedging that walked price right back, so the market held to the strike as the day wound down toward the results. Top to bottom, the cash index covered barely half a percent, one of the tightest days of the month. Since the Globex reopen the contract has eased toward 7,527, which fits the lukewarm reception the mega-cap names got after the bell.
A pinned session, by the numbers
7,540
E-mini settle
-0.14%
Cash index
16.6
Volatility gauge
88%
Early beat rate
A hush on the surface over a busy night. The beat rate is strong, the volatility gauge is easing, and the mega-cap reaction is the wobble.
The pin, and what held it
The headline number on Wednesday is not the flat close, it's what that close absorbed. Dealers were net sellers of an enormous amount of delta as the hedging read collapsed from positive territory to deeply negative, and the S&P still ended the day unchanged. That's a clear illustration of a long-gamma shelf doing its job. With dealer positioning parked near positive 375 million in notional, a reading around 1.38, price stayed glued to the strike no matter how much delta changed hands.
How the selling was assembled matters as much as its size. It came from longer-dated puts being bought and same-session calls being sold, the pair of moves desks reach for to insure a book into an event, not the moves they make when they're convinced the market is about to fall. In plain terms, that is a hedge, not a verdict.
A long-gamma shelf is a shock absorber, not a ledge you can stand on indefinitely. It compresses range while price holds the flip; break the flip and the very dealers who cushioned the move begin to amplify it.
A market that is picking winners
The real story landed after the bell, in the split. Both of the day’s largest reporters slid even though the headline numbers cleared the bar. The search-and-cloud giant lost about 4 percent once it raised its 2026 capital-spending plan toward the 195-to-205 billion zone, which dropped a familiar question back onto the table: how long it'll be before the artificial-intelligence build-out starts eating into free cash flow? The electric-vehicle maker gave up roughly 3 percent on a soft second-quarter profit. An enterprise-software name, meanwhile, jumped close to 5 percent on its own beat.
Step back and the breadth is better than those two prints imply. Roughly a fifth of the index has now reported, and nearly 88 of every 100 early names have come in ahead on profit, among the strongest opening weeks the record shows. The shift is that investors have stopped buying the technology theme as a single block. They're sorting it now, paying up for the clean beat and selling the guidance they do not trust.
The oil tail nobody is pricing
Equities may have dozed, but crude did not. Prices pushed up on a new burst of Strait of Hormuz headlines: a threat that a Tehran strike on shipping in the passage would be met with a precise US strike on infrastructure, reports of navigation bans nearby, and extra American tanker aircraft repositioning toward the Gulf. One desk put estimated Persian Gulf throughput under 45 percent of what moved before the fighting, enough to bid the benchmark barrel higher already. For stocks the wire is short: oil is both a fresh inflation impulse and a levy on growth.
And here's the catch worth flagging. Crude firmed, long-end yields ticked up, the dollar held, and the yen sat near its softest since the mid-1980s, yet equity volatility went the other way, with the index gauge easing to about 16.6 and its rank stuck low at 19.3 percent. When rising oil and yields line up against falling stock volatility, that spread tends to close by volatility waking up, not by oil quietly retreating.
The one line that matters: 7,480
The whole mechanical picture turns on a single cash-index level. Hold above the 7,480 pivot and the environment keeps stabilizing and reverting to the mean; slip beneath it and dealer hedging flips pro-cyclical, with moves starting to compound instead of fade. In E-mini terms the line to defend is the 7,503 flip. Keep it and the range case holds, with 7,536 and the 7,548 inflection as the pivots overhead. Lose it and 7,476 then 7,449 arrive quickly.
On top, the fade lives on the shelf running 7,548 up to 7,567, where the inflection meets the week’s high. Win 7,575 back on a hold and the bearish case tears up, pointing instead at 7,595 and the prior-peak zone near 7,638. Short of that, pushes into the band are there to be sold, not chased.
The trade
The main plan reads roughly balanced with a light downside lean: sell a failure between 7,548 and 7,567 once the 09:45 gate has passed, risk on a sustained push and hold over 7,575, and peel off into 7,536, then 7,503 at the flip, then 7,476 if the cash index has already surrendered 7,480. The reward against risk runs about 1:1.4 to the first exit and near 1:3.5 to the last. A long-gamma market rewards fading the edges over chasing a break, so let the level do the work.
The bullish alternate is just as clean. If the mega-cap results get digested and the E-mini wins back 7,548 and stays there, look for follow-through into 7,567 then 7,595, risk set under 7,530, with the prior-peak zone near 7,638 as the stretch under a positive-gamma drift. Two overrides sit above the entire map: a sharp Gulf or crude headline can shove the market either way on its own, and a decisive cash break of 7,480 turns the job from fade-the-range into ride-the-momentum lower. Sit out the opening quarter-hour, and give the European rate window from 08:15 to 08:45 and the chip-maker print after the bell their room.
The complete data picture
Every number behind Thursday’s plan, charted first; the full numeric reference follows underneath.
CHARTED
Level map
CME S&P 500 E-mini, September front month · every reference from the review, to scale
BELOW FLIP: PRO-CYCLICAL 7,300-7,503ABOVE FLIP: STABILIZING 7,503-7,720FADE-THE-SHELF ZONE 7,548-7,567
Price pinned around the 7,500 strike, settling 7,540.25 with the evening print near 7,527. The 7,503 gamma-flip is the line that matters most: above it dealer hedging stabilizes and mean-reverts, below it the flow turns pro-cyclical and moves accelerate. The fade sits at the 7,548 to 7,567 shelf.
The hedging-flow swing
Dealers sold billions in delta; positive gamma absorbed it
Real-time hedging flow swung from about positive 3 billion to negative 8 billion in delta, an implied 11 billion of dealer selling, yet the index still closed flat. The reason is a positive dealer-gamma shelf, gamma index near 1.38 and notional around positive $375 million (shown scaled), that pinned price to the strike. The selling was defensive put buying and call selling into earnings, not conviction.
Moving-average stack
A firm uptrend in a shallow pullback
Against a spot near 7,522 the front month sits above its 5-day near 7,517 and far above its 100-day at 7,250 and 200-day at 7,121, but just below the clustered 20 and 50-day near 7,538. That 7,537 to 7,543 zone is the pivot the market is wrestling with: reclaiming it restores short-term momentum, rejection keeps the near-term tone soft while the long-term trend stays firmly higher.
Momentum and volatility
Cooled to neutral, with options pricing a benign day
The 14-day relative-strength read near 48.8 and the 9-day near 46.4 sit just below the 50 midline, a loss of thrust without an oversold washout, while the 20 and 50-day reads above the midline keep the primary uptrend intact. The implied-volatility rank at 19.3 percent says the options market is pricing a contained day rather than a volatility event, even with oil and earnings in play.
Expected range
Scenario bands against the implied-move envelope
Average true range on the front month runs 77 to 84 points, about 1.0 to 1.1 percent, while the options-implied one-day move is tighter near 0.64 percent. A reasonable Thursday band is roughly 7,490 on the low to 7,585 on the high around the 7,540 settle, wider only if an earnings gap or an oil headline forces a repricing.
Primary setup
Fade the shelf, into a positive-gamma range
Short-side interest on a rejection of 7,548 to 7,567 after the 09:45 gate, stop on a sustained push and hold above 7,575. Targets 7,536, then 7,503 into the gamma-flip, then 7,476, the last valid only on a cash-index break of the 7,480 pivot. A clean reclaim above 7,575 flips the structure constructive toward 7,595 and the record area; an oil or Iran headline can override either way.
The after-hours earnings split
A strong beat rate, a discriminating market
The two largest reporters fell despite headline beats, reviving the debate over whether the artificial-intelligence build-out is compressing free cash flow, while an enterprise-software name rose on its beat. The broad picture is stronger than the megacap reaction suggests: with about a fifth of index earnings in, roughly 88 percent of early reporters had beaten, one of the strongest first-week beat rates on record.
Thursday’s calendar
All times Eastern · earnings digestion outranks the data slate
The domestic macro slate is light. The first-order event is the open digestion of Wednesday night’s mega-cap results, then the after-close chip-maker report, which drew unusually heavy upside call activity. The 08:15 to 08:45 ECB window is the overnight-into-open cross-asset swing factor.
Full numeric reference , every remaining figure from the review
Contract
CME S&P 500 E-mini front month, September 2026 (ESU26). Review prepared Wednesday evening July 22 for the Thursday July 23 regular session. Forecast and setups are next-session-forward.
Session prints
The cash index settled 7,499, down 0.14 percent, holding above the roughly 7,480 dealer-positioning pivot. The E-mini settled 7,540.25 and traded about 7,504 to 7,563 across regular hours; the continuous front month showed a moderately larger decline on the contract-roll basis. The at-the-money volatility gauge closed near 16.6, off 2.4 percent. The cash index traded a 54 basis-point range, one of the tightest of the month; since the 18:00 ET Globex reopen the E-mini has eased toward 7,527.
Range context
The front month sits about 2.3 percent below its 52-week high of 7,693.75 (early June) and roughly 2.2 percent above the one-month low near 7,357. The last five sessions ranged about 7,473 to 7,563 with a mild negative bias. The one-month high near 7,632 and the June record near 7,694 are the reference ceiling; the one-month low near 7,357 is the deeper base. Four-hour swing supports stack at 7,504 and 7,476 beneath the 7,563 to 7,575 supply shelf; acceptance below 7,504 opens the 7,476 and 7,448 four-hour supports.
Moving averages
Against a spot near 7,522 the front month sits above its 5-day near 7,517 and well above its 100-day at 7,250 and 200-day at 7,121, but just below the clustered 20-day and 50-day near 7,538. The 7,537 to 7,543 zone is the immediate pivot: reclaiming it restores short-term momentum, rejection keeps the near-term tone soft while the long-term trend stays firmly higher.
Oscillators and trend
The 14-day relative-strength read near 48.8 and the 9-day near 46.4 sit just below the 50 midline; the 20-day near 50.7 and 50-day near 53.9 stay above it, consistent with an intact primary uptrend. Short-window stochastics in the high-20s to low-40s are approaching but not yet at oversold. The trend-strength gauge in the high teens to low 20s points to a weak, non-trending environment.
Volatility
Average true range on the front month runs 77 to 84 points, about 1.0 to 1.1 percent, while the options-implied one-day move for the cash index is tighter near 0.64 percent, with an implied band of roughly 7,443 to 7,539 on the index. The implied-volatility rank reads a low 19.3 percent. A reasonable Thursday E-mini band is roughly 7,490 on the low to 7,585 on the high around the 7,540 settle.
Key levels
Resistance: the 20 and 50-day zone 7,538 to 7,543, the volatility inflection 7,548, the 7,563 to 7,567 shelf (week high and first pivot), the second pivot 7,595, the one-month high 7,632, the dealer call shelf 7,638, and the record area 7,694. Support: the 7,536 pivot, first pivot support 7,508, the 7,503 gamma-flip, the 50 percent retracement 7,494, second pivot support 7,476, third pivot support 7,449, and the put-support concentration 7,338.
Options flow and dealer positioning
The S&P options complex is the primary flow surface, not a proxy, and describes a positive-gamma, range-containing environment. Net dealer gamma is positive, a gamma index near 1.38 and notional around positive 375 million, which pinned price near the 7,500 strike. Cash-index dealer levels: call resistance near 7,600, volatility inflection near 7,510, gamma-flip near 7,465, risk pivot near 7,480, put support near 7,300; on the roughly 40-point basis that maps to an E-mini call shelf near 7,638, inflection near 7,548, flip near 7,503, put support near 7,338. Real-time hedging flow swung from about positive 3 billion to negative 8 billion in delta, an implied 11 billion of dealer selling, built from longer-dated put buying and same-day call selling. The read is based on the evening desk note dated July 22 at 5:45 PM ET.
Macro drivers
The dollar held firm on higher oil and long-end yields; the 10-year yield ticked up around 0.5 percent. Recent inflation cooled, the annual consumer-price reading at 3.5 percent and producer-price at 5.5 percent, both below expectations, though one Fed voice struck a hawkish tone. Earnings: after the close the search-and-cloud giant fell about 4 percent on a lifted 2026 capital-spending guide of 195 to 205 billion, the electric-vehicle maker fell about 3 percent on a Q2 miss, and an enterprise-software name rose about 5 percent; with about a fifth of index earnings in, roughly 88 percent of early reporters had beaten. Geopolitics: Strait of Hormuz escalation, a warning of a US response to any Iranian strike on shipping, navigation bans, and refueling assets moving toward the region, with estimated Persian Gulf flows below 45 percent of pre-conflict levels lifting crude. The yen sat near its weakest since the mid-1980s.
Setup and paths
Primary, neutral with a modest bearish lean: fade a rejection of 7,548 to 7,567 after 09:45 ET, stop on a sustained push above 7,575, T1 7,536, T2 7,508 to 7,503 into the gamma-flip, T3 7,476 (valid only on a cash break of 7,480); about 1:1.4, 1:2.6 and 1:3.5. Bullish alternate: a reclaim and hold above 7,548 favors 7,567 and 7,595, stop below 7,530, with the record area near 7,638 the stretch. Paths: A range-bound about 55 percent (hold 7,503, rotate 7,503 to 7,563), B constructive reclaim about 25 percent (reclaim 7,548, drift 7,567 to 7,595), C pro-cyclical breakdown about 20 percent (break 7,480 cash, accelerate to 7,476 and 7,449).
Calendar
08:15 ET European central-bank rate decision (hold near 2.40 percent, deposit near 2.25 percent); 08:30 ET US initial jobless claims (consensus near 210,500 versus 208,000 prior, continued claims near 1.809 million); 08:45 ET European central-bank press conference; 10:00 ET Eurozone flash consumer confidence; 13:00 ET US 10-year inflation-protected note auction; pre-open aerospace, defense, airline and telecom results; 16:00 ET after-close second-quarter results from a large semiconductor maker, plus a large European software name at 16:20 ET. The market takes direction from the earnings reaction and the oil and geopolitical headlines rather than the data.
AlgoIndex publishes institutional-grade reviews on ES, NQ, GC, and CL, built on professional-grade market data and our own analysis, priced for individual traders.