
ES 7,362 0.42%NQ 29,850 0.83%GC 4,358 0.56%CL 88.43 2.20%VIX 18 1.10%● TONIGHT'S MARKET REVIEW PUBLISHES 8:30 PM ETES 7,362 0.42%NQ 29,850 0.83%GC 4,358 0.56%CL 88.43 2.20%VIX 18 1.10%● TONIGHT'S MARKET REVIEW PUBLISHES 8:30 PM ET
AlgoIndexPromo

S&P 500: One Group Did the Lifting, Dealers Turned Positive Into Earnings

Market OutlookPublished For the session12 min readby AlgoIndex Research Team
S&P 500: One Group Did the Lifting, Dealers Turned Positive Into Earnings

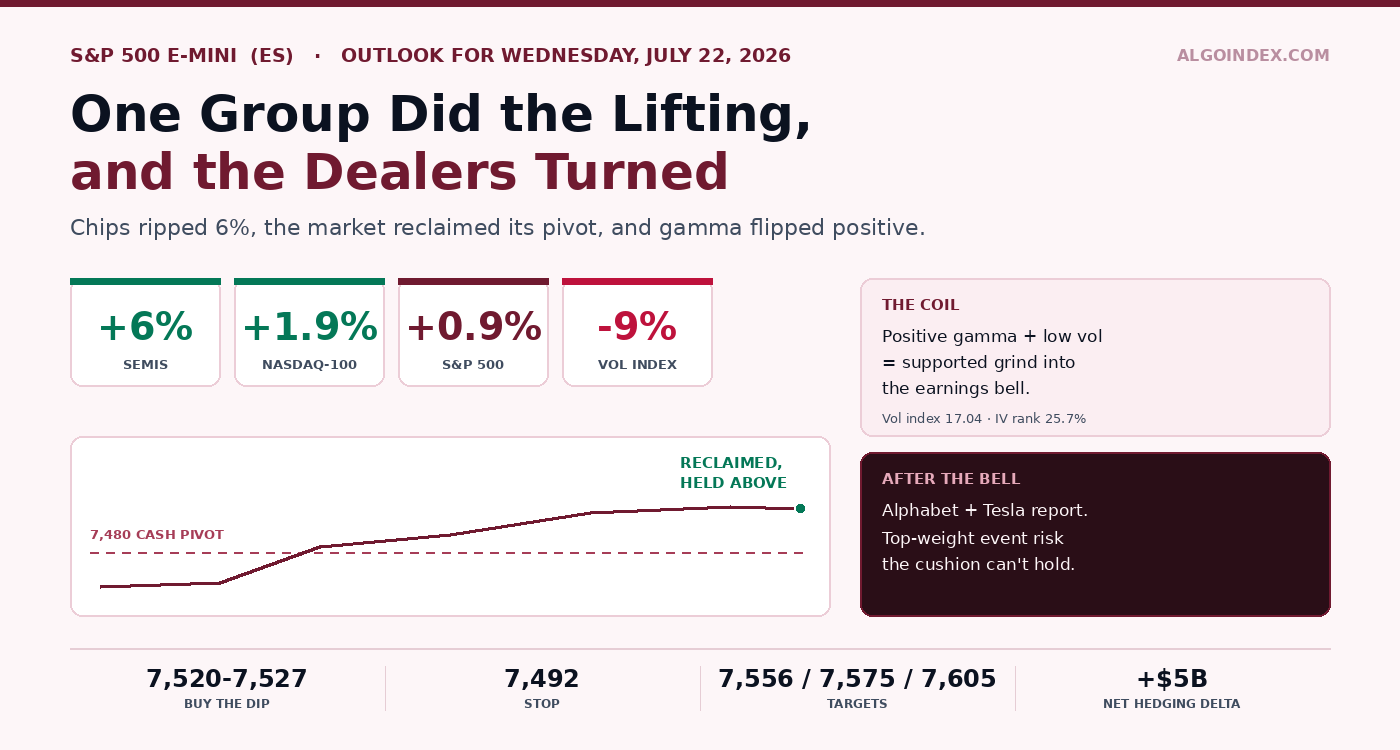
ES settled 7,545.75 as semiconductors ripped 6 percent, the market reclaimed the 7,480 pivot a second time, and dealer gamma flipped positive with +5 billion of net hedging delta. Buy dips into 7,520-7,527, stand aside into the earnings close.

The 60-second read

The S&P 500 rose about 0.9 percent Tuesday, the E-mini settling near 7,545.75, and one group did nearly all of it: semiconductors jumped roughly 6 percent, a memory name added 12 and a storage name 14. The volatility index fell 9 percent to 17.04 as hedges came off. Underneath, the market reclaimed the 7,480 cash pivot for a second time and dealer positioning turned supportive and net long, with real-time hedging flow running a net positive 5 billion dollars, most of it 0DTE put selling that pins movement down. That mix, low volatility over a reclaimed pivot, favours a supported grind into Wednesday. Two things sit against it: a wall of mega-cap earnings after Wednesday's close, and an active US-Iran confrontation the market keeps shrugging off. We buy dips into 7,520 to 7,527, stop under 7,492, and stand aside into the earnings bell.

My note on this contract Monday evening leaned short, fade a failed retest into 7,522 to 7,530, stop 7,548. The market never gave the retest. It reclaimed the level and held, and the E-mini closed Tuesday at 7,545.75, a couple of points under that stop. Wrong lean, and worth saying so plainly.

What flipped it was one group. Chips had been in a hole for weeks, and Tuesday they came roaring out of it.

A narrow rally with a wide effect
+6%
Semiconductor group
+1.9%
Nasdaq-100
+0.9%
S&P 500 cash, to 7,509
-9%
Volatility index, to 17.04

The Nasdaq leading the S&P by a full point tells you where the lift came from, and where it didn't.

The pivot got reclaimed, and the dealers turned

The index gain isn't the number that matters most. It's that the cash market grabbed 7,480 back early, held above it into the close, and never came back to challenge it. That pivot has now been taken back on two separate attempts, and the repeat is what makes it stick. Sitting above it turns dealer hedging from a headwind into a tailwind.

You can see the mechanics in the flow. Net hedging ran a positive 5 billion dollars of delta on the day, and roughly 4 billion of that came from selling 0DTE puts, which does one thing above all else: it damps realized movement. Layer on 3.5 billion more of positive delta from longer-dated calls and the book leans long, which is why the day ground higher instead of lurching. The aggregate read agreed, call-side near 3.61 billion against a put-side near negative 2.91 billion.

Positive positioning is a cushion, not a guarantee. It keeps the regular session calm and does nothing for you when a top-weight name gaps after the bell.

That capping worked in both directions Tuesday. Ten thousand lots of dealer calls parked at the 7,530 cash strike laid a lid of positive positioning across 7,520 to 7,530; price kept pressing into it and stalling, which is exactly why the climb felt capped rather than sharp. The same shelf that capped Tuesday is the support base for Wednesday.

Cheap volatility over cooling inflation

The rate backdrop is doing the quiet work. Consumer prices came in at 3.5 percent against a 3.8 forecast, producer prices at 5.5 against 6.2, both cooler than expected, and that gives equities room to climb without a rates fight. One-month implied volatility sits near 14.3 percent against 10.4 realized, a thin premium, with the volatility rank has sunk near 25.7 percent. In plain terms, protection is cheap and nobody's rushing to buy it.

Implied one-month correlation has been pushed below 5, which is the tell for the whole posture: the crowd is holding index movement down while paying up for single-name swings into earnings. It's a calm index sitting on top of a lot of stored single-stock energy. That's fine right up until a heavyweight reports.

Wednesday is a consolidation, and the real event is after the bell

The regular session Wednesday has no first-order US data. The morning carries an expiration in the volatility index that can briefly unpin price before the positioning cushion snaps back, weekly crude inventories at 10:30, and a long-bond auction at 1:00 that can tug the far end of the curve. None of that is the story.

The story lands at 4:00. Alphabet and Texas Instruments report around 4:00, Tesla near 4:05, IBM near 4:10, with the Google call at 4:30 and Tesla's at 5:30. Since Alphabet and Tesla carry the heaviest index weights, their after-hours moves will decide Thursday's open more than any tick in Wednesday's regular hours. Expect the afternoon to compress into that, narrowing ranges, thinning conviction, the familiar pre-event consolidation.

And there's a tail nobody's pricing. Washington and Tehran are in an active military standoff. The pressure points are the shipping chokepoints, Hormuz, the Red Sea, the Bab el-Mandeb, with Gulf flows said to be running under 45 percent of pre-war levels. Equities have treated it as background and rallied on inflation instead. That calm is itself the risk. A single energy-supply headline could force a fast re-pricing, and it would cut straight against a long.

The trade: buy the shelf, respect the bell

The setup follows the positioning. Buy controlled pullbacks into 7,520 to 7,527, where the daily pivot, the 38.2 percent retracement and the supportive-positioning shelf all sit on top of each other, aiming for the supply band overhead.

ES primary setup, buy the dip into support
Entry (long)
7,520-7,527
Stop
7,492
T1 / T2
7,556 / 7,575
T3
7,600-7,605
Rewards run about 1:1.1, 1:1.7 and 1:2.4 from the mid-entry. Lose 7,492 on a held 30-minute close and the 50 percent retracement and the reclaimed pivot go at once; the read turns neutral-to-bearish and the cash 7,400 base comes into view. The override is the calendar: size down materially or stand aside into the Alphabet and Tesla close, and don't carry aggressive directional risk through 4:00.

There's a counter-trade if the upside comes without conviction. If price reaches 7,600 to 7,605 on softening internals, a fading composite, negative direction nudging past positive, and can't reclaim momentum cleanly, fading back toward 7,556 then 7,524 is the nimble play, stop above 7,616. And there are days to skip entirely: aimless chop between 7,535 and 7,555 that never cleanly tags either edge, the final hour before the earnings close, or an erratic gap-filled open off the volatility-index expiration.

Wednesday's three paths
A · 50% grind
B · 30% continue
C · 20% slip
A. Supported grind between 7,524 and 7,590, dips into the 7,520 to 7,530 base bought, compression into the earnings close.
B. Reclaiming the 7,561 nine-day cross and staying above it tags 7,575, then probes the 7,600 to 7,605 band before stalling.
C. A slip through 7,524 tests the 7,494 to 7,500 line, where that reclaimed pivot has to hold or the constructive read is done.

Expected bands: low 7,500, mid 7,545 (most likely, pinned to the settle), high 7,590. A one-ATR day spans roughly 7,455 to 7,636.

The cushion holds the day. It won't hold the two reports that land after everyone goes home.

The complete data picture

Every level and reading from the Tuesday evening ES review, charted. Levels are in the September E-mini domain with the cash equivalent in parentheses; the ES-over-cash basis is about 36 points. The full numeric reference sits below the charts.

Level map
September E-mini · every reference from the review, to scale
ENLARGE
7,693.75 52-week and 13-week high7,632.00 one-month high7,575.50 first pivot resistance7,556.00 dealer call shelf upper edge (cash 7,520)7,545.71 18-day crossover7,544.00 40-day crossover7,528.30 20-day average7,524.25 DAILY PIVOT7,494.63 50% retracement7,492.00 setup stop7,436.00 cash 7,400 support7,656.50 third pivot resistance7,605.25 second pivot resistance (cash 7,600)7,561.84 9-DAY CROSS7,545.75 SETTLE7,544.05 5-day average7,541.50 Globex reopen7,527.00 38.2% retracement7,520.00 positive-positioning shelf (cash 7,520)7,494.50 pivot support · cash 7,480 reclaim7,468.75 two-SD support (cash 7,432)SETTLE7,545.75PIVOT7,524.25
BELOW PIVOT 7,420-7,524ABOVE PIVOT: CONSTRUCTIVE 7,524-7,710DEALER CALL SHELF (7,520-7,530 CASH) 7,520-7,556
Tuesday reclaimed the 7,480 cash pivot for a second time and held. The 7,520 to 7,530 dealer call shelf capped the day and now serves as the first support base into Wednesday.
Moving-average stack
Price threading its intermediate averages
SUPPORT BENEATH PRICERESISTANCE OVERHEAD7,528.3020-day7,544.0040-day7,544.055-day7,545.7118-day7,561.849-day cross7,545.75SETTLE
The settle sits right on the 5-day and 18-day and just under the 40-day, with the 20-day at 7,528.30 as first dynamic support. A close back above the 9-day cross at 7,561.84 re-asserts short-term momentum.
Relative strength by lookback
Neutral, tilting up, room to extend
509-day50.4neutral14-day51.220-day52.450-day54.6100-day54.7broader uptrend
Every reading sits just above the 50 midline and steps higher with the lookback. Not overbought, with room to extend. Short-term stochastics are mid-range (14-day %K near 47) while the 100-day stochastic holds firm near 88.
Dealer positioning and flow
Why Tuesday ground instead of lurching
SUPPRESSIVE / SHORTSUPPORTIVE / LONGNet hedging delta+$5Bpositive on the session0DTE put selling+$4Bsuppresses realized movementLonger-dated call buying+$3.5Bindex-equity flowAggregate call-side+$3.61BpositioningAggregate put-side-$2.91Bpositioning
Every measured flow leans the same way. Net positive delta of 5 billion dollars, the bulk from 0DTE put selling, mechanically damps movement; positive aggregate positioning encourages a grind around key strikes. The put-to-call open-interest ratio near 1.27 shows a still-hedged book, but the flow direction is constructive.
Expected range
Scenario bands against the implied move
LOW BAND7,492 - 7,508breach toward the 7,494 lineMID BAND · MOST LIKELY7,524 - 7,560pinned near the settleHIGH BAND7,575 - 7,605the 7,575-7,605 supply band7,4997,592options-implied one-day move7,545.75
The desk implied one-day move is 0.62 percent, roughly 47 ES points, with at-the-money implied volatility of 11.2 percent pricing about a 0.7 percent move. A one-ATR day spans roughly 7,455 to 7,636.
Primary setup
Long the dip into support, to scale
RISK 32 POINTS = 1RSTOP7,492ENTRY ZONE7,520-7,527T17,5561 : 1.132 ptsT27,5751 : 1.752 ptsT37,6051 : 2.482 pts
Entry into 7,520 to 7,527 on a controlled pullback that holds the pivot. Stop under 7,492 breaks the 50 percent retracement and the reclaimed pivot together. Reward blocks are drawn proportionally. Override: size down or stand aside into the after-close earnings.
Wednesday’s calendar
All times Eastern · the real event is after the bell
02:00UK inflation10:30Crude inventories16:00Alphabet, Texas Instruments16:10IBM06:35AT&T earnings13:0020-year auction16:05Tesla17:30Tesla call
No first-order US data in regular hours. A volatility-index expiration hits late morning. The first-order event is the after-close mega-cap slate, whose reaction lands on Thursday.
Full numeric reference , every figure from the review
Contract
CME S&P 500 E-mini front month, September 2026 (ES1! / ESU26). Review prepared Tuesday evening July 21 for the Wednesday July 22 regular session. ES-over-cash basis about +36 points (ES 7,545.75 versus cash 7,509).
Session prints
Cash S&P 500 +0.9 percent to settle near 7,509 inside a 63 basis-point range; ES front month settled 7,545.75. Nasdaq-100 +1.9 percent, semiconductor group about +6 percent, a memory maker about +12 percent, a storage name about +14 percent. Volatility index 17.04, down about 9 percent; volatility-of-volatility 96.34, down about 6 percent. Most recent four-hour candle open 7,545.00, high 7,545.50, low 7,540.25, close 7,541.75. Evening Globex reopen eased to 7,541 to 7,542, roughly 3 to 4 points below the 7,545.75 settle.
Range context
52-week and 13-week high 7,693.75; one-month high 7,632.00. Settle roughly 1.2 to 2.0 percent below the ceiling. Settle 7,545.75 sits above the 7,524.25 pivot projection. Four-hour structure a series of higher lows.
Moving averages
5-day 7,544.05; 20-day 7,528.30; cheat-sheet 40-day near 7,544; 18-day near 7,545.71; 9-day cross near 7,561.84. Price threading its intermediate averages, a compressed decision-point posture.
Oscillators and trend
Relative strength: 9-day 50.4, 14-day 51.2, 20-day 52.4, 50-day 54.6, 100-day 54.7. Stochastics mid-range (14-day %K near 47); 100-day stochastic near 88. Directional index weak: 9-day near 20.0, 14-day near 17.3, 20-day near 14.0, with negative direction modestly over positive. Multi-indicator composite 40 percent buy with soft strength and weakening near-term direction; longer-term trend signal a buy.
Volatility
14-day average true range 90.29 points (about 1.20 percent), 20-day 92.78, 9-day 86.24; 14-day average daily range 81.00 points (about 1.07 percent). Historic volatility near 9.3 percent on the 14-day. Implied one-day move 0.62 percent; implied five-day move 1.78 percent; options-implied dollar move for cash about 67 dollars; at-the-money implied volatility 11.2 percent, pricing a cash-session expected move near 0.6 to 0.7 percent. One-month implied volatility 14.3 percent against 10.4 realized; implied-volatility rank about 25.7 percent. One-ATR band around the settle spans roughly 7,455 to 7,636.
Positioning and flow
Aggregate dealer positioning net positive: call-side near 3.61 billion versus put-side near negative 2.91 billion. Real-time hedging flow about +5 billion of net delta, roughly +4 billion of it 0DTE put selling; index-equity flow about +3.5 billion from longer-dated call buying. Put-to-call open-interest ratio near 1.27. Implied one-month correlation below 5. A 10,000-lot dealer long-call position at the 7,530 cash strike generated positive positioning across cash 7,520 to 7,530. Desk pivot 7,480 cash, reclaimed and held a second time; cash resistance 7,500, 7,520, 7,600; cash support 7,480 and 7,400. Desk note dated Tuesday July 21, 5:20 p.m. ET.
Key levels (ES / cash)
Resistance: 7,556 (cash 7,520 call-shelf edge), 7,561.84 (9-day cross), 7,575.50 (pivot R1), 7,605.25 (pivot R2, cash 7,600), 7,632.00 (one-month high), 7,656.50 (pivot R3), 7,693.75 (52-week high). Support: 7,524.25 daily pivot with the 38.2 percent retracement near 7,527 and the shelf around cash 7,520; 7,494.63 (50 percent retracement) on the 7,494.50 pivot S1 (cash 7,480 reclaimed pivot); 7,468.75 (two-SD, cash roughly 7,432); cash 7,400 (ES roughly 7,436).
Macro and cross-asset
Consumer prices 3.5 percent against a 3.8 forecast; producer prices 5.5 percent against a 6.2 forecast, both cooler. Private oil inventory a build of about +2.6 million barrels against a forecast draw. Rates lean mildly toward higher yields into a 20-year auction (prior high yield 4.927 percent, prior bid-to-cover 2.750). New tariffs on trading partners due by Friday. Live US and Iran military confrontation with Strait of Hormuz, Red Sea and Bab el-Mandeb supply threats; Gulf flows reportedly below 45 percent of pre-war levels; mediators floated a 10-day cessation.
Setup and paths
Long 7,520 to 7,527, stop below 7,492, T1 7,556, T2 7,575, T3 7,600 to 7,605; about 1:1.1, 1:1.7 and 1:2.4 from the mid-entry; invalidation a sustained 30-minute close below 7,492. Alternate: fade a momentum-less 7,600 to 7,605 tag back to 7,556 then 7,524, stop above 7,616. Paths A grind 50 percent (7,524 to 7,590), B continuation 30 percent (reclaim 7,561, tag 7,575, probe 7,600 to 7,605), C slip 20 percent (through 7,524 to the 7,494 to 7,500 line). Expected bands low 7,500 (cash roughly 7,464), mid 7,545 (cash roughly 7,509), high 7,590 (cash roughly 7,554). The primary support region is the 7,520 to 7,525 overlap of the pivot and the positive-positioning shelf.
Calendar (Wednesday July 22, ET)
UK inflation 2:00 (consumer prices 2.7 percent year-over-year forecast versus 2.8 prior, core 2.5, services 3.5); AT&T earnings 6:35; weekly crude inventories 10:30 (forecast a 1.95 million-barrel draw versus 1.692 million prior); volatility-index expiration late morning; 20-year Treasury auction 1:00; after the close Alphabet and Texas Instruments about 4:00, Tesla about 4:05, IBM about 4:10, Google call 4:30, Tesla call 5:30. Thursday July 23 for context: ECB decision 8:15 (hold near 2.4 percent expected) with the press conference 8:45, US jobless claims 8:30 (about 210,000 forecast), Intel earnings after the close.

The cushion holds the session. The two reports after the bell are the real risk.

See how AlgoIndex turns dealer positioning and structure into systematic signals. Read Monday's ES note, whose short lean this session reclaimed.

View pricing


Performance methodology

Share:

Essential Guides

Related Articles

Crude Oil: Ignored the Bad Data

Crude Oil: Ignored the Bad Data

August 14, 2026 at 7:11 PM ET

Gold: Bought Its Own Washout

Gold: Bought Its Own Washout

August 14, 2026 at 7:11 PM ET

Nasdaq 100: The Market That Stopped Listening

Nasdaq 100: The Market That Stopped Listening

August 14, 2026 at 7:11 PM ET

S&P 500: The Consumer Cracked and the Market Barely Moved

S&P 500: The Consumer Cracked and the Market Barely Moved

August 14, 2026 at 7:11 PM ET

Want this kind of analysis every day?

AlgoIndex publishes institutional-grade reviews on ES, NQ, GC, and CL, built on professional-grade market data and our own analysis, priced for individual traders.

Start with 75% off month 1

