
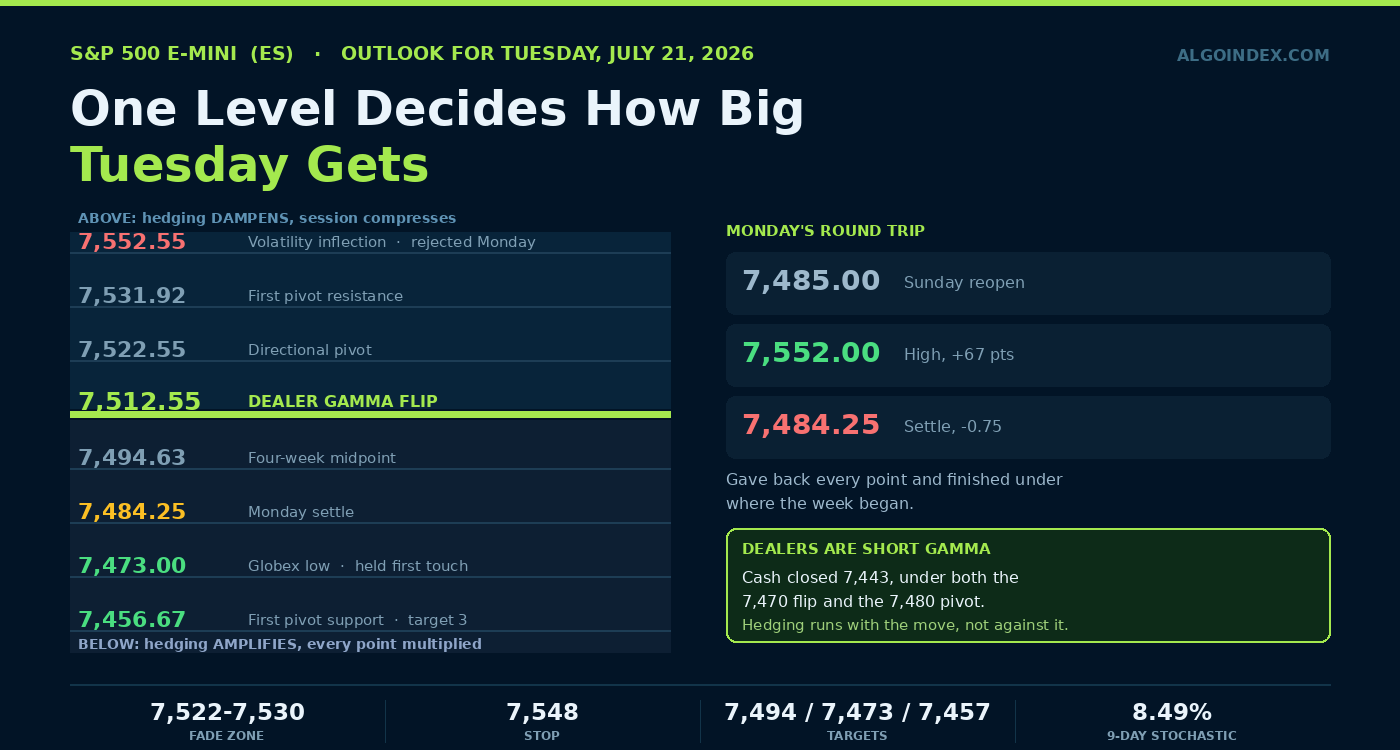
The September E-mini opened the week at 7,485.00, ran 67 points to 7,552.00, gave back every one of them, and settled at 7,484.25. Three quarters of a point below where it started. That high tagged a modelled dealer-positioning inflection at 7,552.55 to within half a point and reversed on the touch. Cash closed at 7,443, under both the 7,470 gamma flip and the 7,480 directional pivot, which leaves dealers short gamma and their hedging multiplying every point of range. We fade strength into 7,522 to 7,530 on a failed retest, stop 7,548, targets 7,494, 7,473 and 7,457. The whole thesis dies on acceptance above 7,552.55.
Monday's chart is a circle. Buyers pressed from the Sunday reopen, carried the contract 67 points into the New York morning, and then handed all of it back over the following six hours. The settle came in three quarters of a point under the week's opening print.
A round trip that exact isn't a coincidence, and neither was where it turned.
Below the flip, every point gets multiplied
Here's the mechanical fact that shapes Tuesday. Cash settled at 7,443, under the 7,470 gamma flip and under the 7,480 directional pivot. The gamma index reads negative 0.592 with net gamma notional of negative 134.4 million on the index and negative 1.347 billion on the primary fund. At these prices the dealer book is short gamma.
Short gamma means their hedging runs with the move instead of against it. Staying neutral forces them to add to weakness and chase strength, which stretches range instead of absorbing it. In futures terms 7,512.55 is the line. Below it, Tuesday is volatile. Above it, the sign flips, hedging starts damping, and the session compresses. One number, two entirely different days.
Friday's note on this contract made exactly this point going into the week: closing under the flip with earnings ahead hands the amplifier to the downside. Monday is what that looks like in practice. A 67-point advance didn't just stall, it fully unwound, and it unwound in one direction from the moment the inflection rejected it.
If you want the effect in miniature, look at Apple. The stock printed its most negative hedging flow in 30 days at negative 788 million, traded 1.9 million option contracts, generated 4.2 billion in gamma notional, and fell 2 percent to 327. The 335-strike puts expiring that day went from roughly 3 dollars to 10 in about two hours. A 233 percent move. That is short gamma doing its work in a single name, and it's the same machinery operating on the index at a slower speed.
7,512.55 separates a violent Tuesday from a compressed one. Everything else in the plan is downstream of which side of it price is trading on.
Oil to expectations to yields to multiples
The chain is short and it ran cleanly Monday. Crude hit a five-week high near 83 dollars with Brent reaching toward 90, on a ninth consecutive day of US strikes on Iran. Higher oil lifted inflation expectations. That pushed the ten-year up five basis points to 4.60 percent, with bond losses attributed directly to concern that energy costs keep price pressures running hot. Higher long-end yields compress equity multiples. Four links, and every one of them fired.
What makes it awkward is that observed inflation has been cooling. Consumer prices printed 3.5 percent year over year against a 3.8 forecast and a 4.2 prior. Producer prices came in at 5.5 against a 6.2 forecast and a 6.5 prior that was itself revised down to 6.0. Both undershot. The market isn't trading the inflation it has measured, it's trading the inflation it thinks crude is about to manufacture.
And policy pricing has moved hard with it. By March 2027 the curve now carries close to 50 basis points of tightening, One dealer research desk puts that better than 75 basis points beyond where the economy most plausibly goes, nearer a world in which real growth just sits at 3 percent forever. A governor has said publicly he's worried about a scenario where stricter policy proves necessary, and that a hot core print could force increases. An equity market discounting rate increases carries a compressed ceiling by construction.
One offset is worth holding onto. The same research argues Treasury weakness owes as much to technicals as to macro, namely a record wave of investment-grade supply in the first half arriving on top of expensive energy. Issuance eases seasonally from June through August. If that pattern holds, the yield headwind softens without anything else needing to change.
Long-term intact, short-term broken, no trend at all
Three separate readings, and they don't agree. Take them one at a time.
The long architecture is fine. Price sits 3.39 percent over the 100-day average and 5.19 percent over the 200-day, up 8.11 percent across 200 sessions and 7.06 percent year to date, with the long-horizon indicator set reading 67 percent constructive. Nothing in that is damaged.
The short architecture has cracked. Price trades under the 5-day at 7,532.20, the 20-day at 7,525.34 and the 50-day at 7,534.81, by 47.95, 41.09 and 50.56 points. The short-horizon set reads 80 percent negative. Negative directional index tops positive on every single period from 9 days to 100.
| Period | Trend strength | Positive | Negative |
|---|---|---|---|
| 9-day | 20.00 | 10.46 | 22.12 |
| 14-day | 17.26 | 12.51 | 21.34 |
| 20-day | 13.96 | 14.15 | 20.96 |
| 50-day | 9.12 | 17.69 | 21.50 |
| 100-day | 6.52 | 21.31 | 23.94 |
Trend strength under 20 on four of five periods says the defensive bias has no organisation behind it. Pressure without structure produces chop that drifts down, which is precisely the last five sessions.
So the honest label is neither bullish nor bearish. What you have is an uptrend on the long horizon that has slipped its near-term moorings, chopping across a wide band until something arrives to resolve it.
The oscillators complicate it further, and this is where I'd have got Monday wrong. The 9-day and 14-day raw stochastics read 8.49 and 11.01 percent, which is genuinely washed out and normally closer to bounce territory than continuation. I'd have expected Monday's rally off readings like that to hold something. It held nothing. That result matters more than the reading does, and it's the reason the plan below fades strength rather than buying weakness.
The last piece is compression. Historic volatility on the 14-day reads 8.55 percent against 14.16 on the 100-day, a substantial narrowing. Realised movement has shrunk even as the headline backdrop has intensified. Compressed, in other words, and the catalyst is 48 hours out.
The trade: sell into the density
Between 7,504 and 7,532 sit seven distinct reference points inside 28 points: the standard pivot at 7,504.33, the gamma flip at 7,512.55, the stochastic 30-percent level at 7,517.55, the directional pivot at 7,522.55, the 38.2 percent retracement at 7,527.05, the relative-strength midpoint at 7,529.91, and first pivot resistance at 7,531.92. Rallies into that kind of density stall on first approach far more often than they cut through it.
Underneath, the support is better defined than the resistance. The four-week midpoint at 7,494.63 is where the contract is pinned right now, with a positioning strike at 7,492.55 scoring 92.50 beside it. Monday's settle and tonight's open both sit on a strike at 7,485.55 scoring 88.57. Then the real one: tonight's Globex low at 7,473.00 with a strike at 7,470.55 immediately beneath it scoring 98.10, which is the highest conviction anywhere near current price. It held on first touch overnight. A decisive break under 7,470 is the tell that Tuesday is a trend day rather than a range day.
The long side is real but conditional, and the trigger is strict: two consecutive 30-minute closes above 7,552.55, and it wants either softening crude or a de-escalation headline behind it. Entry 7,553 to 7,560, stop 7,538 under the 18-day crossover, targets 7,579 at second pivot resistance, then 7,600, then the 7,642.55 upside positioning wall. Roughly 1.5:1 at the first and 3.1:1 at the second. Win that inflection back and dealer hedging turns supportive, which would settle the question of whether those single-digit stochastics were a genuine flush or just a stop along the way. Implied volatility rank at 26.97 percent means the upside optionality is historically cheap to own.
Skip the day entirely on any of these. An open outside the 7,425 to 7,543 implied band, since a gap that size invalidates the level map and it needs rebuilding first. Any significant Middle East headline landing inside 30 minutes of the bell. Price never reaching either the 7,522 to 7,530 zone or the 7,552.55 trigger, because a 20-point stop chasing 7,490 to 7,510 chop, in a market where hedging multiplies range, is how a slow day turns into a loss. Realised range under 25 points by noon. And anything still untriggered past 14:00, because a compressed session ahead of a catalyst leaves no room for a late entry to reach these numbers.
On targets generally: calibrate to what this market has actually been delivering. Recent daily ranges run 70.94 points on the 9-day and 76.50 on the 14-day, and both keep shrinking. Anything much past 60 points from entry simply hasn't been getting there lately. After 14:00, tighten materially. Structure sets the direction; the clock sets the distance.
Expected bands: low 7,425 to 7,445, mid 7,470 to 7,515 (settlement zone), high 7,540 to 7,562. Look for 55 to 80 points high to low, inside the 20-day norm.
Monday spent 67 points to finish three quarters of a point lower than it started. Patience, or distribution? Tuesday answers that.
The complete data picture
Every level and reading from the Monday evening ES review. Levels are quoted in the September E-mini domain with the cash equivalent in parentheses where the review provides one; the futures-to-cash basis is running about 42.5 points. Nothing rounded away.
Charted below; the full numeric reference follows.
Full numeric reference , every remaining figure from the review
| Resistance (bottom to top) | Support (top to bottom) |
|---|---|
| 7,501.20 where the 14-3 day raw stochastic returns to 20 percent; 7,504.33 the standard pivot, first overhead friction; 7,512.55 (7,470) the dealer gamma flip, the second most important number for Tuesday, about 19 points above the settle | 7,494.63 the 50 percent retracement of the four-week range, where the contract is currently trading, adjacent to a positioning strike at 7,492.55 scoring 92.50 7,485.55 a strike scoring 88.57, coincident with Monday's 7,484.25 settle and tonight's 7,484.00 open 7,480.21 the 38.2 percent retracement from the 13-week high |
| 7,517.55 the stochastic 30-percent level; 7,522.55 (7,480) the directional pivot separating constructive from defensive positioning, which cash closed below; 7,527.05 the 38.2 percent retracement of the four-week high; 7,529.91 where 14-day relative strength returns to 50; 7,531.92 first pivot resistance | 7,473.00 tonight's Globex low, with 7,470.55 immediately beneath scoring 98.10, the highest-conviction near-market strike on the board. Held cleanly on the overnight test. A decisive break under 7,470 signals a trend-down day |
| 7,538.50 the 18-day crossover; 7,542.55 (7,500) declared resistance and a strike scoring 90.54; 7,544.38 one-SD resistance and 7,544.57 the 40-day crossover, effectively the same price, making 7,542 to 7,545 a genuine confluence where a first rally attempt most likely stalls | 7,462.20 the 38.2 percent retracement from the four-week low; 7,456.67 first pivot support, with a strike at 7,500.55 above and the computed target price 7,450.94 just below. The 7,450 to 7,457 band is the primary downside objective |
| 7,552.55 (7,510) the volatility inflection, the single most important level for Tuesday. Monday's 7,552.00 high tagged it within half a point and reversed. Until reclaimed, every rally is a supply event; above it, hedging flips from amplifying to damping. 7,562.55 (7,520) secondary declared resistance | 7,442.55 (7,400) the declared lower support, backed by a strike at 7,440.55 scoring 97.37; 7,429.08 second pivot support; 7,424.12 one-SD support, aligning with the lower implied bound near 7,425, a realistic worst case for an orderly down session |
| 7,567.22 the 9-day crossover; 7,569.29 two-SD; 7,579.58 second pivot resistance; 7,588.40 three-SD; 7,607.17 third pivot resistance; 7,619.55 a positioning strike; 7,642.55 (7,600) the upside positioning wall scoring 97.05, roughly 158 points or two average daily ranges away | 7,399.21 two-SD support; 7,381.42 third pivot support; 7,357.25 the one-month low; 7,342.55 (7,300) the downside positioning wall and the line whose break would put the intermediate uptrend genuinely at risk; 7,042.55 (7,000) the primary gamma concentration, a longer-horizon magnet only |
One number decides how big Tuesday gets. Everything else follows from it.
See how AlgoIndex turns structure and positioning into systematic signals. The same energy-to-yields chain drove today's crude, gold and Nasdaq notes.
View pricing


