
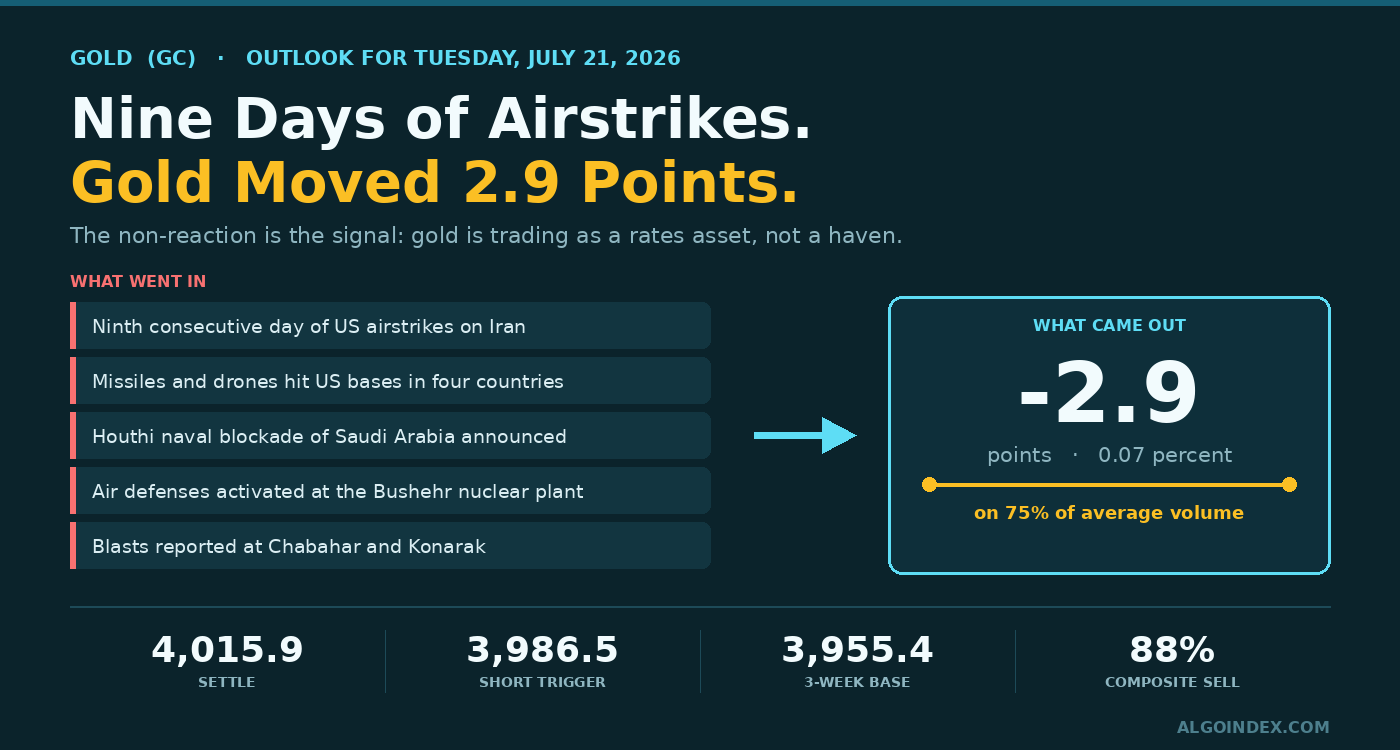
Monday brought a ninth straight day of US airstrikes on Iran, Iranian drones and missiles hitting US bases in four countries, an announced naval blockade of Saudi Arabia, and air defenses going live around a nuclear plant. Gold settled at 4,015.9, down 2.9 points. That's a tenth of one percent, inside a 59.5 point range, on volume three quarters of normal. The non-reaction is the whole story, and it happens because the haven bid is getting intercepted twice: once by a firmer dollar, and harder by a rate path that's drifting toward hikes as energy costs climb. We're bearish with moderate conviction, short on acceptance beneath 3,986.5 toward the 3,955.4 base, with a defined long if the 4,003.6 pivot gets reclaimed instead.
Give a haven asset a war and it's supposed to do something. Monday handed gold nine consecutive days of airstrikes, retaliation across four countries, a blockade announcement, and blasts at Chabahar and Konarak. The metal moved 2.9 points. Down.
I'll admit I expected the blockade headline alone to be worth a spike, even a brief one that got sold. It wasn't worth anything. And once you accept that, the trade for Tuesday writes itself in a direction most people won't like.
A haven that won't bid on this isn't behaving like a haven. It's behaving like a rates asset.
Intercepted twice
Here's the mechanism, and it runs in two stages. The dollar took the first cut, firming 0.18 percent as escalation pushed crude to an 83 dollar settle. Then the rate path took the rest, and that's the part doing real damage. Higher energy costs feed inflation expectations. Push those up and the curve starts discounting a Fed that tightens rather than one that cuts. A governor said publicly that hikes may be needed if this week's core reading runs hot, and a large broker's rates team published research this week under a title referencing three of them.
Gold pays no coupon. Raise the expected policy rate and you raise what it costs to own, directly, with no offset. So even with shells landing, short-dated Treasuries win the argument and so does the dollar. Gold doesn't get a hearing. One bank's commodity desk put the same week in a sentence: oil up, gold stuck, geopolitics colliding with rate fears.
Bonds sold off Monday on that identical logic, with losses attributed to energy feeding inflation. Nominal yields rose. What always matters here is the spread between nominals and breakevens, because real yields are what set the carry cost. Firmer dollar, weaker bonds, a metal going nowhere: from the outside, that combination is real yields on the way up. One small offset showed up: June leading indicators fell 0.2 percent against an expected 0.1 percent decline, a marginally softer growth signal. It changed nothing.
If escalation won't lift gold, then de-escalation takes away whatever premium is still buried in the price. The asymmetry only points one way.
That's the sharpest practical conclusion available from Monday, and it's worth sitting with. Right now the flight to safety is showing up in two places, and gold isn't either of them. It's in the dollar, and it's in crude. Which means a confirmed truce, and mediators have tabled a ten day halt to strikes with Qatari negotiators engaged in Tehran alongside Washington, would remove the little that's left rather than being the bullish surprise most positioning seems to assume.
A rejection measured in single points
The session's shape is worth walking through, because it's tidier than the headline count suggests. Sunday's reopen gapped to 4,005.6, about 13 points under Friday's settle, and that gap got bought. Price worked up through the 4,003.6 pivot to a morning high of 4,046.0, which stalled 1.9 points above the first computed resistance at 4,044.1. Precision like that isn't buyers running out of breath. It's sellers already parked there.
From the high it slid back through the pivot all afternoon and printed 3,986.5, undercutting the one standard deviation support at 3,987.5 by exactly one point before recovering. Settlement at 4,015.9 landed 29.4 points above the low, 30.1 under the high. Almost perfectly mid-range. Rejected above, held below, settled between the two. That's balance. The daily chart can be pointing straight down and it's still balance.
Then it went to sleep. The final four hour bar spanned 14.5 points, roughly a quarter of the day. The last hour covered 5.1. Squeeze a market between a resistance it just failed at and a support it just defended, and the release is expansion. Usually inside a session or two.
Oversold, and that's not the same as cheap
Every average is overhead. The 5-day at 4,028.9 sits 13.0 points above price, the 20-day at 4,080.1 is 64.2 points or 1.6 percent above, the 50-day at 4,329.4 is 313.5 points or 7.2 percent above, the 100-day at 4,599.7 is 583.8 points or 12.7 percent above, the 200-day at 4,559.7 is 543.8 points or 11.9 percent above, and the year-to-date mean sits at 4,691.5. No timeframe gives a buyer the trend at their back. Worth flagging too: the 100-day still sits above the 200-day, meaning the cross hasn't happened yet. When it does fire, systematic sellers tend to show up on cue.
Against that: the 14-day directional index reads 39.88 negative direction at 25.71 against positive at 10.10, a margin north of five to two. In a market trending this hard, oversold is a property of the trend rather than an argument against it.
Relative strength tells the same story more mildly, pinned just under 40 across the short horizons at 39.25, 39.02 and 39.05, then 42.57 and 46.73 further out. Pressure, not exhaustion. To get the 14-day reading back to a neutral 50, gold would need to travel to 4,163.2, about 147 points north of Monday's settle. That's the size of the repair job. The composite reads 88 percent sell, strength strong: 80 percent sell short-term, 75 percent medium, and a full 100 percent long-term, Eleven of thirteen studies read sell outright; the two holdouts say hold, and neither says buy.
Nobody sold the top, and that's the fuel
Gold is 29.6 percent below its January high at 5,706.0 and down 9.65 percent on the year. You'd assume the speculative long side had been carried out somewhere in there. It hasn't. As of the July 14 positioning report, managed money still holds 136,905 long against 16,126 short, a net long of 120,779, and on the week it added 1,964 longs while covering 2,654 shorts. Non-commercials sit net long 186,682, trimming just 6,403 longs while shorts grew 1,161.
Read that again. After a 29.7 percent drawdown from the high, the bulls increased net length. They're averaging down, not leaving. That unliquidated position is exactly what powers a break of 3,955.4 if it comes, and it's why the air beneath the base would probably get crossed quicker than the gap to the next reference suggests.
The hedging community reads the other way, which is the one constructive thread in the report. Commercials hold 79,639 long against 294,427 short, a net short of 214,788, but on the week they put on 20,075 longs against 12,581 shorts, a buy-to-sell pace of about three to two. Swap dealers cut shorts by 5,925 and producers trimmed by 279. That's what absorption at these prices looks like from the physical side.
The options proxy adds two useful details, dated July 18 and therefore one session behind. Dealer boundaries sit at 423 dollars on the proxy, roughly 4,620 in gold terms, and 332, roughly 3,626. That puts one more than 600 points overhead and the other nearly 400 points underneath, so there's no magnet near spot and no mechanical hedging to pin price anywhere Tuesday. With call gamma at minus 78.48 million and put gamma at plus 43.17 million, the short side of dealer books is the upside, so any rally with legs makes them chase it. That doesn't create a bounce. It exaggerates one that starts. And the skew rank at 4.74 percent, near the bottom of its range, says downside protection isn't being bid despite an active war, which given the positioning above reads as complacency and makes bearish structures cheap to build.
The trade: sell acceptance, not the wick
Since June 30 nothing has managed to take out 3,955.4, which doubles as the low of the past month and of the past thirteen weeks. The plan is built around that fact rather than against it. Short on acceptance beneath Monday's 3,986.5 low, entering 3,982.0 to 3,986.0, where acceptance means a completed candle under the level on your execution timeframe, and the cleanest version has price come back up to 4,003.6, fail there, and turn. Don't take the initial wick through.
The stop at 4,004.5 sits just above the pivot for a reason. Take out Monday's low and then get the pivot back, and what you actually had was a sweep for liquidity with the squeeze resolving up. Premise dead. Under the entry the references stack up tight: first computed support at 3,978.2, two standard deviation at 3,974.5, three standard deviation at 3,964.5, then the base. Below the base it thins out badly, with the second computed support at 3,937.7, roughly 18 points under the base, and the third at 3,912.3, roughly 43 points under it. The next meaningful reference after that sits all the way down at 3,805.2. That gap is both the risk in this trade and the reason to hold a runner.
The long is real and conditional, not a courtesy. Should the opening hour hold 3,986.5 and then close a candle back over 4,003.6, buy 4,006.0 to 4,012.0, stop 3,984.0, roughly 25 points of risk, targeting 4,044.1 then 4,059.4 inside that dense 4,059 to 4,063 grouping, and 4,072.8 as the stretch, which needs the dollar to actually turn. Stochastics in single digits on the 50-day, negative dealer call gamma, and a long side that refuses to leave are a workable combination if a soft dollar or a truce headline lights the fuse.
Stand down for thirty minutes after any confirmed announcement on the ten day cessation, in either direction. A truce helps this short directionally, but the first minutes will be violent and two-sided while crude repositions. And take nothing at all if both of Monday's edges trade through inside ninety minutes, if the range is still under 30 points at 11:00, if by 13:00 price is still swinging inside ten points either side of the pivot, or if the midpoint volume count sits under Monday's 100,374, which was thin to begin with. Breaks on falling participation fail.
Expected bands: low 3,960 to 3,985, mid 3,995 to 4,040, high 4,045 to 4,075. A realistic full range is 70 to 90 points, wider than Monday's 59.5 but under the 96.9 average.
Nine days of airstrikes bought gold nothing. Ask what a ceasefire is worth to a market that never charged for the war.
The complete data picture
Every level and reading from the Monday evening GC review. Prices are COMEX gold front month, August 2026, unless a proxy construct is named. Nothing rounded away.
Charted below; the full numeric reference follows.
Full numeric reference , every remaining figure from the review
| Resistance (bottom to top) | Support (top to bottom) |
|---|---|
| 4,044.1 first computed resistance, with Monday's high 4,046.0 just above; tested once and rejected | 4,003.6 the pivot and Tuesday's fulcrum (settle finished 12.3 points above it); 4,000.8 target price; 3,991.5 the 3 and 10-day crossover stall |
| 4,050.1 one-SD resistance; 4,059.3 the 14-day %K stall, 4,059.4 the 9-day crossover, 4,063.1 two-SD, 4,063.4 the 38.2 percent pullback from the four-week low, four methods inside five points | 3,987.5 one-SD support; 3,986.5 Monday's low, the trigger level, undercut by exactly one point and defended |
| 4,069.5 second computed resistance; 4,072.8 the 18-day crossover; 4,073.1 three-SD; 4,080.1 the 20-day average, whose reclaim would be the first structural repair in a month | 3,978.2 first computed support; 3,974.5 two-SD; 3,964.5 three-SD |
| 4,096.8 the 50 percent four-week pullback; 4,110.0 third computed resistance; 4,130.2 the 38.2 percent from the four-week high; 4,130.7 the convergence-divergence stall | 3,955.4 the one-month and thirteen-week low, unbroken for three weeks, the defining base |
| 4,163.2 where 14-day relative strength reads 50; 4,238.2 one-month high (June 22); 4,248.7 the 40-day crossover; 4,890.7 thirteen-week high; 5,706.0 52-week high | 3,937.7 second computed support; 3,912.3 third; 3,805.2 where 14-day relative strength reads 30; 3,441.5 the 52-week low |
A haven that won't bid on a war is telling you what it's actually trading on.
See how AlgoIndex turns trend and positioning into systematic signals. Read today's crude note, the other side of the same headline flow, or the Nasdaq note and the S&P note on the yield move both of them drove, and the next-day ES note where the market reclaimed this short lean.
View pricing


