
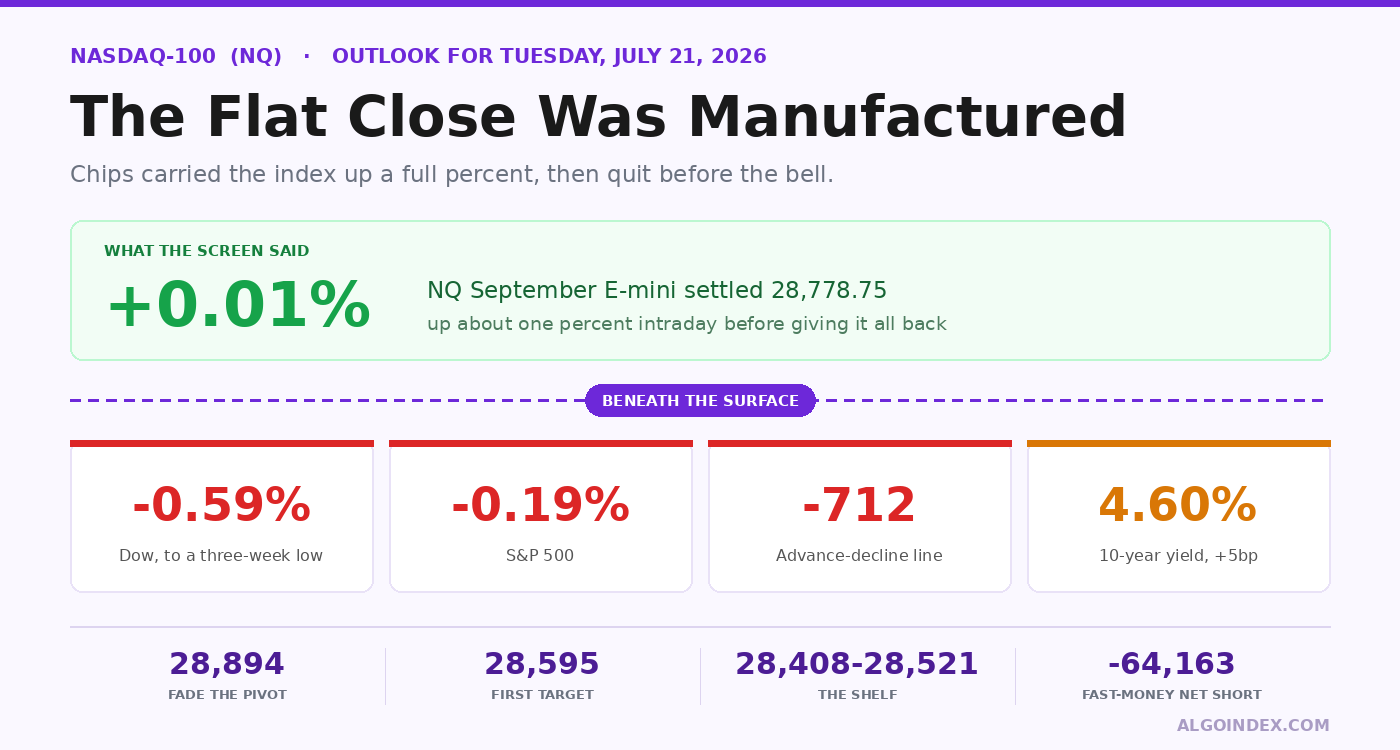
The Nasdaq-100 settled at 28,778.75, up a hundredth of a percent, on a day the S&P fell 0.19 percent and the Dow dropped 0.59 percent to a three-week low. That green print was manufactured. Chips ripped off the open after the sector had already entered a bear market, carried the index roughly one percent higher, then bled away all afternoon as the 10-year yield added five basis points to 4.60 percent on an 83 dollar crude settle. Round-tripping a full percent and closing unchanged is what distribution looks like. We lean lower, but on a short rope: fade strength into the 28,894 pivot toward 28,701 and 28,595, and flip long only if the dense 28,408 to 28,521 shelf gets tested and holds.
Look at the close and Monday was a nothing day for the Nasdaq-100. Up 0.01 percent. Look at what it cost to produce that number and it was among the month's most revealing sessions.
The index was up about a percent at midday. It gave every point back. Meanwhile the Dow lost 0.59 percent to a three-week low, the S&P shed 0.19 percent, and the advance-decline line came in around negative 712. Most stocks fell. A narrow group of chips held the benchmark up until it couldn't.
A flat index sitting on top of a negative advance-decline line is not calm. It's concentration.
The bounce that ran out of buyers
Semiconductors led from the bell. The sector index had already crossed into a bear market, down more than 20 percent from its high, and Monday it rallied hard off that. Broadcom finished up 1.98 percent, Teradyne up 3.54, SanDisk up 2.67. Individual names closed firm.
But the shape was wrong. The rally started at the open and faded through the afternoon, which is what a relief bounce meeting supply looks like, not what a bottom looks like. I'll own that I read the early strength as the follow-through I'd been waiting for after Friday's flush. It wasn't. By the close it had given back the entire move, and the index only stayed green because the fade stopped just short of zero.
Friday's note on this index argued the AI capex rout had the shape of a flush worth buying near the base. That part still holds: Friday's 28,408.25 low is intact and Monday settled 370 points above it. What Monday added is that the first attempt to leave that base failed. The base is holding. The exit isn't working yet.
Yields did the damage, and energy did the yields
The chain runs backward from the price action. A ninth straight day of strikes between the US and Iran put crude at a five-week high, settling near 83 dollars. Higher energy costs pushed inflation expectations up, bonds sold off, and 4.60 percent on the 10-year was five basis points dearer than Friday. In the evening session it eased to about 4.59, a shrug rather than a reversal.
That's the worst version of a yield move for this index. Rates rising on growth optimism at least brings demand with it. Rates rising because oil is expensive brings a margin problem and a multiple problem and nothing on the other side of the ledger. Of the major benchmarks this one carries the sharpest rate sensitivity, because its value is anchored in cash flows sitting far out in time. Each additional basis point of real yield squeezes it harder than the rest. The dollar index sat near 100.96, effectively unchanged, which leaves the yield path as the only macro variable that mattered.
Rising yields on an energy shock give a long-duration index the valuation headwind without the growth offset. That the Nasdaq still outperformed makes Monday more notable, not less.
Oversold inside a downtrend that's still real
Both halves of this need holding at once, because the setup is genuinely contradictory and most people will only carry one.
The bearish half: NQ has dropped 1,027.50 points in five sessions, 3.45 percent, and 1,957.00 points over the month, 6.37 percent. Price sits under the 5-day at 29,046.75, the 20-day at 29,588.49 and the 50-day at 29,851.41, about 268, 810 and 1,073 points respectively. The 9-day directional index reads 27.76 with negative direction at 28.07 dominating positive at 10.52. All five short-term components of the composite read sell, a clean 100 percent.
The 100-day still reads 70.52 percent. Read that as a near-term flush nested inside an advance that's still intact, rather than as a break in the structure.
The bullish half: at 16.52 percent on the 14-day and 15.46 on the 20-day, the stochastics qualify as oversold by any standard measure. Price holds well above the 100-day at 27,841.05, by about 938 points, the level roughly 940 points below the market that decides correction from something larger, and the 200-day at 26,900.04, by about 1,879. The index is still 24.14 percent above its 52-week low of 23,170.50 and 18.43 percent higher than a year ago, with three-month performance positive at 7.01 percent. Relative strength is more measured than the stochastics suggest, the 9-day at 35.85 and the 14-day at 41.11. Under the midpoint, yes, but 30 is still a long way off.
And the directional readings decay as you lengthen the lookback: 27.76 on the 9-day, 19.84 on the 14-day, 15.50 on the 20-day. Only the shortest horizon reads as a genuine trend. Strong up close, undefined further out. That's a decline running out of road rather than one gathering pace. The composite even carries a dissenting buy, the 20 versus 100-day crossover, which is this same contradiction turning up in the arithmetic.
The short side is crowded and the earnings are Wednesday
Positioning as of July 14 splits sharply by who's holding it. The fast-money fund category is net short 64,163 contracts, having added 7,046 shorts and cut 2,104 longs in a single week. Asset managers are net long 74,063 and trimmed only modestly. Fast money is aggressively positioned for lower; long-term allocation hasn't budged. Dealers pulled back their net short too, covering 10,212 shorts while putting on 9,005 longs.
Put that crowded short book next to an oversold index, add positive gamma at the broad-market level and a major catalyst two days out, and every ingredient for a violent squeeze is on the table. It doesn't forecast one. It does mean any upside surprise travels further and faster than the chart alone would justify.
The catalyst is Wednesday after the close: Alphabet and Tesla, joined by Texas Instruments, ServiceNow and IBM, with Intel following July 26. No heavyweight reports Tuesday at all, so the day is about getting positioned rather than reacting. And the positioning is visible already, roughly negative three billion dollars of single-stock delta notional, the bulk of it longer-dated puts bought on precisely the mega-caps due Wednesday. Rational hedging, and also a real source of dealer selling if those names drift.
One number explains Monday's whole shape better than anything on the price chart: one-month implied correlation closed at 6.8. That is extraordinarily low. What it tells you is that violent single-name moves are expected while the benchmark itself stays penned in, which is precisely an earnings-week profile and precisely how you get a flat index sitting on top of a negative advance-decline line. Fixed-strike implied volatility rose 1.5 to 4 points for this week's expiration and barely moved beyond it. All the demand for protection is aimed at the event itself.
The trade: fade the pivot, buy the shelf
The plan sells strength rather than selling here. Price already sits 115 points under the pivot. Going short at the bottom of a two-day range, into oversold readings, against a crowded short book is how traders get squeezed. Let it come to you.
Overhead the references stack close together. The 20 percent stochastic reference is at 28,846.55, Monday's overnight high at 28,832.50, and the 5-day average waits at 29,046.75 as the layer above the stop. Push through 29,077 and you open 29,190.24 at one standard deviation, then the real shelf where 29,360.68 at two standard deviations, 29,376.42 at the second pivot resistance and 29,386.07 at the 38.2 percent retracement of the four-week decline all converge. That confluence is the sturdiest resistance on the board, and it lines up broadly with the recent swing high running 29,150 to 29,400.
The long is where this gets interesting. Inside a 113 point span, four separate methods all point at the same zone: the 38.2 percent retracement of the 13-week advance at 28,520.78, the computed target at 28,504.11, the second pivot support at 28,410.92, and Friday's one-month low at 28,408.25. Buy 28,420 to 28,510, but wait for price to steady inside the shelf. The first touch is not the trade. Stop 28,340, under one standard deviation support at 28,367.26, again about 125 points. Targets 28,701, 28,830 and the 28,894 pivot, about 240, 365 and 429 points, so roughly 1:1.9, 1:2.9 and 1:3.4.
Respect what sits below that shelf, or rather what doesn't. One standard deviation support is 28,367.26, two is 28,196.82, the third pivot support is 28,112.08, and the 61.8 percent retracement from the 52-week low is 28,070.93 with three standard deviations right alongside at 28,066.03. Lose 28,408 decisively and 28,070 to 28,112 comes quickly, because there's almost nothing in between. That thin air is exactly why the proxy's short-gamma configuration matters: at the fund level call gamma reads about negative 393 million and put gamma about negative 1.25 billion, so hedging there amplifies moves rather than damping them.
Take nothing before 09:45 or after 16:00. Skip any session that gaps more than one average daily range, roughly 615 points, since gap days ignore pre-computed levels. Skip a Middle East headline until price has built a range around it: an escalation report gaps this index toward 28,500 and lifts crude, while a confirmed cessation gaps it toward 29,000 and pressures crude, and neither is predictable. And skip the middle: price oscillating between 28,700 and 28,830 without testing the pivot above or the pivot support below has no edge in it. If chips diverge sharply from the index, the index-level read stops being reliable at all.
Expected bands: low 28,410 to 28,595, mid 28,595 to 28,895 (base case), high 28,895 to 29,080. A full one-ATR day spans 28,128 to 29,430. Position for 600 points of movement. Not 300.
The index closed green on one narrow bounce that quit before the bell. Find out Tuesday whether anything else is willing to hold it up.
The complete data picture
Every level and reading from the Monday evening NQ review. All prices are the September E-mini contract unless a proxy or cash construct is named. Nothing rounded away.
Charted below; the full numeric reference follows.
Full numeric reference , every remaining figure from the review
| Resistance (bottom to top) | Support (top to bottom) |
|---|---|
| 28,832.50 Monday's overnight high; 28,846.55 the 20 percent stochastic reference; 28,893.67 the pivot, about 115 points over the settle. Everything from 28,832 to 28,894 forms the immediate ceiling and where the primary setup engages | 28,701.00 the overnight low, first reference on a soft open; 28,594.83 the first pivot support, last level before the dense shelf |
| 29,013.25 the 50 percent retracement of the 13-week range; 29,046.75 the 5-day average; 29,077.58 the first pivot resistance and the invalidation line | The dense shelf, four references inside 113 points: 28,520.78 the 38.2 percent retracement of the 13-week advance, 28,504.11 the computed target price, 28,410.92 the second pivot support, 28,408.25 the one-month low set Friday July 17 |
| 29,190.24 one-SD resistance; then the strongest confluence on the board at 29,360.68 (two-SD), 29,376.42 (second pivot resistance) and 29,386.07 (38.2 percent retracement of the four-week decline) | 28,367.26 one-SD support; 28,196.82 two-SD; 28,112.08 third pivot support; 28,070.93 the 61.8 percent retracement from the 52-week low, tracked by 28,066.03 at three-SD. Little structure between 28,408 and 28,070 |
29,463.28 the 9-day average crossing 29,491.47 three-SD 29,560.33 third pivot resistance 29,603.33 where 14-day relative strength reads 50 29,636.87 the 18-day crossing 29,947.14 the 40-day crossing 29,990.17 the 38.2 percent retracement of the four-week high, making 30,000 the level that ends the decline outright | Deeper structural references, none in play Tuesday absent a shock: 27,841.05 the 100-day average, 27,135.25 the 50 percent retracement of the 52-week range, 26,926.50 the 13-week low |
A flat close built by one narrow bounce is a position, not a verdict.
See how AlgoIndex turns structure and positioning into systematic signals. Read today's gold note and crude note, plus the next-day S&P note on the chip-led reclaim, and the Nasdaq companion.
View pricing


