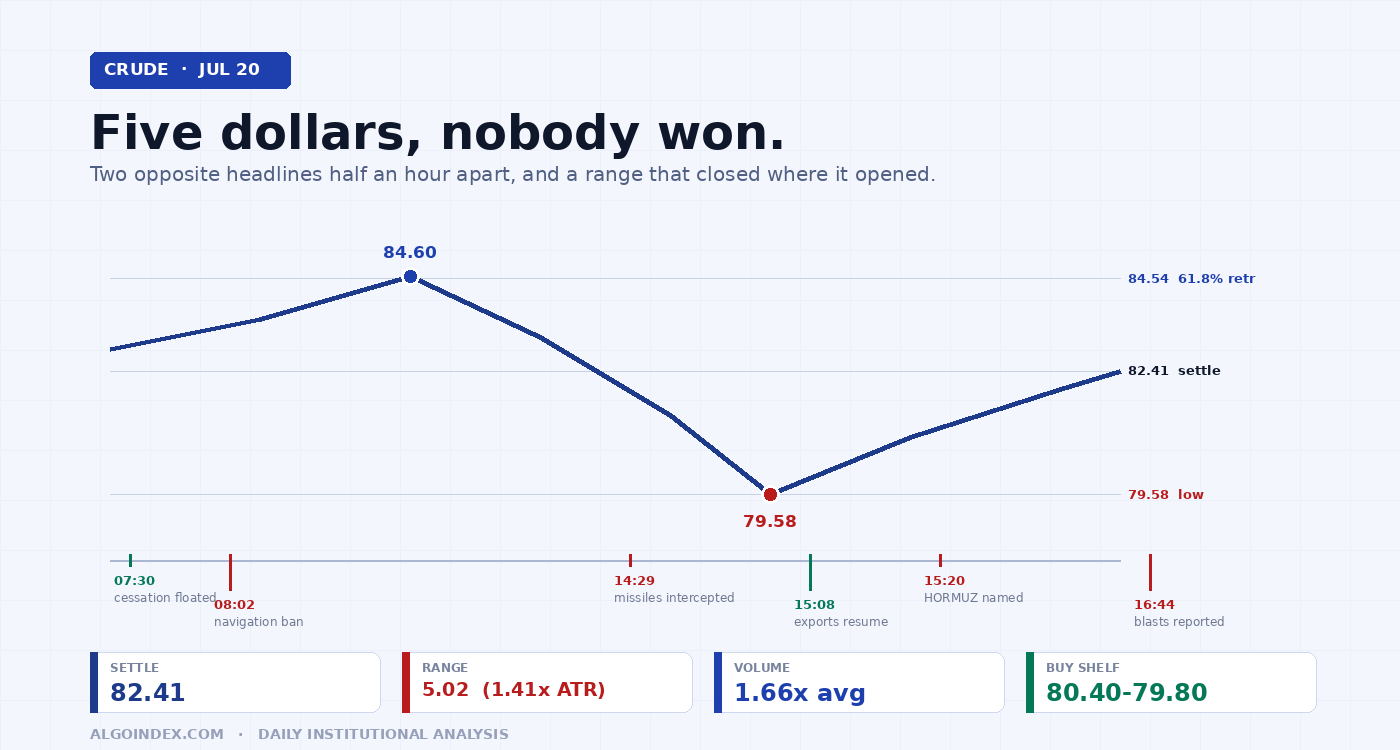
WTI tagged the 61.8 percent retracement to within six cents, gave back 5.02 dollars, then bought most of it back on 1.66 times average volume. Two opposite headlines half an hour apart. Levels, the 80.40 shelf long, and three paths for Tuesday.
The 60-second read
Crude settled Monday at 82.41, up 0.77 percent. That number hides everything that happened. The contract opened 82.91, ran to 84.60, collapsed 5.02 dollars to 79.58, then bought back most of the damage into the close, all on volume 1.66 times the twenty-day average. One de-escalation headline and one escalation headline landed half an hour apart, and they framed everything after. Sellers got their test. So did buyers. Neither finished the job. We're cautiously bullish above 81.21 with the 84.54 to 84.73 band as the decision point overhead, and the plan is to buy the shelf that already proved itself rather than chase the level that just rejected.
Six cents. That's how close Monday's high came to the most-watched retracement on the crude chart, and then the market handed back five dollars.
Here's the arithmetic behind that. The May 18 high at 95.30 and the July 2 low at 67.12 define a 28.18 dollar decline. The 61.8 percent retracement of that decline sits at 84.54. Monday's high printed 84.60. A level that specific doesn't get tagged by accident and rejected by five dollars on a whim. It gets defended.
In Friday's crude note we put the primary upside magnet at 84.54 and called the advance overbought and one headline away from unwinding. Monday delivered both halves of that in a single session, which is satisfying and slightly unnerving at the same time. My own reflex Friday was that 82 would cap it. Wrong, and wrong in an instructive direction: price cleared 82 inside the first hour, kept going, and then gave the whole excursion back. The lesson wasn't the one I expected to be taught.
82.41
Settle, +0.77%
5.02
Dollar range (1.41x ATR)
1.66x
Average volume
84.54
The line that held
Thirty minutes that set the whole day
At 07:30 Eastern, before the cash open, a senior Iranian source said mediators were floating a ten day halt to strikes as a way back into the interim deal with Washington. Peace, or the shape of it. Thirty two minutes later, Yemen-based forces announced a sea navigation ban on Saudi Arabia. War, or the shape of that.
Two opposite headlines inside half an hour. Crude had to price both, and it spent the rest of the session doing exactly that, which is the cleanest explanation anyone will give you for why a 5.02 dollar range resolved almost precisely where it started.
Monday's headline sequence, and what it did to price
07:30
▼
Mediators float a ten day halt to strikes to revive the interim deal de-escalation
08:02
▲
Yemen-based forces declare shipping to Saudi Arabia off limits escalation
12:41
▲
US administration states Iran will pay many times over for any American soldier killed
14:29
▲
Jordan intercepts three missiles launched from Iran
14:46
▲
A drone carrying explosives is brought down by an airbase at Erbil in northern Iraq
15:08
▼
Yemen's Presidential Council says work begins on resuming oil exports supply-additive
15:20
▲
Iran calls the Strait of Hormuz a critical pressure point on which it will show no leniency the day's most significant headline
15:29
▬
US officials focus on Iranian conduct in the strait, while confirming talks continue
16:25
▲
Air defenses go active around the Bushehr nuclear site
16:35
▬
Saudi-led coalition pledges to protect ships in Bab el-Mandeb and respond firmly
16:44
▲
Blasts reported at Chabahar and Konarak
16:59
▲
Ansar Allah declares anti-ship missiles ready against any vessel violating the blockade
Both tracks ran live at once. That's genuine two-way risk, not a directional edge.
One distinction decides how much any of this is worth in price. Traders keep treating Bab el-Mandeb and Hormuz as the same headline. They price very differently. Ships can go the long way round southern Africa to dodge Bab el-Mandeb, which bills the market in freight and calendar days while the barrels still arrive. Hormuz has no such workaround for most Gulf production, and about one in five seaborne barrels worldwide moves through it. Restrict that and the barrels simply don't show up. When Iran's deputy secretary of the Supreme National Security Council named that strait specifically at 15:20, the market got handed something it can't discount cheaply.
Cutting the other way, and this is why the premium wouldn't stick: Yemen's Presidential Council said work would begin on resuming oil exports, and US officials confirmed talks were continuing. Supply coming back and a mediation track still breathing. That's the whole session in one sentence.
Absorption, not distribution
Anatomy of a 5.02 dollar day
79.58 low
84.60 high
SETTLE 82.41
CLOSE POSITION IN RANGE
57.8%
upper half, not commanding
RANGE VS 14-DAY ATR
1.41x
3.56 average, 5.02 realized
VOLUME
324,200
vs 194,684 twenty-day
Heavy volume, an outsized range, and a close in the upper half. That combination reads as absorption.
How participants behaved tells you more than the numbers do. Whoever sold 84.60 got their five dollars and then ran out of road at 79.58. Buyers reclaimed 56 percent of the range and closed price back above the 81.21 midpoint retracement, but couldn't hold the high. Both edges tested, both held, nobody resolved anything.
The final four-hour bar printed 82.17 open, 83.17 high, 81.82 low, 82.42 close, which shows the recovery still carrying upward pressure into the settle rather than fading. Then the closing thirty minutes compressed to a 0.16 range: 82.49 open, 82.56 high, 82.40 low, 82.42 close. A market resting, not one being pressed.
Strong trend, stretched clock
Every trend measure still reads constructive. Price sits above all five major moving averages: the 5-day at 80.07 by 2.34, the 20-day at 73.32 by 9.09, the 50-day at 80.87 by 1.54, the 100-day at 80.07 by 2.34, and the 200-day at 69.76 by 12.65. The 9-day directional index reads 40.66 with positive direction at 36.99 against negative at 8.15, which is a strongly trending environment by any standard. Crude has added 9.81 percent over twenty sessions and 44.68 percent year to date, and 22.88 percent off the July 2 low in about three weeks.
Move that fast and something has to be stretched. The stochastics are: 9-day raw at 84.77 percent with percent-K at 88.28, and both the 14 and 20-day raw readings at 87.87 percent with percent-K at 89.70. The 9-day relative strength sits at 72.04, in overbought territory. But the longer measures argue the other way, and this is the counterweight that keeps me from treating the rejection as terminal. The 14-day relative strength reads 62.53, and the computed level where it would register 70 sits at 88.51 in price terms. Crude could add six more dollars before the primary momentum measure calls it overbought. The 50-day stochastic reads a neutral 54.51 percent raw.
Then there's the odd shape of the composite, which scores 56 percent buy overall with strength soft and direction strengthening. Split by horizon it goes 60 percent buy short-term, 25 percent buy medium-term, 67 percent buy long-term. Strong at both ends, weak in the middle.
The barbell: strong at both ends, weak in the middle
60%
SHORT-TERM
the three-week rally
25%
MEDIUM-TERM
still holding the July decline
67%
LONG-TERM
the higher base from earlier
The middle sags because the 20-day average at 73.32 still sits under the 50-day at 80.87 and the 100-day at 80.07. It's rising steeply. When it crosses, that 25 percent resolves upward on its own.
Which means that sagging middle is arithmetic catching up, not a warning anyone should act on. Weight it accordingly, well below what the 56 percent headline suggests. Of the thirteen component studies, nine register buy, two hold, and the two that register sell are precisely those moving-average crossovers.
The plan follows from the behavior. Buyers demonstrated themselves at 79.58 after a five dollar flush, on heavy volume, and no other level on this chart has earned its status the same way, by absorbing a flush in real time. Chasing a level that just rejected price by five dollars is the lower-quality proposition.
CL primary setup, long the proven shelf
Entry (scale in)
80.40-79.80
Stop (close)
78.45
T1 / T2
82.35 / 83.26
T3 (scale out)
84.54
From an 80.10 average entry the risk is 1.65. T1 returns 2.25 for about 1:1.36, T2 returns 3.16 for 1:1.92, T3 returns 4.44 for 1:2.69. The stop sits under the 79.06 to 79.12 three-method convergence and under 78.58, where price crosses the 40-day average
With a 3.56 dollar average true range, anything tighter is inside the noise
No entries before 09:45 Eastern
The entry band contains the computed pivot at 80.59 on its upper approach and the one-standard-deviation support at 79.86, and it rests on top of the price buyers already stood up for. Target 3 at 84.54 is a scale-out, not a hold-through, for the obvious reason that it has already rejected price once. Close under 78.58 and it's over. That level is where a dip inside an advance stops being a dip.
One conditional short deserves a mention, though it only exists if crude gets back to 84.50 to 84.70 without pausing to catch its breath somewhere lower first, which is a narrow door. Come back at a level that just threw you off without resting first and it usually throws you off again. Four separate methods land inside 23 cents there: two-standard-deviation resistance at 84.50, the 61.8 percent retracement at 84.54, Monday's high at 84.60, and second computed resistance at 84.73. Stop 85.50, targets 83.26, 82.35 and 81.21. Abandon it fast if wrong, because a genuine clearance opens 87.40.
One scheduling note that should shape sizing more than any level on this page. The weekly industry inventory estimate lands at 16:30 Eastern, after the equity cash close, and more often than not it's the biggest single move the front contract makes all day. A market with a 3.56 dollar average true range can travel a full dollar on that headline alone. Take the first objective before 16:00, carry a reduced position or none at all through the print, and let it build Wednesday's setup ahead of the official government figure at 10:30.
Tuesday's three paths
A · 55% consolidation
B · 25% upside
C · 20% failure
A. Oscillates roughly 80.20 to 83.60, tests the 80.59 pivot or the 82.35 target at least once, closes without violating 79.58 or 84.60. That rotation down into the shelf is what arms the primary plan
B. Reclaims 83.70 and presses the 84.50 to 84.73 band, either stalling into it for Wednesday or clearing toward 85.11 to 85.43. Trend and directional movement both support this eventually
Timing is the question, not direction
C. Gives up 81.21 early, grinds the 80.59 pivot, then 79.58, and if the break sticks, on to where 79.06, 79.08 and 79.12 stack up, with 78.58 behind them
Needs a fresh bearish catalyst or a dollar advance
Working expected band 79.50 to 84.60. Sessions that establish a 1.41 average-range day on 1.66 times volume rarely expand that range the next day.
Monday tagged the line to within six cents and got thrown back five dollars, then bought most of it again before the bell. Nobody won that argument. Tuesday just decides who's still willing to have it.
The complete data picture
Every level and reading from the Monday evening CL review. Prices are NYMEX WTI front month, September 2026. Nothing rounded away.
Charted below; the full numeric reference follows.
CHARTED
Level map
August WTI · every reference from the review, to scale
BELOW PIVOT 76-81ABOVE PIVOT 81-89DECISION BAND: FOUR METHODS IN 23 CENTS 84-85
Monday tagged the 61.8 percent retracement at 84.54 to within six cents, then gave back 5.02 dollars and bought most of it back on 1.66 times average volume. The 79.80 to 80.40 shelf is the most behaviourally proven support on the chart.
Session path
How Monday actually traded
Labelled prints are exact from the review; intermediate points follow the described sequence rather than tick data.
Expected range
Scenario bands against the implied move
The mid band is the settlement zone. Treat the outer bands as tails that need a headline.
Primary setup
Entry, stop and targets to scale
Risk is measured from the midpoint of the entry zone. Reward blocks are drawn proportionally, so the R-multiples are visible rather than asserted.
Session calendar
All times Eastern
Timed items from the review. Direction on a light calendar comes from headlines and positioning rather than scheduled data.
Full numeric reference , every remaining figure from the review
Resistance (bottom to top)
Support (top to bottom)
82.35 computed target price, fractionally under the settle, the first pivot to hold rather than clear
81.78 Friday's close, the line separating an up day from a down day
83.26 first computed resistance, doubled by Monday's final four-hour high at 83.17; 83.70 one-standard-deviation resistance
81.21 the 50 percent retracement of the 95.30 to 67.12 decline, reclaimed into the close; losing it turns the read neutral
84.50 to 84.73 the decision band: two-SD 84.50, 61.8 percent retracement 84.54, Monday's high and one-month high 84.60, second computed resistance 84.73
80.59 computed pivot; 80.08 to 80.09 the 14-day stochastic stall with the 61.8 percent retracement from the 52-week low; 79.86 one-SD support
85.11 to 85.43 extension shelf (three-SD 85.11, the 3-10 day crossover stall 85.43); 87.40 third computed resistance
79.58 Monday's low, the most behaviorally proven support; 79.06 to 79.12 three-method convergence (first computed support 79.12, two-SD 79.06, stochastic 80 percent level 79.08)
88.51 where the 14-day relative strength would register 70; 95.30 the 52-week and 13-week high, 13.45 percent above the settle
78.58 the 40-day average crossing; 78.45 three-SD support; 77.88 to 77.92 paired retracements above the 77.39 five-day base; 76.45 and 74.98 second and third computed supports; 67.12 the July 2 low, 18.6 percent below
Contract
NYMEX WTI front month, September 2026 (CLU26). Review prepared Monday evening July 20 for the Tuesday July 21 regular session
Session prints
Settled 82.41, up 0.63 (+0.77 percent) from Friday's 81.78. Opened 82.91, high 84.60, low 79.58, range 5.02 dollars (1.41 times the 14-day average true range, 6.1 percent of contract value)
Volume near 324,200 against a 20-day average of 194,684 and a five-day average of 277,675. Close at 57.8 percent of the day's range
Final four-hour bar
open 82.17, high 83.17, low 81.82, close 82.42. Closing 30-minute bar compressed to 0.16: open 82.49, high 82.56, low 82.40, close 82.42
Structure
May 18 high 95.30 to July 2 low 67.12 is a 28.18 dollar decline
the 61.8 percent retracement sits at 84.54 and the 50 percent at 81.21. Five-day range 77.39 (July 14) to 84.60
one-month range 67.12 to 84.60. Up 22.88 percent off the July 2 low in about three weeks, 9.81 percent over twenty sessions, 44.68 percent year to date
The swing sequence holds higher lows
67.12, then the 77.39 base, then Monday's 79.58 defense. 84.60 converts from a continuation print into a swing pivot
the 14-day reads 70 at a price of 88.51. Stochastics: 9-day raw 84.77 percent with %K 88.28 and %D 88.02
14 and 20-day raw both 87.87 percent with %K 89.70 and %D 88.72
50-day raw a neutral 54.51 percent with %K 48.71. Directional index 40.66 (9-day, +DI 36.99 vs -DI 8.15), 24.10 (14-day, +DI 31.84 vs -DI 12.73), then 16.81, 13.43 and 11.44 on 20,50 and 100 days
Composite 56 percent buy, strength soft, direction strengthening
Of thirteen studies, nine buy, two hold (the 40 and 60-day commodity channel indices), two sell (the 20-vs-50 and 20-vs-100 crossovers)
Volatility and range
Average true range 3.55 (9-day), 3.56 (14-day), 3.61 (20-day), 3.51 (50-day), running 4.26 to 4.38 percent of price
Average daily range 3.62, 3.11 and 3.08 on 9,14 and 20 days
Historic volatility 48.98 percent (9-day) and 44.72 percent (14-day)
One 14-day ATR around the 80.59 pivot gives 77.03 to 84.15
one 14-day ADR around the settle gives 79.30 to 85.52
blended working band 79.50 to 84.60
Drivers
Supply risk was transit, not production
Yemen-based forces declared anti-ship missiles ready against vessels violating a threatened blockade
a Saudi-led coalition committed to protecting Bab el-Mandeb shipping
Bab el-Mandeb can be bypassed around southern Africa at a cost in time and freight
Hormuz carries roughly a fifth of seaborne crude with no practical bypass, making a credible restriction a volume event
Blasts at Chabahar and Konarak and air defenses at Bushehr raised the odds of direct disruption to Gulf loadings
Against that, Yemen's Presidential Council said oil-export work would resume
Demand
no data released
the 22.88 percent advance off the low is hard to sustain on supply anxiety alone, and the read on rising energy costs ran through inflation, not through any argument that demand had improved
German and UK flash activity readings arrive Friday
Rates
bonds sold off on the energy-inflation channel, UK gilts fell sharply on fiscal concern with a new Chancellor named at 13:14 ET, and Canadian inflation printed 2.8 percent year over year against 2.9 percent expected and 3.2 percent prior, with month over month at minus 0.4 percent against minus 0.2 percent expected and core at 2.1 percent annual against 2.2 percent prior
Cross-asset
a risk-off session, most large-cap US equities lower, a semiconductor index rebounding after entering a bear market
Trajectory context
July 15 reporting had the US leaning toward expanded operations, July 16 that Iran told Yemeni forces to close Bab el-Mandeb if its power network were struck, July 17 that refueling aircraft were heading to Israel
Participation
Volume near 324,200 ran about 1.66 times the 20-day average of 194,684 and above the 277,675 five-day average. When a reversal that wide closes in the top half on volume like that, the selling was taken down rather than longs being forced out. Directional readings corroborate: +DI 36.99 against -DI 8.15 on nine days
Setup and paths
Long 80.40 to 79.80, scaling in
Stop 78.45 on a closing basis
T182.35, T283.26, T384.54 (scale-out)
From an 80.10 average entry, risk 1.65
returns 2.25, 3.16 and 4.44 for about 1:1.36, 1:1.92 and 1:2.69. Invalidation: a sustained close beneath 78.58. Macro override: a materially bearish 16:30 inventory estimate or an unexpected dollar advance
reduce or exit ahead of the print rather than defending through it
Alternate short, conditional on reaching the band without an intervening consolidation: entry 84.50 to 84.70, stop 85.50, targets 83.26, 82.35, 81.21
from 84.55 with an 85.50 stop the risk is 0.95 for returns of 1.29, 2.20 and 3.34 (1:1.36, 1:2.32, 1:3.52)
void on a decisive close above 85.43. Paths
A consolidation 55 percent (80.20 to 83.60), B upside resolution 25 percent (reclaim 83.70, press 84.50 to 84.73, possibly 85.11 to 85.43), C downside failure 20 percent (lose 81.21, work 80.59 then 79.58, then 79.06 to 79.12 and possibly 78.58)
Expected-range scenarios
low 78.45 to 79.60, mid 80.20 to 83.60, high 84.20 to 85.40. Skips: price opening beyond either edge of the 79.58 to 84.60 range without retesting it from outside
a morning spent oscillating 81.50 to 83.00 without approaching either the entry shelf or the decision band
any entry before 09:45 or after 16:00 ET
Calendar (Tue Jul 21, ET)
No high-impact US macro release is scheduled; every confirmed Tuesday event is European, Asian or corporate. 02:00 UK labour market block: unemployment expected 4.9 percent against 4.9 prior, employment change minus 8 thousand against 2 thousand prior, average weekly earnings 4.5 percent against 4.4, earnings excluding bonus 3.4 percent against 3.4, three-month employment change 80 thousand against 100 thousand. 04:00 European Central Bank bank lending survey. 05:00 German ZEW economic sentiment expected 15.3 against 10.5 prior, current conditions minus 77.7 against minus 81.0. 06:30 an industrial conglomerate and a major automaker report, 07:30 a brokerage. 18:45 Monday evening, New Zealand inflation, quarterly expected 1.4 percent against 0.9 prior and annual 4.0 percent against 3.1. 16:30 the weekly industry crude inventory estimate, the one scheduled release that genuinely matters to crude, arriving after the equity cash close. Ahead: the official government inventory report Wednesday 10:30, the European Central Bank decision and press conference Thursday, Canadian retail sales Thursday 08:30, German and UK flash activity readings Friday
Sourcing note
This run confirmed the energy headline feed and the macro calendar directly. Formal positioning data, futures term structure and refined product cracks could not be verified and are deliberately not asserted anywhere above. Refined product cracks, natural gas, gold and the dollar index were not individually confirmed
Two live tracks, one chokepoint that can't be bypassed, and a five dollar argument nobody won.
See how AlgoIndex turns structure and positioning into systematic signals. Read Friday's crude note, the one that put the magnet at 84.54, or today's gold note, where the same headlines produced nothing at all, or the next-day crude note this long ran into.
AlgoIndex publishes institutional-grade reviews on ES, NQ, GC, and CL, built on professional-grade market data and our own analysis, priced for individual traders.