
ES 7,362 0.42%NQ 29,850 0.83%GC 4,358 0.56%CL 88.43 2.20%VIX 18 1.10%● TONIGHT'S MARKET REVIEW PUBLISHES 8:30 PM ETES 7,362 0.42%NQ 29,850 0.83%GC 4,358 0.56%CL 88.43 2.20%VIX 18 1.10%● TONIGHT'S MARKET REVIEW PUBLISHES 8:30 PM ET
AlgoIndexPromo

Crude Oil: A War-Premium Uptrend Pressing the 85 Breakout, With Ceasefire Risk

Market OutlookPublished For the session12 min readby AlgoIndex Research Team
Crude Oil: A War-Premium Uptrend Pressing the 85 Breakout, With Ceasefire Risk

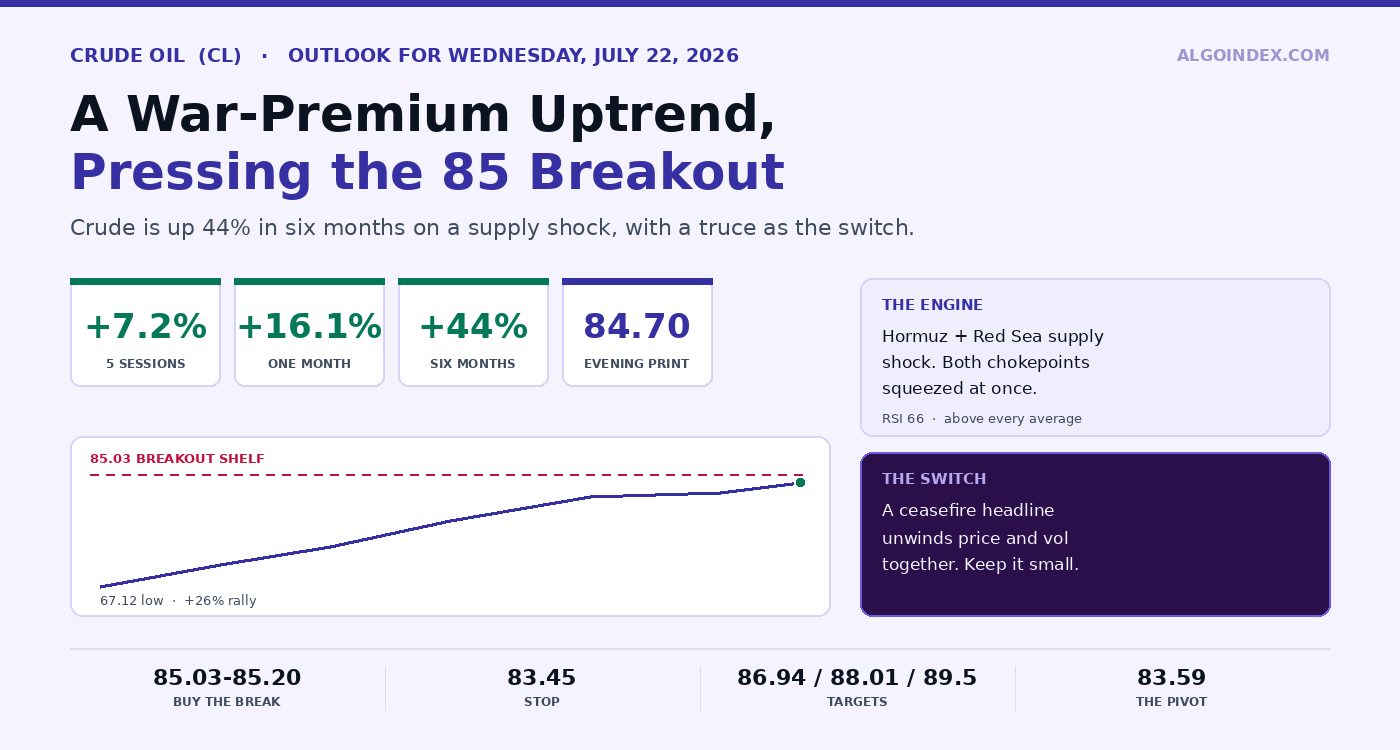
WTI prints 84.70, up 44 percent in six months on a US-Iran supply shock choking Hormuz and the Red Sea. A live ceasefire proposal is the two-way switch. Buy a break above 85.03, sized small, and stand aside on any truce headline.

The 60-second read

WTI is grinding out a strong uptrend driven by the wires. September took over as front month when August expired Tuesday, and it prints 84.70 into the evening, with the departing August closing up 2.02 percent at a five-week high. This isn't a one-day move: crude is up 7.2 percent in five sessions, 16.1 percent on the month, and about 44 percent over six months, sitting only 11 percent under its 52-week high of 95.30. The engine is an active US-Iran conflict pinching the two busiest oil arteries together, Hormuz and the Red Sea. The catch is a ceasefire proposal running in parallel, which knocked crude down 1 percent intraday Tuesday before supply headlines pushed it back up. So this is a real bull trend sitting on a two-way switch. We buy a clean break and hold above 85.03, small, and we stand aside on any truce headline.

Monday's note on this contract bought the proven shelf toward 84.54. Crude tagged 84.60, ran to 84.91, and never looked back. That one paid, and it's now pressing right up against the level that decides whether the trend extends.

The hard part isn't the direction. It's that one headline can flip the whole thing overnight.

A trend, not a spike
+7.2%
5 sessions
+16.1%
One month
+44%
Six months
-11%
Below 52-wk high 95.30

A 26 percent rally off the 67.12 low, higher lows the whole way. This is a trend with room, not an exhausted pop.

Two chokepoints squeezed at once

Supply is the entire story, and it's acute, not gradual. Hormuz, which on a normal day moves roughly a fifth of the world's seaborne barrels, is being interfered with head-on: two vessels hit near the strait Tuesday, and ships pushed into Iranian territorial waters, which throttles the flow. In parallel the Red Sea route is under pressure from Houthi threats and a declared embargo on Saudi shipping, with several tankers reversing course Tuesday. Both of the planet's critical oil passages are being squeezed together, and that pressure is what holds a bid under price this deep into the advance.

Demand plays no role in this week's move, and that fact defines the risk. A rally built on a supply scare unwinds quickest of all once the scare lifts, precisely because nothing about consumption ever shifted. Pull the war premium out and there is no structural support left underneath these prices.

A supply-fear rally is front-loaded and headline-reactive by nature. The same premium that built it can be unwound by a single sentence out of a mediation room.

The ceasefire is the switch

The escalation and de-escalation tracks are running at the same time, and the market trades the tug-of-war in real time. One side: roughly ten consecutive days of exchanged strikes, a collapsed fragile truce, and a presidential warning of more retaliation after American service members died. The other: mediators actively floating a ten-day halt that could revive a wider deal. That the proposal exists at all is what dragged crude down 1 percent midday Tuesday before it clawed back.

And 2026 has taught this lesson repeatedly. Truce and sanctions-relief news has repeatedly cut crude down hard: a near 20 percent slide off the spring peak, a quick dip beneath 80 in Brent through mid-June when a report said Washington would let Tehran sell oil. Hold the war premium long and you have to respect that the turn, when it lands, usually lands fast and through a gap.

There's a second cost to owning this trend through options. Implied volatility here is rich, so a long call costs plenty to carry and drains fast the moment price stops rising. A de-escalation headline pulls price and implied volatility down together, hitting the position twice. The premium you pay for the war is the premium you give back on the truce.

The trade: buy the breakout, keep it small

The setup rides the trend but respects the gap risk. Buy a break that clears and holds the 85.03 to 85.20 high shelf. Wait for it, though, past the 09:45 opening-range gate and past the 10:30 inventory number, not ahead of either.

CL primary setup, buy the breakout
Entry (long)
85.03-85.20
Stop
83.45
T1 / T2
86.94 / 88.01
T3
89.42-89.59
About 1.7 points of risk from a 85.15 entry, rewards near 1.05:1, 1.7:1 and 2.5:1. Scale out; don't hold the full position to T3 in a headline market. Lose the 83.59 pivot on a held basis, or get a confirmed truce headline, and the long is dead. The override is absolute: any concrete truce, agreement, or Iran-oil-relief headline is a stand-aside or exit regardless of the chart.

There's a lower-risk long than chasing the break. Should crude flush into 82.14 to 81.21, where the first pivot support meets the 50 percent retracement, then steady and reclaim with no truce headline crossing, that's a cleaner long than chasing, stop under 80.00, aiming back at 84.54 and 85.78. The flip side is the alarm: a confirmed truce that snaps and holds under 80.00 to 79.84 marks the premium coming out, a momentum short toward the 40-day near 78.26, which cuts against the trend and needs wide risk.

Build the morning around that 10:30 inventory report. With the market gripped by supply fear, a bigger draw than expected pours fuel on the trend, while a build can touch off a sharp, often shallow dip that buyers step into as long as the premium holds. Trim or step aside going into the number, then respond to it. And skip the day outright if price is only chopping between 83.5 and 85.0 without a real break, if a truce headline is hitting the wire and price is jumping on it, or during the fifteen minutes bracketing the number. In a market this headline-driven, no trade is frequently the right trade.

Wednesday's three paths
A · 50% grind up
B · 30% truce dip
C · 20% spike
A. Upward-biased grind that holds 83.59 and tests 85.78 to 86.94 on any escalation headline. The base case.
B. A ceasefire-progress headline forces a fast pullback to 82 to 81, which either holds and gets bought or fails toward the 79 to 80 premium unwind.
C. A sudden escalation, or a Hormuz-shutdown spike, punches price through 85 and up to 88 or 90 in short order.

One-ATR band around the 83.59 pivot is roughly 81.6 to 86.6. Size for a routine 3-point session and an event-day of 5 points or more; one headline can gap you clear of both.

The trend is up and the supply threat is real. The trade that beats it isn't a bigger position, it's a smaller one that survives the truce headline.

The complete data picture

Every level and reading from the Tuesday evening CL review, charted. All prices are NYMEX WTI, September front month. The full numeric reference sits below the charts.

Level map
NYMEX WTI, September front month · every reference from the review, to scale
ENLARGE
95.30 52-week high89.42 third pivot resistance88.01 two-SD86.94 one-SD85.03 ONE-MONTH HIGH / TRIGGER84.70 evening print83.59 DAILY PIVOT81.74 one-SD support80.09 61.8% from 52-week low79.84 three-SD78.26 third pivot support, 40-day74.34 18-day crossing89.59 40-day stall88.84 three-SD87.23 second pivot resistance85.78 first pivot resistance84.91 daily high84.54 session low, 38.2% of 13-week82.14 first pivot support81.21 50% retracement79.95 second pivot support79.25 9-day crossing77.93 five-day low67.12 one-month lowPRINT84.70PIVOT83.59
BELOW PIVOT 66-84ABOVE PIVOT: UPTREND 84-96BREAKOUT SHELF 85-85
Price is pressing the 84.91 to 85.03 breakout shelf after a 26 percent rally off the 67.12 low. The 83.59 pivot is the line between breakout-pending and pullback; losing it shifts the intraday character.
The rally in context
Return over each window, and distance to the ceiling
BELOW · GAP TO 95.30GAIN OVER WINDOW5 sessions+7.2%still trendingOne month+16.1%the war premiumSix months+44%off the 67.12 lowBelow 52-week high-11%room to 95.30
A trend, not a spike: higher lows the whole way up. The size of the monthly advance is the caution, a supply-fear move this steep can snap back fast if the catalyst fades, but at 11 percent below the 95.30 high there is structural room before the ceiling.
Moving-average stack
Above every average, a clean long alignment
SUPPORT BENEATH PRICERESISTANCE OVERHEAD74.3418-day cross78.2640-day cross79.259-day cross84.70SETTLE
Price trades above all major averages. The levels at which it would cross back below sit well beneath the market: about 79.25 (9-day), 78.26 (40-day) and 74.34 (18-day). The roughly 5.5 points to the nearest average measures how extended the move is.
Trend momentum
Strong, not yet at exhaustion
66%RELATIVE STRENGTHup 0.7256%COMPOSITE BUYtrend signal on buy82%WEIGHTED STRENGTH+40.93, one-year
Relative strength at 66.11 is firm without flashing an overbought extreme; the multi-indicator composite reads 56 percent buy with the trend signal on a buy; the weighted one-year strength metric is strongly positive at plus 40.93 (shown scaled). Genuine trend momentum, worth respecting for a mean-reversion snap only if the catalyst fades.
Expected range
Scenario bands against the one-ATR envelope
LOW BAND81 - 82truce dip: first support + 50% retrMID BAND · MOST LIKELY84 - 86supply-fear grind around the pivotHIGH BAND87 - 88escalation break of 85.038287options-implied one-day move84.70
The one-ATR band on the 83.59 pivot is roughly 81.6 to 86.6. Average true range runs 3.23 to 3.46 across the 9 to 20-day (about 3.8 to 4.1 percent). Plan for a 3-point routine day and a 5-plus-point event day, with a single headline able to gap outside either.
Primary setup
Buy the breakout, sized small
RISK 2 POINTS = 1RSTOP83ENTRY ZONE85-85T1871 : 1.052 ptsT2881 : 1.73 ptsT3901 : 2.54 pts
Entry on a break and hold above 85.03 to 85.20, after the 09:45 gate and the 10:30 inventory print. Stop below 83.45 under the pivot. Scale out; do not hold the full position to T3 in a headline market. Any concrete truce or Iran-oil-relief headline overrides the chart to the downside.
Wednesday’s calendar
All times Eastern · one scheduled print, one open-ended risk
09:30Cash open14:30Pit close10:30EIA petroleum inventories
The one first-order scheduled event is the 10:30 weekly petroleum inventory report (verify the time on the live calendar). Everything else is the continuous, any-hour flow of US-Iran war and ceasefire-mediation headlines, which remains the true market mover.
Full numeric reference , every figure from the review
Contract
NYMEX WTI front month. September (CLU26) took over as front month after August rolled off at Tuesday's expiration. Review prepared Tuesday evening July 21 for the Wednesday July 22 regular session.
Session prints
September prints 84.70 in the evening electronic session, up 0.36 (+0.43 percent) on a prior settle of 84.34, inside a 84.54 to 84.91 daily range on thin volume near 3,550 contracts. Daily candle: open 84.69, high 84.91, low 84.54, close 84.70. The expiring August contract settled Tuesday up 1.68 (+2.02 percent) at a five-week high. Intraday, WTI dipped about 1.1 percent toward the low 82s on ceasefire-proposal reports before reversing higher on supply-threat headlines.
Range context
Up 7.2 percent over five sessions, 16.1 percent on the month, about 44 percent over six months. About 11 percent below the 52-week high of 95.30. A 26 percent rally off the 67.12 one-month low, higher lows and higher highs. Five-day range 77.93 to 85.03, closing in the top quartile. No structural ceiling until 89 to 90 and ultimately 95.30. September open interest near 296,000.
Moving averages
Above all major averages, a bullish stacked alignment. Cross-back-below levels sit well beneath price: about 79.25 (9-day), 78.26 (40-day), 74.34 (18-day). About 5.5 points to the nearest average measures how extended the move is.
Oscillators and trend
Multi-indicator composite 56 percent buy with the trend signal on a buy and the overall direction strengthening; the 7-day directional trend indicator on a buy. Relative strength 66.11 (up 0.72). Weighted one-year strength plus 40.93. Genuine trend momentum, not yet an overbought exhaustion reading, though the pace of the monthly advance warrants respect for a mean-reversion snap if the catalyst fades.
Volatility
Average true range 3.23 (3.81 percent) on 9 days, 3.35 (3.95 percent) on 14 days, 3.46 (4.08 percent) on 20 days; average daily range roughly 3.0 to 3.2. A one-ATR band on the 83.59 pivot gives a most-likely envelope of roughly 81.6 to 86.6, with a single headline able to gap well outside. Plan for a 3-point normal day and a 5-plus-point event day.
Key levels
Resistance: 84.91 daily high into 85.03 one-month high (the trigger shelf); 85.78 (first pivot), 86.94 (one-SD), 87.23 (second pivot), 88.01 (two-SD), 88.84 (three-SD), 89.42 (third pivot), 89.59 (40-day stall), 95.30 (52-week high). Support: 84.54 low (38.2 percent of 13-week); 83.59 pivot; 82.14 (first pivot) with 81.74 (one-SD) and 81.21 (50 percent retracement); 80.09 (61.8 percent from 52-week low), 79.95 (second pivot), 79.84 (three-SD), 79.25 (9-day crossing); 78.50 to 78.26 (third pivot and 40-day); 74.34 (18-day).
Positioning and product complex
WTI carries no listed-options gamma surface, so the lens is the term structure, product complex and speculative positioning. A supply-premium market bids the front of the curve on physical-flow fear, typically steepening backwardation. Commitment-of-traders data as of July 14 is the latest official snapshot; the run-up since implies speculative length has likely increased, itself a risk if a ceasefire forces fast long liquidation. Gasoline moved with crude Tuesday (August RBOB up 0.50 percent), a broad energy-complex bid led by the crude supply premium. Rich implied volatility means a long call is expensive to hold and quick to bleed if price stalls; a de-escalation headline compresses price and implied volatility together.
Geopolitics and macro
Live US-Iran conflict, about ten straight days of exchanged strikes, the prior fragile truce collapsed, a presidential warning of further retaliation after US service members were killed. Supply channel: Hormuz (normally about 20 percent of the world's seaborne crude) disrupted after Iran struck two vessels near the strait and began forcing ships through its territorial waters; Red Sea squeezed by Houthi threats and a declared embargo against Saudi Arabia, several tankers turning back Tuesday. De-escalation: mediators actively pushing a roughly ten-day ceasefire that could revive a broader agreement, which knocked crude down about 1 percent intraday. Through 2026 truce and sanctions-relief news has cut crude hard, a near 20 percent drawdown from the spring peak, a brief drop under 80 on Brent in mid-June on a report the US would let Iran sell oil. Dollar and rates not freshly measured tonight and treated as a minor second-order factor while the war premium dominates.
Setup and paths
Long a break and hold above 85.03 to 85.20 after the 09:45 gate and the 10:30 print; stop below 83.45 under the 83.59 pivot; T1 86.94 (one-SD), T2 88.01 (two-SD), T3 89.42 to 89.59; about 1:1.05, 1:1.7 and 1:2.5 from a 85.15 entry. Alternate long: a flush into 82.14 to 81.21 that holds and reclaims with no ceasefire headline, stop below 80.00, back to 84.54 then 85.78. Bearish conditional: a confirmed truce that breaks and holds below 80.00 to 79.84, momentum short toward 78.26. Paths A grind 50 percent (hold 83.59, test 85.78 to 86.94), B ceasefire dip 30 percent (to 82 to 81, hold or fail toward 79 to 80), C escalation spike 20 percent (through 85 toward 88 to 90).
Calendar
One first-order scheduled event: the weekly EIA petroleum status report at 10:30 ET (crude, gasoline, distillate inventories, refinery utilization; verify the time on the live calendar). Everything else is the continuous, any-hour flow of US-Iran war and ceasefire-mediation headlines, the dominant intraday catalyst.

The trend is up and the supply threat is real. The trade that beats it is a smaller one.

See how AlgoIndex turns structure and catalyst risk into systematic signals. Read Monday's crude note, whose long into the shelf this session ran with.

View pricing


Performance methodology

Share:

Essential Guides

Related Articles

Crude Oil: Ignored the Bad Data

Crude Oil: Ignored the Bad Data

August 14, 2026 at 7:11 PM ET

Gold: Bought Its Own Washout

Gold: Bought Its Own Washout

August 14, 2026 at 7:11 PM ET

Nasdaq 100: The Market That Stopped Listening

Nasdaq 100: The Market That Stopped Listening

August 14, 2026 at 7:11 PM ET

S&P 500: The Consumer Cracked and the Market Barely Moved

S&P 500: The Consumer Cracked and the Market Barely Moved

August 14, 2026 at 7:11 PM ET

Want this kind of analysis every day?

AlgoIndex publishes institutional-grade reviews on ES, NQ, GC, and CL, built on professional-grade market data and our own analysis, priced for individual traders.

Start with 75% off month 1

