
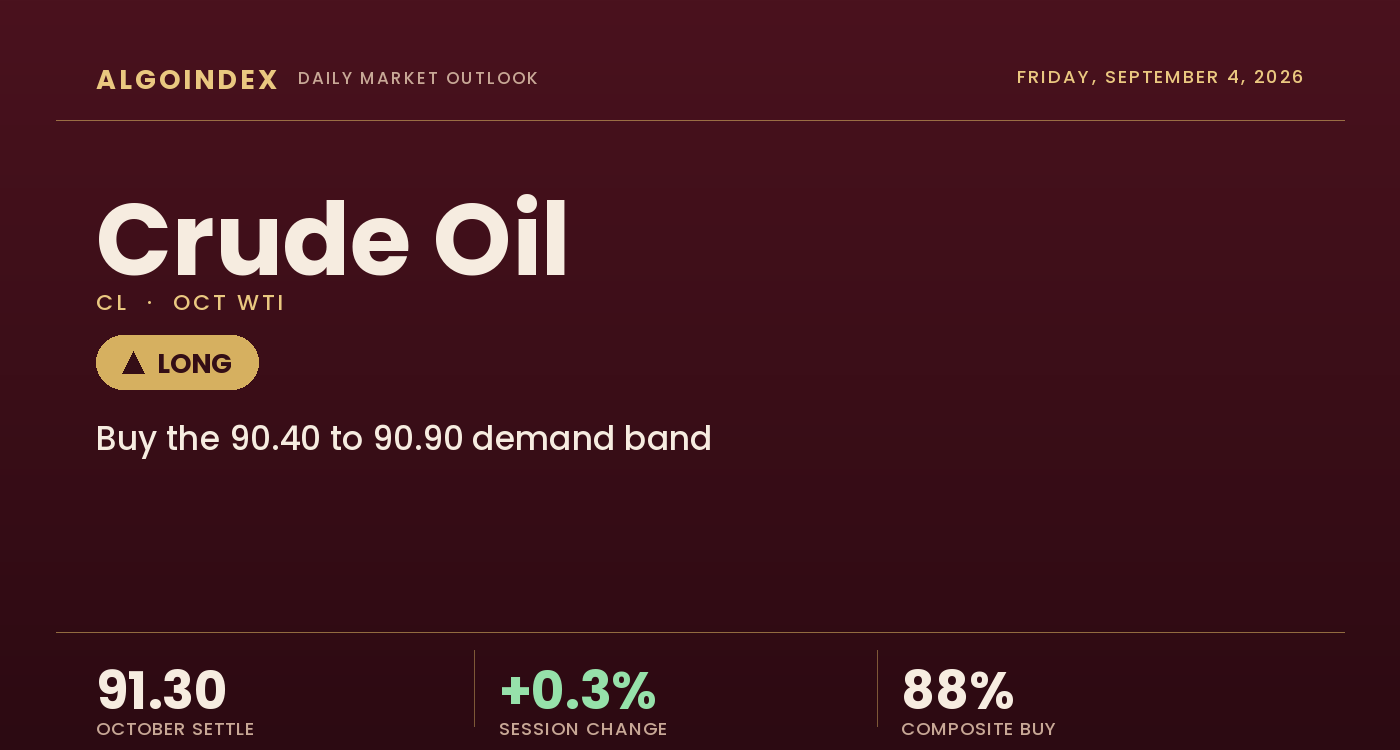
Crude oil settled Thursday at 91.30, up 29 cents or 0.32 percent from Wednesday's 91.01 settlement, and the headline change conceals almost everything that happened inside the session. The October contract opened at 90.70, ran to 93.14, the highest price this contract has traded in its own 52 week window, then reversed 3.57 dollars to 89.57 before recovering into settlement. The settle landed at 48 percent of the day's range, almost exactly mid-band, and the post-settlement electronic quote as of 4:56 PM ET finished higher still at 91.69. A reader who saw only the plus 29 cents would conclude the session was quiet. It was the opposite: the full range ran 106 percent of the 14 day average true range and 116 percent of the 14 day average daily range on 293,788 contracts of volume.
The dominant driver was the conflict between the United States and Iran and the state of maritime transit through the Strait of Hormuz. Crude carried a firm bid from the overnight session through late morning on continued strikes and retaliation, aided by a softer dollar after 8:30 AM ET remarks from a Federal Reserve governor pointing to early signs of disinflation. The reversal from 93.14 coincided with early-afternoon comments from the United States Vice President that tanker traffic through the Strait was close to normal and that a global energy crisis was being avoided. The clearest signal on the board is a structural contradiction: the front of the curve rallied while the deferred months fell. October gained 68 cents on the post-settlement print while November was unchanged at 88.26 and December fell 46 cents to 84.79, widening the October to December spread to 6.90 dollars from 5.76 at the prior settlements. Prompt physical tightness is intensifying at the same time as the market's longer-dated view of supply softens. The refined product complex says the same more loudly: the distillate crack computes to 101.63 dollars a barrel and retail diesel set a record national average of 5.820 dollars a gallon. This is a scarcity of barrels available now, not a repricing of the next year, and Friday is a macro session rather than a supply one, with the 8:30 AM ET employment report the single first-order event.
A rejection at the 52-week high above every moving average
The constructive read starts with location. The 91.30 settlement sits above every major moving average, the five-day at 88.42, the twenty-day at 84.28, the fifty-day at 79.38, the one-hundred-day at 80.65 and the two-hundred-day at 72.55, with the year-to-date average at 75.26. The distance above the twenty-day is 7.02 dollars, or 8.33 percent, and the settlement stands 18.75 dollars above the two-hundred-day. The multi-indicator composite reads 88 percent buy overall, with the short-term and medium-term components both at 100 percent buy and the long-term at 33 percent. The nine-day directional index reads 27.49 with the positive directional indicator at 35.73 against 12.58 negative, a clear trending configuration, and the forward curve reinforces the physical read, October holding a 3.43 premium to November and 6.90 above December on the post-settlement prints, steep backwardation that is the market paying up for prompt barrels.
What argues the other way is the extension and the rejection. The settlement sits 7.02 dollars above the twenty-day at a moment when the 14 day average true range is 3.36, so roughly two sessions of normal range separate spot from its own mean, and mean reversion does not require a bearish catalyst from here. Inside the stack the fifty-day at 79.38 remains beneath the one-hundred-day at 80.65, a residual of the earlier decline that has not yet been worked off and the single element that has not turned. The nine-day relative strength at 75.39 is the only reading above 70, while the 14 day at 68.93 and the twenty-day at 64.56 sit below it, the signature of a fast recent advance inside a trend that is not yet historically stretched. Stochastics are more stretched, the 14 day percent K at 90.96, the nine-day at 90.90 and the twenty-day at 93.65, readings above 90 that have more often preceded consolidation than immediate continuation. The reversal from 93.14 was worth 3.57 dollars, a proven supply point rather than a theoretical one.
The 90.40 to 90.90 buy band and the 92.00 ceiling frame Friday
Two structures frame the session. Beneath price, the 90.40 to 90.90 buy band sits in the middle of the pivot range, its justification the 30 minute volume concentration in the 89.50 to 90.00 region together with the reversal base rather than the 91.34 pivot overhead; the 89.53 to 89.57 pair, the first pivot support paired with the session low four cents apart, is the structural warning, and the 89.10 stop sits beneath it. Overhead, 92.00 is the immediate round-number ceiling, 92.51 the level at which the 14 day relative strength index crosses 70, and the 93.10 to 93.14 pair the densest overhead confluence, the first pivot resistance beside the 52-week session high. A sustained move above 92.51 opens that pair and then the 93.55 to 93.58 band. The decisive feature of Friday is that it is a macro session: the 8:30 AM ET United States employment report is the single first-order event, with payrolls forecast at 55,000 against a prior reading of negative 23,000, and crude's exposure runs through the dollar rather than through any energy-specific print. The reaction function is unusual, because money markets are pricing the possibility of a rate increase, a strong payroll print lifts the dollar and works against crude while a weak print softens it and supports the contract. There is no weekly inventory report scheduled. Crude has no liquid options proxy, so positioning is read from the forward curve, the refined product cracks and the futures technical structure.
Buy the pullback band, respect 89.10, size for payrolls
The plan buys the 90.40 to 90.90 band, favouring a controlled pullback over a chase into the supply shelf that rejected price by 3.57 dollars, working with the trend rather than into the heavy overhead that begins just above 92. The band no longer spans the daily pivot: the recomputed pivot is 91.34, above both the band and the 91.30 settlement, and the entry rests on the 30 minute volume concentration in the 89.50 to 90.00 region and the reversal base. The stop is 89.10, beneath both the 89.57 session low and the 89.53 first pivot support, which sit four cents apart, giving the buffer a market with a 3.36 dollar average true range requires. Targets step to 92.30, immediately beneath the 92.51 momentum threshold and above the 92.00 ceiling, then 93.10, the first pivot resistance four cents beneath the session high, then 94.05 on momentum through target two on expanding volume, for reward-to-risk of roughly 1 to 1.1, 1 to 1.6 and 1 to 2.2 measured from the 90.65 entry midpoint against 1.55 dollars of risk. The defining risk is two-sided and macro. A strong 8:30 AM ET payroll print that drives the dollar sharply higher on renewed tightening expectations invalidates the setup in real time regardless of level, as does any credible development on the transit question, since a formal reopening arrangement or a producer-group supply announcement removes the prompt scarcity the thesis rests on. In the opposite direction, an escalation headline that gaps crude above 93.14 removes the pullback entry entirely and the setup should be abandoned rather than chased; the alternate expression in that case is a short from 93.10 to 93.55 on a failure at the high, stop 94.40. A daily close beneath the 88.42 five-day moving average would break the sequence of higher lows that has carried crude from the August 5 low at 73.10 and change the framing from pullback to reversal. Any position carried into Friday's 5:00 PM ET session end is exposed to a two-day window with no ability to adjust before the 6:00 PM ET Sunday reopen. Our published performance methodology sets out how these calls are graded.
The physical market is tight in exactly the places that matter, the forward curve in steep backwardation and a distillate crack above 101 dollars a barrel, yet the first return to the 52-week high failed at 93.14 with a 3.57 dollar reversal. That argues for buying a controlled pullback into the 90.40 to 90.90 band rather than chasing the print, sized for a two-sided geopolitical catalyst and the 8:30 AM ET employment report, and a verified reopening of the Strait is the one development that flips the read.
A supply-tight market that holds above every moving average but rejects its own 52-week high at 93.14 on the first attempt is a market to buy on a pullback rather than a print to chase. The plan favours the 90.40 to 90.90 band, respects 89.10 and keeps size measured, because the constraint can escalate or resolve on a single headline in either direction, with Friday's 8:30 AM ET employment report close behind.
This is the read our members get every session, before the bell, with the levels drawn and the setup defined. See how the same dealer-positioning work turns into systematic signals.
View pricingThe complete data picture
Every number behind Friday’s plan, charted first; the full numeric reference follows underneath.
Full numeric reference, every remaining figure from the review
| Average | Value | Settle vs |
|---|---|---|
| 5-day | 88.42 | above by 2.88 |
| 20-day | 84.28 | above by 7.02 |
| 50-day | 79.38 | above by 11.92 |
| 100-day | 80.65 | above by 10.65 |
| 200-day | 72.55 | above by 18.75 |
| Year-to-date | 75.26 | above by 16.04 |
| Level | Reference |
|---|---|
| 96.67 to 97.70 | the third pivot resistance and the 1.272 fibonacci extension, the objective for a sustained break of the 92 to 96 supply band |
| 94.65 to 94.91 | the second pivot resistance paired with the one standard deviation band, the first genuine extension beyond the rejection |
| 94.05 | the extended target three, only on momentum through target two on expanding volume |
| 93.55 to 93.58 | the computed target price and the three by ten day crossover stall, a second obstacle immediately above the session high |
| 93.10 to 93.14 | the densest overhead confluence, the first pivot resistance paired with the 52-week session high, target two, the proven supply point that rejected price by 3.57 dollars |
| 92.51 | where the 14-day relative strength index crosses 70, the medium-window momentum flip |
| 92.00 to 92.30 | the immediate round-number ceiling and target one, beneath the momentum threshold |
| 91.34 | the standard pivot point, the settle four cents beneath it, an overhead reference to reclaim |
| 90.40 to 90.90 | the primary buy band and the entry, justified by the 30-minute volume concentration and the reversal base |
| 89.53 to 89.76 | the first pivot support and the 89.76 raw-stochastic marker, the momentum shelf beneath the market |
| 89.57 | the session low and reversal base, overlapping the 89.50 to 90.00 volume node that holds 29 percent of the mapped volume |
| 89.10 | the protective stop beneath the session low and the first pivot support, with the one dollar average-true-range buffer |
| 88.42 | the five-day moving average, the line the advance has respected since the August 5 low |
| 87.37 to 87.77 | the second pivot support paired with the one standard deviation band, the strongest support area beneath 89 |
| Metric | Reading |
|---|---|
| Options surface | no liquid crude options proxy, so positioning is read from the physical and futures complex, and no level in this review is derived from an options surface |
| Forward curve | October at 91.69 sits 3.43 above November at 88.26 and 6.90 above December at 84.79 on the post-settlement electronic prints, steep backwardation across the front of the curve and the market paying up for prompt barrels |
| Curve comparison | the October to November spread was 2.73 at the prior settlements and the October to December spread 5.76, both wider tonight, pointing to intensifying prompt scarcity subject to a matched-time limitation |
| Refining margins | the distillate crack stands at 101.63 dollars a barrel and the gasoline crack at 40.37, a distillate scarcity signal that keeps refiners bidding aggressively for crude feedstock |
| Product prices | the October diesel settlement at 4.5936 a gallon and gasoline at 3.1349, with a record retail national average diesel price of 5.820 a gallon |
| Historic volatility | 37.13 percent over nine days, 32.17 percent over fourteen and 44.00 percent over fifty, elevated and consistent with a supply-driven advance |
| Brent to WTI | the differential narrowed to 4.22 dollars from 4.62 at the prior settlements, counterintuitive for a chokepoint story and reinforcing that the bid was specific to the United States barrel |
| Producer positioning | the producer category added 10,849 shorts to August 25, physical producers selling forward into the strength, with open interest at 248,095 against session volume of 293,788 |
| Cohort | Weekly change |
|---|---|
| Technical positioning | the multi-indicator composite reads 88 percent buy overall, short-term indicators 100 percent buy, medium-term 100 percent buy and long-term 33 percent buy, the lone sell the fifty against one-hundred day crossover, with price above all six surveyed moving averages |
| Directional spread | the nine-day directional index at 27.49 above the 25 strong-trend threshold, the positive directional indicator 35.73 against 12.58 negative, a 23.15 spread, while the 14-day at 19.74 and the 20-day at 16.09 mark the trend as young |
| Managed money | a net long of 84,020 as of August 25, 196,882 long against 112,862 short, with money-manager shorts growing 4,803 on the week against a long increase of only 1,344 |
| Producer hedging | producers, merchants, processors and users added 10,849 shorts to August 25, physical sellers locking in forward prices into the strength, consistent with the steep backwardation |
| Positioning staleness | the weekly report is current only to August 25, nine days stale, predating this week and most of the move from the low 80s, so it reads as a starting condition; the next update lands Friday at 3:30 PM ET covering positions to September 1 |
| Coverage note | crude carries no liquid options-positioning proxy, so positioning is built from the forward curve in steep backwardation, the Brent to WTI differential, the refined product cracks and the futures technical structure |
| Input | |
|---|---|
| Dollar index | 98.99, down roughly 0.6 percent to a one and a half week low after a Federal Reserve governor pointed to early disinflation, a mechanical support for dollar-denominated crude |
| 10-year yield | 4.770 percent, easing 0.024, with the supply premium dominating the normal cross-asset correlation |
| Gold | up 2.84 percent against crude 0.32 percent, a monetary move on a softer dollar and lower yields rather than an acute flight to safety, cautioning against reading crude as a pure geopolitical trade |
| Equity index | the broad index up 1.06 percent with equity volatility down 5.79 percent at 14.31 and bitcoin up 5.21 percent, a broadly risk-positive session |
| Natural gas | settled 2.9130, down 1.45 percent, falling back from a high set roughly seven weeks ago |
| Global benchmark grade | the waterborne benchmark settled 95.52, down 11 cents or 0.12 percent, narrowing the Brent to WTI spread to 4.22 from 4.62, counterintuitive for a chokepoint story |
| Product complex | the distillate crack computes to 101.63 dollars a barrel and the gasoline crack to 40.37, with record retail diesel at 5.820 a gallon, distillate scarcity keeping refiners bidding for feedstock |
| When | Event |
|---|---|
| Wed Sep 2 | the weekly petroleum status report landed, a Wednesday release this review did not capture, with the October contract settling 91.01 |
| Thu Sep 3 | the October contract ran to a 93.14 fifty-two-week high on continued strikes and a softer dollar, then reversed 3.57 dollars to 89.57 on afternoon comments that Strait transit was near normal, and recovered to settle 91.30 |
| Fri Sep 4 | the United States employment report at 8:30 AM ET is the single first-order event, nonfarm payrolls forecast at 55,000 against a prior negative 23,000, with the rig count at 1:00 PM ET and the weekly positioning report at 3:30 PM ET, and no inventory report scheduled |
| Weekend Sep 6 | the electronic session ends at 5:00 PM ET Friday and does not reopen until 6:00 PM ET Sunday, leaving two days of unhedgeable headline exposure with an active conflict and an unresolved transit question |
| Sep 9 to Sep 11 | the monthly short-term energy outlook Wednesday September 9, Chinese consumer and producer prices the same session, and the holiday-shifted weekly petroleum status report Thursday September 10 |
The economic releases referenced above are published on the official government calendars below. Price levels are derived from standard technical and statistical methods, and the market read is AlgoIndex's own analysis. How we grade these calls is set out in our performance methodology.
- US Bureau of Economic Analysis, Personal Income and Outlays (PCE)
- US Bureau of Economic Analysis, Gross Domestic Product
- US Bureau of Economic Analysis, release schedule
- US Census Bureau, Advance Durable Goods (M3) release schedule
- US Energy Information Administration, Weekly Petroleum Status Report
- US Department of the Treasury, auction schedule and results
- AlgoIndex performance methodology



