
ES 7,362 0.42%NQ 29,850 0.83%GC 4,358 0.56%CL 88.43 2.20%VIX 18 1.10%● TONIGHT'S MARKET REVIEW PUBLISHES 8:30 PM ETES 7,362 0.42%NQ 29,850 0.83%GC 4,358 0.56%CL 88.43 2.20%VIX 18 1.10%● TONIGHT'S MARKET REVIEW PUBLISHES 8:30 PM ET
AlgoIndexPromo

Nasdaq-100: Chips Bounced It Back Up, Still Compressed Under the 20-Day

Market OutlookPublished For the session11 min readby AlgoIndex Research Team
Nasdaq-100: Chips Bounced It Back Up, Still Compressed Under the 20-Day

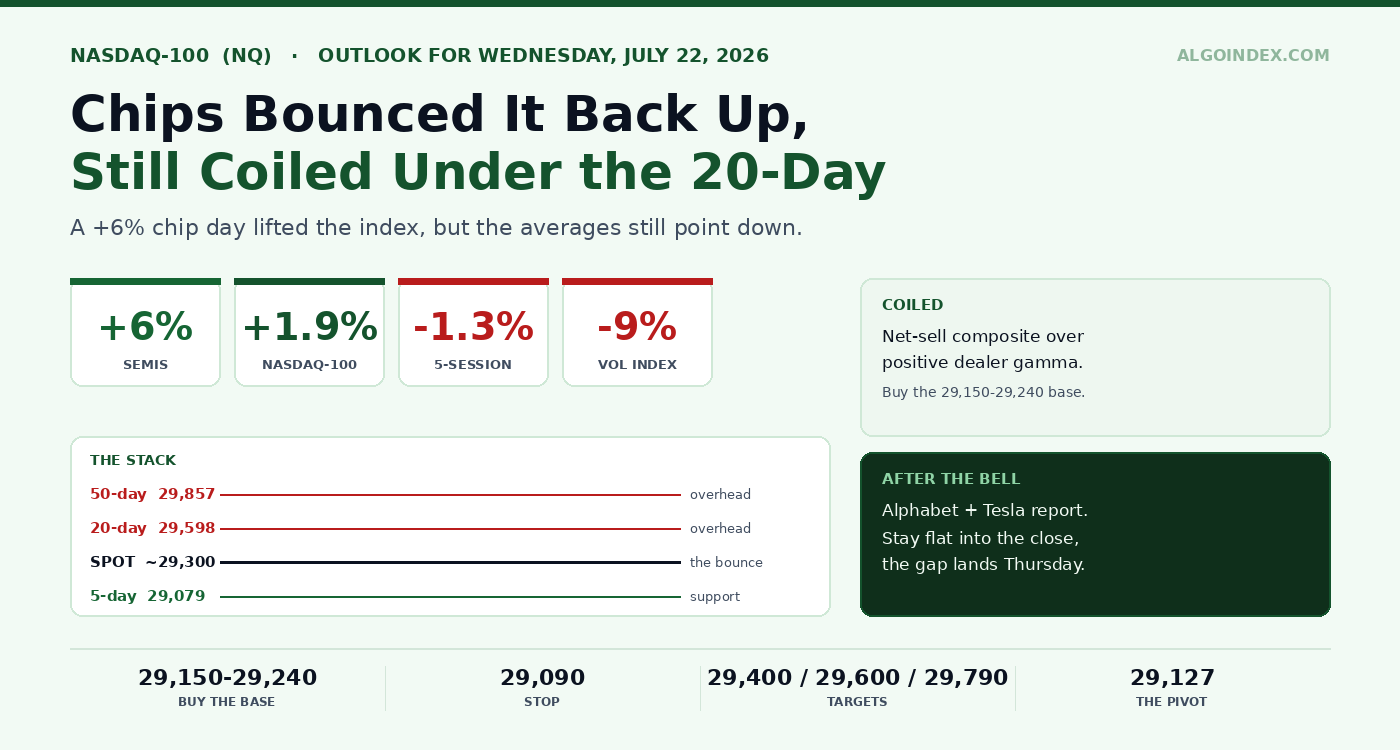
NQ settled near 29,316 as semiconductors jumped 6 percent, but price sits under the 20-day at 29,598 with a net-sell composite over positive dealer gamma. Buy the 29,150-29,240 base, stay flat into the Alphabet and Tesla reports.

The 60-second read

The Nasdaq-100 gained about 1.9 percent Tuesday, the E-mini settling near 29,316, and almost all of it came from one place: the chip group jumped roughly 6 percent as beaten-down names got bought back hard. The volatility index fell 9 percent to near 17 as hedges came off. But the structure still leans defensive: price sits under the 20-day near 29,598 and the 50-day near 29,857, and the composite reads net sell. What holds it up is positioning, dealer gamma is positive and demand for protection is thin. So the contract is compressed, propped by the dealers while the averages point down. We buy weakness toward the 29,150 to 29,240 base for a rotation to the 29,553 to 29,600 shelf, and we do not carry size into the Alphabet and Tesla reports after Wednesday's close.

Monday's note on this contract called the flat close manufactured and leaned on fading the 28,894 pivot. Tuesday the chips actually followed through, the market pushed to 29,316, and that fade would have been run over. Second day running, a short lean into this move got reclaimed. Worth saying.

The bounce is real. Whether it's a turn or a rest inside a pullback is the question the averages keep asking.

One group did the lifting
+6%
Semiconductor group
+1.9%
Nasdaq-100 cash
+0.9%
S&P 500 cash
-9%
Volatility index, to 17

The Nasdaq beating the S&P by a full point is the whole story: this was a chip trade, not a broad one.

Above the fast line, under the slow ones

The moving-average stack is the cleanest picture of the tension. With spot near 29,300, price rides above the 5-day at 29,079, which is nothing more than the fingerprint of Tuesday's bounce. Below it wait the 20-day at 29,598 and the 50-day at 29,857, both now hanging overhead as the first two resistance shelves. And it's a long way above the 100-day at 27,885 and the 200-day at 26,921. So the primary trend is fine and the near-term one is corrective, and the 20-day is the single line that separates a bounce that extends from a drift that resumes.

Momentum sits right where a consolidation lives, not where a bottom does. Relative strength reads 46, 47 and 49 across the 9, 14 and 20-day, a tight bunch just shy of the midline. The 14-day stochastic is low but not washed out, fast line near 35 and slow near 26. Trend strength kills the case for a big move in either direction: the 14-day directional index barely reaches 20, and negative direction still tops positive. That's a weak corrective drift, not a committed trend.

A net-sell composite over positive dealer gamma is the definition of compressed. The averages want lower; the positioning won't let it move much until a catalyst arrives.

The dealers are the reason it holds

Positioning is the counterweight to that defensive stack, and it's leaning the other way. Real-time hedging flow ran net positive on the broad index, several billion dollars of positive delta, a big share of it same-day put selling that pins intraday movement down. Single-name call buying further out added to the pile, the by-now-familiar posture of selling index vol while owning single-stock vol. The volatility index falling 9 percent into a dense earnings slate says the same thing: nobody's paying up for protection.

The Nasdaq tracking fund gives the corridor. Dealer call resistance sits near the 730 strike, put support near 700, the volatility inflection sits around 703 to 707 and the gamma flip near 710, with the fund closing near 696. Map that onto the cash index and you get a supportive base near 28,000, an inflection band near 29,000, and the dealer call wall the rally keeps leaning against. Inside that corridor dealers dampen the downside, which favours mean-reversion until something forces a break.

Wednesday is a waiting room

The regular session has no first-order Fed event, which matters by its absence: nothing dilutes the earnings story. And the earnings story is the whole story. Alphabet and Tesla both report after Wednesday's close, with Texas Instruments, IBM and ServiceNow alongside, and Intel on Thursday. This index is stuffed with exactly those names, so the regular session is really a place to get positioned, and the after-hours move in Alphabet and Tesla writes Thursday's open.

That's why the implied read is so tight. Next-day at-the-money implied volatility sits near 11 percent, an index move of roughly 0.6 to 0.7 percent, against a two-week average true range of about 644 points. In other words the market has penciled in a calm cash session and parked its volatility budget for after the bell. A volatility-product expiration Wednesday morning adds noise near the open without setting direction.

The overnight swing factor is the Middle East. The news feed ran hot with Iran items: mediators meeting, retaliation statements, a proposed short cessation, a shipping restriction near Saudi Arabia. None of it is on a calendar. Any of it can drop risk-off onto an index that's otherwise locked on earnings, and energy is the transmission wire.

The trade: buy the base, stay flat into the reports

The setup follows the split read: buy weakness, don't chase, and respect the base. Go long in the 29,150 to 29,240 zone on a pullback that stays above the 29,127 pivot. The version to want is a retest that absorbs, not one that breaks on momentum.

NQ primary setup, buy the base
Entry (long)
29,150-29,240
Stop (close)
29,090
T1 / T2
29,400 / 29,600
T3
29,756-29,790
Rewards run about 1:1.5, 1:3.5 and 1:5 from the middle of the entry. A close below 29,090 breaks the pivot and the base together and voids the thesis. The override is the calendar. Cut size or go flat into the Wednesday close whatever the open position, since Alphabet and Tesla print within minutes of the bell. Any material Middle East risk-off headline takes precedence over the chart.

The counter-trade is lower conviction and smaller. If price runs straight into 29,553 to 29,600 without laying a base and stalls while the composite still reads sell, fading back toward 29,300 is fair, stop above 29,650, with the caveat that it leans against the chip bid. And skip the day entirely if price opens mid-range with no test of either shelf, if the session just compresses into the earnings window, or if a headline has already gapped away the edge. Ahead of a real volatility event that lands after the close, preserving capital is the position.

Wednesday's three paths
A · 50% rotate
B · 30% continue
C · 20% break
A. Range-bound rotation between 29,150 and 29,580, muted volatility, a drift into the earnings window. The base case.
B. The chip bid extends, price reclaims and holds above the 29,553 to 29,600 shelf, and the contract works toward 29,756 to 29,791.
C. The overhead rejects, and either a headline or pre-report de-risking snaps the 29,127 pivot, opening a flush to 28,890 and the 28,537 to 28,463 zone.

Expected bands: low 29,050 to 29,130, mid 29,280 to 29,360 (settle, balance), high 29,550 to 29,620. Regular hours should hold inside; the after-close reports can gap Thursday well beyond it.

The chips carried the index back up. Two names reporting after the bell decide whether it gets to keep the gains.

The complete data picture

Every level and reading from the Tuesday evening NQ review, charted. All prices are the September E-mini contract unless a proxy is named. The full numeric reference sits below the charts.

Level map
September E-mini · every reference from the review, to scale
ENLARGE
31,100.00 52-week high30,217.00 third computed resistance29,857.00 50-day average29,791.00 second computed resistance29,628.00 price-action extension29,553.00 first computed resistance29,284.00 retracement29,236.00 computed target29,079.00 5-day average28,537.00 price-action extension28,408.00 one-month low30,701.00 one-month high29,934.00 40-day reference29,825.00 short-term retracement29,756.00 price-action extension29,598.00 20-DAY AVERAGE29,316.00 SETTLE29,253.00 session low29,127.00 DAILY PIVOT28,890.00 first computed support28,463.00 second computed support28,226.00 third computed supportSETTLE29,316.00PIVOT29,127.00
BELOW PIVOT 28,100-29,127ABOVE PIVOT 29,127-31,200RESISTANCE SHELF: FIRST-R + 20-DAY + EXTENSION 29,553-29,628
Price holds above the 5-day and the 29,236 to 29,253 base but sits under the 20-day at 29,598, now the lower edge of the 29,553 to 29,628 resistance shelf. The 29,127 pivot is the line that keeps the constructive case alive.
Moving-average stack
Above the fast line, under the slow ones
SUPPORT BENEATH PRICERESISTANCE OVERHEAD26,921.00200-day27,319.00YTD27,885.00100-day29,079.005-day29,598.0020-day29,857.0050-day29,934.0040-day29,300.00SETTLE
Above the 5-day (the bounce), below the 20-day and 50-day (now overhead resistance), and far above the 100-day at 27,885 and 200-day at 26,921. The 20-day at 29,598 separates a bounce that extends from a drift that resumes.
Relative strength by lookback
Neutral-to-soft, not oversold
509-day46under the midline14-day4720-day49
All three readings bunch just under the 50 midline. The 14-day stochastic is low without being washed out, fast line near 35 and slow near 26. The 14-day directional index barely reaches 20 with negative direction still over positive, a weak corrective drift rather than a committed trend.
Dealer gamma corridor
Nasdaq tracking-fund proxy · read as context, not futures levels
SUPPORT + INFLECTION700 - 707700 put strike, 703-707 inflectionDEALER CALL WALL710 - 730710 gamma flip to 730 resistance700730proxy strike range 700 to 730696.00
The fund closed near 696. Dealer put support sits near the 700 strike, the volatility inflection near 703 to 707, the gamma flip near 710, and call resistance near 730. Mapped to the cash index that is a supportive base near 28,000 and an inflection band near 29,000. Inside the corridor dealers dampen the downside, favouring mean-reversion until a catalyst breaks it.
Expected range
Scenario bands against the implied move
LOW BAND29,050 - 29,130pivot base, first-support belowMID BAND · MOST LIKELY29,280 - 29,360settle, balanceHIGH BAND29,550 - 29,620first-resistance + 20-day shelf29,14029,490options-implied one-day move29,316.00
At-the-money implied volatility near 11 percent prices an index move of roughly 0.6 to 0.7 percent against a two-week average true range near 644 points (2.2 percent). Regular hours should hold inside the band; the after-close reports can gap Thursday well beyond it.
Primary setup
Long the base, size-restrained into earnings
RISK 105 POINTS = 1RSTOP29,090ENTRY ZONE29,150-29,240T129,4001 : 1.5205 ptsT229,6001 : 3.5405 ptsT329,7901 : 5595 pts
Entry into 29,150 to 29,240 on a pullback that holds the 29,127 pivot. A close below 29,090 breaks the pivot and the base together and voids the thesis. Reward blocks are drawn proportionally. Override: reduce or flatten into the Wednesday close before Alphabet and Tesla report.
Wednesday’s calendar
All times Eastern · the real event is after the bell
02:00UK inflation11:00Volatility-product expiration16:10IBM, ServiceNow09:30Cash open16:00Alphabet, Tesla, Texas Instruments16:00Cash close
No first-order Fed event in regular hours. The decisive events are the after-close reports from Alphabet and Tesla, whose reaction shapes Thursday far more than anything in Wednesday intraday. Intel follows Thursday.
Full numeric reference , every figure from the review
Contract
CME Nasdaq-100 E-mini front month, September 2026 (NQ1! / NQU26). Review prepared Tuesday evening July 21 for the Wednesday July 22 regular session.
Session prints
Cash Nasdaq-100 about +1.9 percent; E-mini settled near 29,316. S&P 500 about +0.9 percent. Semiconductor group about +6 percent with individual double-digit gains. Volatility index near 17, down about 9 percent. Reopened futures near 29,280 to 29,300, opening the new trade date near 29,310, in a window that ranged roughly 29,253 to 29,311. Five-session change about minus 1.3 percent. Overnight base case a drift inside roughly 29,200 to 29,400, with the 29,236 to 29,253 support shelf and the 29,250 to 29,280 four-hour rebound shelf as the near-term rails.
Range context
One-month high 30,701; 52-week high 31,100, leaving price about 5.8 percent below the peak. One-month low 28,408; 13-week low near 26,927. Above the 100-day near 27,885 and 200-day near 26,921, range-bound beneath the 20-day and 50-day. Price-action study objectives: upside 29,756 and 30,847, downside near 28,537; higher-timeframe swing envelope.
Moving averages
5-day 29,079; 20-day 29,598; 40-day reference 29,934; 50-day 29,857; 100-day 27,885; 200-day 26,921; year-to-date near 27,319. Above the 5-day (the bounce), below the 20-day and 50-day (overhead), well above the 100-day and 200-day. The 20-day at 29,598 is the line between a bounce that extends and a drift that resumes.
Oscillators and trend
Relative strength 46 (9-day), 47 (14-day), 49 (20-day). 14-day stochastic fast near 35, slow near 26. 14-day directional index about 20 with negative direction over positive. Multi-indicator composite about 32 percent sell overall with the short-term component around 80 percent sell. Historic volatility near 20 percent on a two-week basis.
Volatility
Two-week average true range near 644 points (about 2.2 percent); average daily range near 618; nine-day average true range near 609. At-the-money implied volatility for the next day near 11 percent, implying a move of roughly 0.6 to 0.7 percent. Practical one-session RTH band roughly 180 to 300 points around the open, with the tail risk in the after-hours window once Alphabet and Tesla report.
Key levels
Resistance: 29,553 (first computed) / 29,598 (20-day) / 29,628 (extension) shelf; then 29,756-29,791 (extension + second computed), 29,825 (retracement), 29,857 (50-day), 29,934 (40-day), 30,217 (third computed), 30,701 (one-month high), 31,100 (52-week high). Support: 29,236-29,253 (computed target + session low) with 29,284 retracement; 29,127 daily pivot; then 28,890 (first computed), 28,537 (extension), 28,463 (second computed), 28,408 (one-month low), 28,226 (third computed).
Positioning and flow (proxy)
Real-time hedging flow net positive, several billion dollars of positive delta, a large share same-day put selling that suppressed intraday movement; longer-dated single-stock call buying added positive delta. Short index volatility against long single-stock volatility. Nasdaq tracking-fund proxy: call resistance near 730, put support near 700, volatility inflection 703 to 707, gamma flip near 710, fund closed near 696. Cash-index base near 28,000, inflection band near 29,000. Broad-index desk read (July 21, 5:20 PM edition): positive index gamma, risk pivot held at 7,480 on the S&P equivalent, next-day implied move near 0.6 to 0.7 percent.
Macro and calendar
No first-order Fed event Wednesday. UK consumer inflation overnight. Volatility-product expiration Wednesday morning. After the close (about 16:00 to 16:30 ET): Alphabet, Tesla, Texas Instruments, IBM, ServiceNow; Intel Thursday. Middle East headline risk running high (Iran items: mediators, retaliation statements, a proposed short cessation, a shipping restriction near Saudi Arabia). Japanese trade balance overnight missed on a wider deficit with exports and imports beating.
Setup and paths
Long 29,150 to 29,240 holding the 29,127 pivot; stop close below 29,090; T1 29,400, T2 29,553 to 29,600, T3 29,756 to 29,790; about 1:1.5, 1:3.5 and 1:5 from the entry midpoint. Alternate: fade a baseless push into 29,553 to 29,600 back toward 29,300, stop above 29,650. Paths A rotate 50 percent (29,150 to 29,580), B continue 30 percent (reclaim 29,553 to 29,600, work 29,756 to 29,791), C break 20 percent (through 29,127 to 28,890 and 28,537 to 28,463). Expected bands low 29,050 to 29,130, mid 29,280 to 29,360, high 29,550 to 29,620.

The chips carried it back up. Two reports after the bell decide whether it holds.

See how AlgoIndex turns dealer positioning and structure into systematic signals. Read the companion S&P note, and Monday's NQ note this session reclaimed.

View pricing


Performance methodology

Share:

Essential Guides

Related Articles

Crude Oil: Ignored the Bad Data

Crude Oil: Ignored the Bad Data

August 14, 2026 at 7:11 PM ET

Gold: Bought Its Own Washout

Gold: Bought Its Own Washout

August 14, 2026 at 7:11 PM ET

Nasdaq 100: The Market That Stopped Listening

Nasdaq 100: The Market That Stopped Listening

August 14, 2026 at 7:11 PM ET

S&P 500: The Consumer Cracked and the Market Barely Moved

S&P 500: The Consumer Cracked and the Market Barely Moved

August 14, 2026 at 7:11 PM ET

Want this kind of analysis every day?

AlgoIndex publishes institutional-grade reviews on ES, NQ, GC, and CL, built on professional-grade market data and our own analysis, priced for individual traders.

Start with 75% off month 1

