
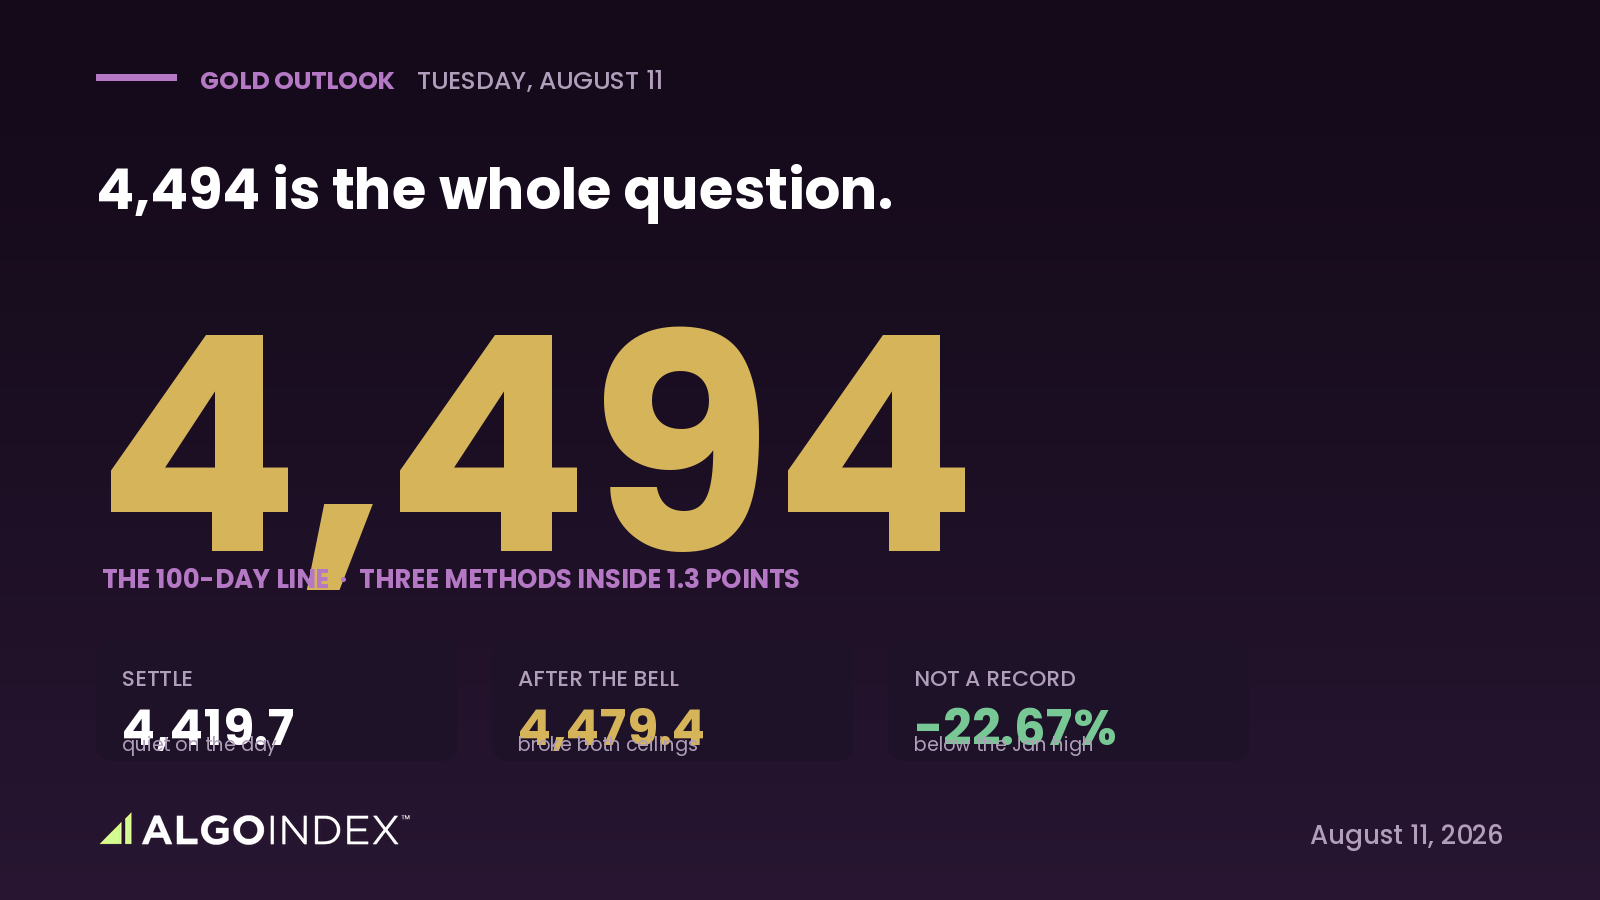
At 2:31 on Monday afternoon, gold settled at 4,419.7, up a modest 0.45 percent, and anyone reading only that number would have concluded the metal had a quiet day. The order flow in the hours after the settle said something else entirely. Price gapped to 4,446.9, ran to 4,479.4, and never looked back, clearing both of the rejection highs that had capped it on Friday and again earlier Monday.
That post-settle breakout, not the settle, is what sets Tuesday's opening conditions, and it arrived in strange company. The dollar rose, Treasury yields rose, and a Cleveland Fed official talked openly about rate hikes. Every one of those is normally a headwind for a metal that pays no yield. Gold rallied more than a percent through all of it. A bid that survives a stronger dollar and higher yields is not a rate-expectations bid. It's a geopolitical and inflation-protection bid, driven by a five percent move in crude and an unresolved standoff over the Strait of Hormuz, and that makes it both more durable and more headline-fragile than a positioning squeeze.
A recovery, not a record
One thing has to be said plainly, because getting it wrong is the most expensive error available here: gold is not at record highs. It trades roughly 23 percent below its January high of 5,781.8 and is fractionally negative on the year. This is a powerful recovery off a well-defined base near 4,015, built through late July and launched by a 3.67 percent breakout on August 5. From the August 4 close, the metal has run nearly eight percent in four and a half sessions. That is a statement about momentum and about vulnerability in equal measure.
The company the move keeps supports the read. Silver led on a percentage basis, and the dealer proxy shows negative call gamma, which means dealers must buy into strength to stay hedged. That mechanic is a credible reason the post-settle push extended so cleanly through two prior ceilings rather than stalling at them. It also works in reverse, so it argues for faster moves in both directions rather than for the upside specifically.
4,494 is the whole question
Directly overhead sits the level that decides everything. The 100-day moving average, the first standard-deviation projection, and the second pivot resistance all land between 4,494.4 and 4,495.7, three independent methods inside 1.3 points. That is the cleanest decision level this market offers. Above it, the extension is validated and the 200-day at 4,618 comes into view. Beneath it, every long is paying up into the first serious long-term resistance the metal has reached since its decline began, with price already 295 points above its 20-day average and short-window stochastics pinned above 99.
Two sessions running, gold pushed to a new high and couldn't hold it into the close. Friday it was 4,432, Monday 4,453. The hours after Monday's settle took out both. What looked like a two-day topping attempt has resolved upward, which turns those former ceilings into the first references beneath the market if it slips.
The crowd is already all the way long
Positioning is the strongest argument for patience. Managed money holds more than fifteen longs for every short, and that survey predates the entire eight percent advance, so the real crowding is almost certainly worse now. A book that lopsided doesn't time a reversal, but it means any catalyst that turns this market meets a very large population of recently established longs with little cushion. The catalyst is on the calendar: Wednesday's inflation print. A hot number that lifts real yields is the single most direct threat to the trade. A soft one confirms the stagflation read of weak jobs and contained prices, and clears the runway toward the 200-day.
The settle told you gold had a quiet Monday. The order flow in the hours after it told you something far more urgent.
The setup requires the reclaim
This is why the plan does not anticipate the breakout, it requires it. The long triggers only on a confirmed hold above 4,495.7, meaning a close above the band followed by a retest that holds, stops at 4,471 where the reclaim would have failed, and works targets at 4,530, then 4,552, then the 4,618 200-day as a runner. Any headline signaling de-escalation in the Strait is immediate cause to reduce, regardless of level, because the premium driving this bid can be withdrawn in a single print. Beneath the band, the mirror trade is a fade of a failed reclaim back toward the 4,443 shelf and the settle. How we score a setup like this once it plays out is in our performance methodology.
Gold has earned the benefit of the doubt on direction, and it has not earned the right to be chased beneath the one line that matters.
This is the read our members get every session, before the bell, with the levels drawn and the setup defined. See how the same dealer-positioning work turns into systematic signals.
View pricingThe complete data picture
Every number behind Monday’s plan, charted first; the full numeric reference follows underneath.
Full numeric reference , every remaining figure from the review
| Average | Value | Price vs |
|---|---|---|
| 5-day | 4,379.0 | +97 |
| 20-day | 4,181.4 | +295 (reversion risk) |
| 50-day | 4,236.8 | +239 |
| 100-day | 4,494.4 | -18 (the decision line) |
| 200-day | 4,618.0 | -142 |
| YTD | 4,699.3 | -223 |
| Level | Reference |
|---|---|
| 4,345.0 | one-SD support |
| 4,335.9 | second pivot support |
| 4,314.1 | two-SD support |
| 4,300.4 | 40-day average crossing |
| 4,181.4 | 20-day average (deep reversion) |
| 4,015-4,019 | the base |
| Metric | Reading |
|---|---|
| Proxy last | 398.51 to 402.58, +1.02% |
| Call gamma / put gamma | -289.96M / +89.05M |
| Put-to-call OI | 0.49 |
| One-month implied / realized | 23.37% / 25.86% |
| Implied-vol rank / skew rank | 33.15% / 72.73% |
| Implied move | about 64 futures pts |
| Concentration expiry | Sept 17 (little near-dated pinning) |
| Composite | 32% buy, long-term sell |
| Cohort | Long / Short |
|---|---|
| Managed money | 139,809 / 9,043 (>15:1) |
| Non-commercials | 227,013 / 29,379 |
| Commercials | 71,832 / 298,323 (+10,554 shorts) |
| Swap dealers | 20,753 / 228,388 |
| Open interest | 308,015 |
| Note | survey predates the about 7.8% Aug 5-11 advance |
| Input | |
|---|---|
| Brent / WTI | 87.72 (+4.99%) / about 82 |
| Dollar index | +0.29% (gold rose anyway) |
| 10-year yield | higher on inflation expectations |
| Cleveland Fed | hawkish, hikes probably needed |
| 1-yr inflation expectations | 4.2% |
| Read | geopolitical + inflation bid, not a rate bid |
| When | Event |
|---|---|
| Tue 13:00 | US 3-year note auction |
| Wed 08:30 | US CPI 0.1% m/m, 3.4% y/y |
| Wed 10:30 | Crude inventories |
| Thu 08:30 | US PPI 4.8% y/y + claims + 2 Fed speakers |
| Fri 10:00 | Consumer sentiment + inflation expectations |
| Sep 16 | Next policy meeting |



