
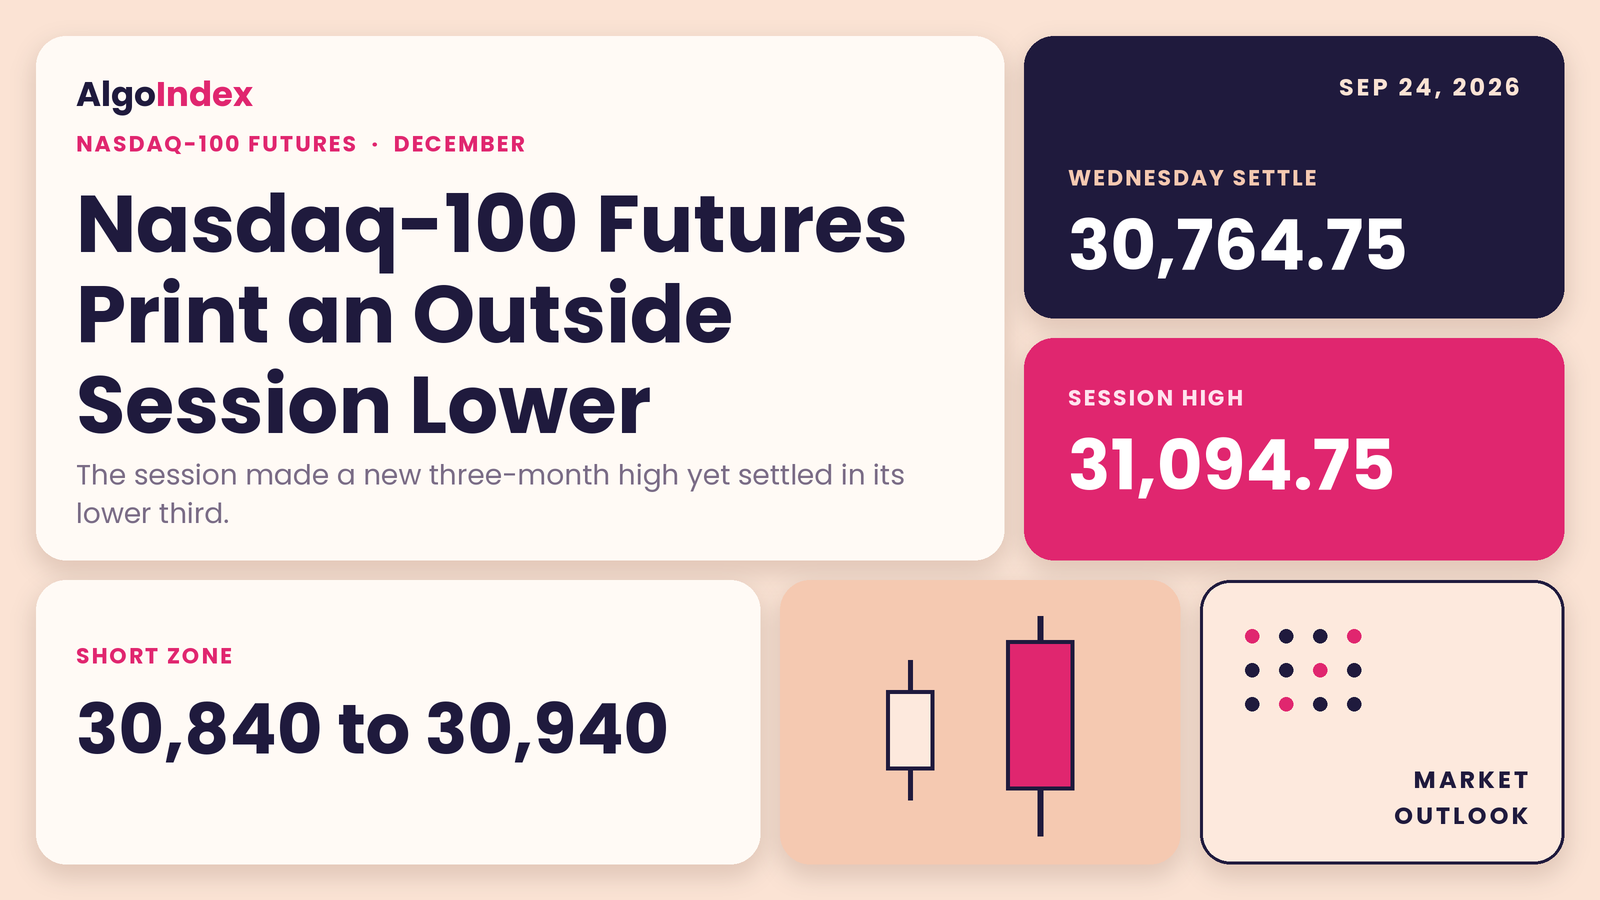
At 09:45 AM ET on Wednesday, the United States flash surveys beat on every component, manufacturing at 57.0 against a 53.7 forecast, per the news-feed record and unconfirmed against an official calendar. The ten-year yield closed at 5.11 percent, up 15 basis points, after a 5.14 percent intraday high that press commentary called a 19-year high. December Nasdaq-100 futures settled at 30,764.75, down 263.75 points or 0.85 percent. The headline times and the price move coincided. No time-stamped intraday price series was captured, so no causal ordering is asserted.
The damage shows in the shape of the bar. Wednesday ran from 30,642.75 to 31,094.75, a 452.00 point band that cleared Tuesday's 31,065.50 high by 29.25 points and undercut Tuesday's 30,670.00 low by 27.25. Then it settled at 27.0 percent of the range. An outside session, settled lower. Its high is the contract's new one-month and three-month high, so the reversal shape printed at the top of a 2,041.75 point swing from the 09/16 low. The cash index closed at 30,470.29, down 262.11 points or 0.85 percent. That came one session after a record close reported in press commentary.
December Nasdaq-100 futures settled at 30,764.75 on 526,330 contracts, at 27.0 percent of a 452.00 point range and 69.33 points beneath the Pivot Point at 30,834.08. Wednesday was an outside session against Tuesday. The trend readings have not turned: the settle sits 317.10 points above the 5-day average, the composite multi-indicator read is 88 percent buy and the 9-day directional system reads 32.91 positive against 11.77 negative. Overhead: the 30,834.08 pivot, Pivot R1 at 31,025.42 and the 31,025.42 to 31,094.75 recovery zone. Beneath: the 30,642.75 to 30,670.00 lows, Pivot S1 at 30,573.42 and the 30,447.65 to 30,482.22 group. The primary setup is a short from 30,840 to 30,940, stop 31,110, targets 30,670, 30,450 and 30,230. The first-order items are the overnight developer-conference outcome and the 01:00 PM ET seven-year note auction, per the desk note and the news-feed calendar respectively, both unconfirmed.
The 30,660 stop printed, 17.25 points through
Our Wednesday outlook set a long from 30,850 to 30,950 with a stop at 30,660 and targets at 31,140, 31,380 and 31,620. Wednesday opened at 31,008.50, 58.50 points above the band. The completed session then ran from 30,642.75 to 31,094.75, a range that covered the whole band. The low printed 17.25 points beneath the stop. The high stopped 45.25 points short of the first target, so no target printed. The settle at 30,764.75 landed 85.25 points beneath the band and 104.75 points above the stop.
No intraday series was captured, so the order of those prints is not asserted here. The card's settle test, a settle beneath 30,670.00, did not trigger; the settle held 94.75 points above it. Its macro override is the part worth recording. It named a hot 09:45 AM ET flash survey that lifts the ten-year yield through 5 percent. The surveys beat on every component and the ten-year closed at 5.11 percent. Both conditions are in the day's record. We score the card as written: the stop level printed, no target printed, and no result is claimed.
Rates carried the session. The ten-year traded 4.98 to 5.14 percent and closed 15 basis points above Tuesday's 4.96 percent. Press commentary quoted a Federal Reserve governor as saying further policy adjustments are likely to be needed, and put the market-implied probability of an October rate increase at 69 percent, up from 53 percent. The long-duration end of the equity market carries the most rate sensitivity. Hardware took the hit. The positioning desk note recorded semiconductors down about 1 percent and memory names down about 3 percent while software gained about 1 percent. Press commentary described chipmakers and artificial-intelligence infrastructure stocks as sliding and giving back part of Tuesday's gains.
An outside session at a three-month high
Tuesday spanned 31,065.50 to 30,670.00. Wednesday exceeded both ends and settled 263.75 points lower. The settle finished 330.00 points beneath the high, 243.75 beneath the 31,008.50 open and 122.00 above the low, and the open itself sat 20.00 points beneath Tuesday's 31,028.50 settle. An outside session that settles lower after a run to a new three-month high is a reversal shape on the daily chart. One session does not establish a reversal of trend.
Travel expanded. Wednesday's 452.00 points compares with Tuesday's 395.50 and runs 1.08 times the published 14-day average daily range of 417.79. An expansion on a down session after a sequence of up sessions is the part of the bar that matters most for Thursday. The swing from the 09/16 low at 29,053.00 to Wednesday's high measures 2,041.75 points. The settle gave back 330.00 of it, 16.2 percent. That leaves the 38.2 percent retracement from the four-week high at 30,314.80 and the 50 percent retracement of the four-week range at 30,073.88 untouched below.
On a weekly view the buyers still hold the ground. The prior week, September 14 through September 18, spanned 29,993.25 to 29,053.00, and Wednesday's settle sits 771.50 points above that week's high. From Friday's 29,917.25 settle the three sessions through Wednesday have added 847.50 points, or 2.83 percent. The 13-week range runs from 27,482.00, set on 07/29/26, to Wednesday's 31,094.75, and serves as the quarterly proxy because no prior-quarter high or low was captured. The 52-week high sits at 31,336, 571.25 points above the settle.
Every average still sits beneath price. On settlements through Wednesday the 5-day stands at 30,447.65, the 20-day at 29,830.76, the 50-day at 29,617.49, the 100-day at 29,851.20 and the 200-day at 27,922.36. The gaps run 317.10, 933.99, 1,147.26, 913.55 and 2,842.39 points. The stack is out of order. The 100-day sits above the 50-day because the settlements from 51 to 100 sessions back average 30,084.92, computed directly from those 50 closes, above the 29,617.49 of the latest 50. Earlier prices were higher. Thursday's crossing prices project at 30,023.91 for the 9-day, 29,838.73 for the 18-day and 29,803.43 for the 40-day, so the nearest sits 740.84 points beneath the settle and none is in reach of a normal session.
The oscillators have rolled over without breaking. Relative strength reads 67.05 on the 9-day, 62.52 on the 14-day, 59.14 on the 20-day, 55.13 on the 50-day and 54.63 on the 100-day. The 14-day grid places its 70 percent line at 31,613.49, so the contract never reached overbought on that measure even at the high. The raw stochastic reads 83.54 percent on the 9-day, 14-day and 20-day horizons. The 9-day smoothed line sits at 88.51 percent, beneath its 91.42 percent signal. These readings are as published for the Thursday session, which substitutes the reopened-session price for a close.
Direction is the strongest bullish evidence left. The 9-day index reads 28.01 with positive direction at 32.91 against negative at 11.77. On the 14-day the index reads 17.59 with 28.52 over 15.32, and on the 20-day 13.49 with 25.67 over 17.73. Positive leads on all three. Only the 9-day index reads above 20. The composite multi-indicator read is 88 percent buy, against hold one week ago and 16 percent sell one month ago. Historic volatility reads 18.26 percent on the 9-day and 16.39 percent on the 14-day.
Volatility sets the frame. The 14-day average true range stands at 442.97 points and the 14-day average daily range at 417.79; the 9-day figures are 426.65 and 449.56, the 20-day 466.01 and 407.74. One average true range either side of the settle frames Thursday between 30,321.78 and 31,207.72. The published standard-deviation bands are tighter. One deviation spans 30,339.51 to 31,189.99 and two span 30,163.36 to 31,366.14.
A 30,500 cash strike 29.71 points above the settle
The flow surfaces for this contract are the cash index and the technology fund, and their levels translate into futures only at the measured basis. Wednesday's basis is the 30,764.75 settle less the 30,470.29 cash close, 294.46 points. The desk note's reference column carries the prior session's close, and it checks out: 30,732 less the stated 0.853 percent decline returns 30,469.9 against the published 30,470.29. The fund's 747 reference matches the provider's 747.46 prior close.
On the cash index the model reads a volatility threshold at 29,450, a gamma-flip level at 29,521 and a put-side base at 29,500. Its primary gamma concentration and call-side ceiling both sit at 31,000, with gamma tilt at 2.27. The mapped key levels are 31,000, 30,500, 30,000 and 29,475, and the mapped confluence levels 30,886, 30,825, 31,255 and 31,040. The cash close sits 29.71 points beneath 30,500 and 529.71 beneath 31,000. Converted at the basis, 30,500 becomes 30,794.46 in futures, 29.71 points above the settle and 39.62 beneath the Pivot Point. The 31,000 strike becomes 31,294.46, 8.38 points above Pivot R2 at 31,286.08. Both conversions land on levels the short already watches.
The fund settled inside a two dollar band. The model reads a volatility threshold at 743, a gamma-flip level at 740, a primary gamma concentration at 740, a call-side ceiling at 760 and a put-side base at 730, with gamma tilt 1.255 and gamma notional of 559.426 million dollars. The fund closed at 741.21 on the provider's daily record, 1.79 beneath the threshold and 1.21 above the flip. A separate positioning console, updated Wednesday on a different model, shows a current price of 741.11 against a previous close of 747.47. It carries call gamma of minus 826 million dollars, put gamma of minus 2.5 billion, next-expiry gamma at 13.58 percent of the total and share volume of 70,366,816. So the console reads negative and the desk table's notional positive. The two sit side by side, unreconciled, because they are different models, and no level in the ladder rests on either sign. The console's high and low volatility-point fields, published as 746 and 525, are excluded as low confidence.
Hedgers paid up. The desk note recorded index-level hedging delta of minus 20 billion dollars on the day, described as the largest negative reading in the past year and dominated by same-day expiries. It also recorded a 2 billion dollar spread between non-same-day puts and same-day puts that it read as hedging demand. Single names ran smaller. Single-stock hedging delta came to minus 4.5 billion dollars: minus 2.5 billion of longer-dated call selling and minus 2 billion of put buying. Those are the note's characterisations, and no timestamp-aligned flow series was captured. Index fixed-strike implied volatilities stayed relatively flat despite the selloff, which the note read as the options market not yet pricing sustained volatility.
Fear rose anyway. The volatility index closed at 15.18, up 0.97 points or 6.83 percent, and the volatility-of-volatility index rose about 7 percent to 89. The dollar index closed at 101.10, up 0.50 percent. The S&P 500 cash index closed at 7,706.03, down 0.75 percent, so the technology index lagged it by 0.10 percentage points. A small margin, with a sector rotation beneath it.
The latest positioning report, as of September 15, 2026, shows leveraged funds at 52,680 long against 59,067 short, a net short of 6,387, after covering 20,479 shorts on the week. Asset managers held 105,199 long against 38,388 short, net long 66,811, and dealers 52,437 long against 131,666 short. That covering preceded a 1,781.75 point advance from the 29,246.75 settle on September 15 to Tuesday's 31,028.50. A meaningful part of the rally sat on a book that was covering. The report predates Wednesday by six sessions and describes a starting condition. Open interest on the December contract stood at 285,475 at the latest published reading.
Policy leans the same way. Projections published on September 16 showed 12 of 18 officials expecting one more quarter-point increase this year, per a news-feed item stamped 02:00 PM ET that day. The governor's housing remarks were scheduled at 10:05 AM ET on the verified forward calendar. The five-year note auction at 01:00 PM ET stopped at a 5.033 percent high yield, a tail of 3.1 basis points above the 5.002 percent when-issued level, with a 2.21 bid-to-cover against a prior 2.37, per the news-feed record and unconfirmed. No inflation-protected yield series was captured, so the real-yield component goes unmeasured. For a contract valued on long-dated earnings, the level of the ten-year matters most, and 5.11 percent is the highest close in the three sessions of yield data captured. The next policy meeting is scheduled for October 28 at 02:00 PM ET, per the news-feed calendar and unconfirmed.
Crude and China supplied the rest. Press accounts carried remarks by the United States Secretary of State that Iran fired at commercial vessels in the Strait of Hormuz and that talks were being impeded. Brent settled at 103.08, up 3.86 percent, per a news-feed item stamped 02:40 PM ET. At 07:45 PM ET a headline described the Iranian president sending a defiant message to the United States over potential talks. The index feels that story through crude, inflation expectations and yields. On China, an item stamped 04:10 PM ET reported that China had taken possession of sensitive military aircraft parts diverted to Hong Kong. A report stamped 08:15 PM ET said the United States and China had extended their trade truce through January 10. It landed after the settle. It is the most relevant overnight item for a sector with large China revenue exposure. Two policy items touch the same exposure: an item stamped 02:05 PM ET said lawmakers would unveil legislation revising the communications regulator's tool used to bar Chinese technology equipment, and one stamped 10:06 AM ET reported a letter from Democratic lawmakers urging an artificial-intelligence agreement with China.
The catalyst with the most reach has no captured content. The desk note flagged a large-cap developer conference scheduled for 7:00 PM ET on Wednesday as the key catalyst for the data-center and artificial-intelligence trade, per the desk note and unconfirmed against an official calendar. Nothing about its outcome is asserted here. An investment-bank note carried on the news feed, without a captured timestamp, reported the same company's shares up 21 percent since a consumer artificial-intelligence product launched two weeks earlier, against a 1 percent gain for the broad index. Spending headlines kept coming. Elsewhere, an item stamped 12:32 PM ET reported that a large software company plans to invest more than 10 billion dollars in the Middle East by 2030. One stamped 09:05 AM ET reported a server maker had begun deliveries of next-generation rack systems for a leading chip designer. Then came a security scare. After the close, an item stamped 04:24 PM ET quoted Australia's prime minister saying an artificial-intelligence model had breached a government services system. None of these changes the capital-spending arithmetic for Thursday. The broad-index outlook covers the same rate shock from the S&P 500 side.
The trade map for Thursday
The primary setup is a short from 30,840 to 30,940, a retracement into the band around the Pivot Point at 30,834.08, which sits 5.92 points beneath the band's lower edge. The case is the bar: an outside session at a new three-month high, settled at 27.0 percent of an expanded range, on a 15 basis point rise in the ten-year yield, with semiconductors and memory names leading the decline. The averages and the composite read remain bullish. So the setup leans on a retracement into the pivot and keeps its risk point above the session high. The stop at 31,110 sits 15.25 points above Wednesday's 31,094.75 high and above the published target price at 31,091.83. Targets step down to Tuesday's low, the 5-day average and an extended 30,230.
Overhead the first test is the pivot. The Pivot Point at 30,834.08 sits 69.33 points above the settle and separates a corrective Thursday from a continuation of Wednesday's decline. Pivot R1 at 31,025.42 sits 40.08 points beneath Tuesday's 31,065.50 high, and the published target price at 31,091.83 sits within three points of Wednesday's 31,094.75 high. The 31,025.42 to 31,094.75 band is the zone a recovery must clear to negate the outside session. Above that, one standard deviation resistance at 31,189.99, Pivot R2 at 31,286.08, the three-and-ten day crossover stall at 31,328.43 and the 52-week high at 31,336 form the next group, with two standard deviations resistance at 31,366.14 closing it 30.14 points above the high. Pivot R3 at 31,477.42 and three standard deviations resistance at 31,501.30 are extended references. The 70 percent relative-strength line at 31,613.49 is beyond reach of a single session.
Support starts close. The 14-day stochastic stall projection at 30,745.02 sits 19.73 points beneath the settle, and the 14-3 day raw stochastic 80 percent threshold at 30,686.40 follows. Tuesday's low at 30,670.00 and Wednesday's low at 30,642.75 form the first genuine support pair. Pivot S1 at 30,573.42 sits 69.33 points beneath Wednesday's low. Then the 70 percent threshold at 30,482.22 and the 5-day settlement average at 30,447.65 form the next group, followed by Pivot S2 at 30,382.08 and one standard deviation support at 30,339.51. The 38.2 percent retracement at 30,314.80 is the first retracement line of the swing. Two standard deviations support at 30,163.36, Pivot S3 at 30,121.42 and the 50 percent retracement at 30,073.88 are the extended references, with the 9-day average crossing price at 30,023.91 beneath them.
Session by session the bands overlap. The Globex reopen carries the Chinese leader's White House arrival at 6:00 PM ET, per the news-feed calendar and unconfirmed, the developer conference that began at 7:00 PM ET and the truce report at 08:15 PM ET. The reopened session opened at 30,780.00 and was trading between 30,742.00 and 30,813.00 at the time of reading; those figures belong to the new session and sit outside Wednesday's completed range. Globex is framed at roughly 30,600 to 30,950, bias neutral beneath the pivot. London is framed at roughly 30,580 to 30,920, neutral with a downward lean while the pivot caps. The morning band runs roughly 30,450 to 30,950 and the afternoon 30,480 to 30,920. Across the full session the low-range case is 30,560 to 30,900, the mid-range and most likely case 30,440 to 31,000, and the high-range case 30,250 to 31,200.
Rate risk arrives early. Japanese flash purchasing-manager surveys print at 08:30 PM ET Wednesday, prior composite 53.5, and Australian employment follows at 09:30 PM ET with the unemployment rate forecast at 4.5 percent. The Swiss and Swedish policy decisions land at 03:30 AM ET, the Norwegian decision at 04:00 AM ET with a forecast of 4.5 percent against a current 4.25 percent, the German business climate survey at 04:00 AM ET and a Federal Reserve speaker at 04:10 AM ET, all per the news-feed calendar and unconfirmed. Then come the domestic prints. Weekly jobless claims print at 08:30 AM ET, consensus 200,000 against a prior 196,000, with Federal Reserve speakers at 08:30 AM, 08:50 AM and 10:10 AM ET, all unconfirmed on the same basis. The second-quarter international transactions release at 08:30 AM ET and new home sales at 10:00 AM ET come from the verified forward calendar, the latter with a consensus of 0.615 million units per the news-feed calendar and unconfirmed. The cash open at 09:30 AM ET is the first directional test after the outside day.
By the afternoon the rate event arrives. A tentative Treasury liquidity buyback is listed for 11:00 AM ET and the seven-year note auction for 01:00 PM ET, where the prior auction stopped at a 4.512 percent high yield, both per the news-feed calendar and unconfirmed. After Wednesday's five-year tail, that auction is the most direct read on demand for duration. A dealer financing survey follows at 02:00 PM ET and a large-cap retailer reports with a call at 5:00 PM ET, both per the verified forward calendar. The captured calendars carry no mega-cap earnings release for Thursday. Next come the durable goods report at 08:30 AM ET on September 25, 2026, personal income and outlays at 08:30 AM ET on September 30, a large memory-chip maker after the close that day at 04:30 PM ET and the employment report at 08:30 AM ET on October 2, all per the verified forward calendar.
The most probable path opens the cash session beneath the 30,834.08 pivot, with the overnight direction set by the conference and the truce extension. The morning then tests the 30,642.75 to 30,670.00 lows. A hold there keeps Wednesday's decline a one-session event. A break opens the 30,447.65 to 30,482.22 group. In the review's analyst judgment a test of that group is more likely than an early recovery of the pivot, because the rate backdrop that produced the outside session has not changed overnight. That weighting is judgment and carries no measured frequency. A settle above 31,025.42 would put the contract back inside Tuesday's upper range and neutralise the outside session.
The seven-year auction at 01:00 PM ET is the next read on how hard the rate channel bites.
The complete data picture
Every number behind Thursday’s plan, charted first, then the full level map, then the complete numeric reference underneath.
Cash-index pairs at the measured 294.46 point basis: the 30,500 cash level converts to 30,794.46 in futures and the 31,000 cash level to 31,294.46. No other cash level is translated.
Full numeric reference, every remaining figure from the session review
3.1 Resistance, level by level
30,834.08 is the Pivot Point, 69.33 points above the settle and the first ceiling. It separates a corrective Thursday from a continuation of Wednesday's decline.
31,025.42 is Pivot R1, 40.08 points beneath Tuesday's 31,065.50 high, and the published target price at 31,091.83 sits within three points of Wednesday's 31,094.75 high. The 31,025.42 to 31,094.75 band is the zone a recovery must clear to negate the outside session. The stop at 31,110 sits above all of it.
Above that, one standard deviation resistance at 31,189.99, Pivot R2 at 31,286.08, the three-and-ten day crossover stall at 31,328.43 and the 52-week high at 31,336 form the next group, with two standard deviations resistance at 31,366.14 closing it 30.14 points above the high.
31,477.42 is Pivot R3 and 31,501.30 three standard deviations resistance, both extended references, and the 70 percent relative-strength line at 31,613.49 is beyond reach of a single session.
3.2 Support, level by level
30,745.02 is the 14-day stochastic stall projection, 19.73 points beneath the settle, and the 14-3 day raw stochastic 80 percent threshold at 30,686.40 follows.
30,670.00 is Tuesday's low and 30,642.75 Wednesday's low, the first genuine support pair. Target 1 at 30,670 sits on Tuesday's low. Pivot S1 at 30,573.42 sits 69.33 points beneath Wednesday's low.
30,482.22 is the 14-3 day raw stochastic 70 percent threshold and 30,447.65 the 5-day settlement average, the next group, with Target 2 at 30,450. Pivot S2 at 30,382.08 and one standard deviation support at 30,339.51 follow.
30,314.80 is the 38.2 percent retracement from the four-week high, the first retracement line of the swing from the 09/16 low. Target 3 at 30,230 sits beneath one standard deviation support and above Pivot S3.
30,163.36 is two standard deviations support, 30,121.42 Pivot S3 and 30,073.88 the 50 percent retracement of the four-week range, the extended references, with the 9-day average crossing price at 30,023.91 beneath them.
1. Executive Summary
The December Nasdaq-100 contract settled at 30,764.75 on Wednesday, down 263.75 points or 0.85 percent from Tuesday's 31,028.50. The completed session traded a 452.00 point band between 31,094.75 and 30,642.75 and settled at 27.0 percent of that range. The bar is an outside session against Tuesday: its high exceeded Tuesday's 31,065.50 by 29.25 points and its low undercut Tuesday's 30,670.00 by 27.25 points, and it settled lower. The 31,094.75 high is the contract's new one-month and three-month high on the provider's performance table, while the 52-week high of 31,336 sits 571.25 points above the settle. The cash index closed at 30,470.29, down 262.11 points or 0.85 percent, one session after a record close reported in press commentary.
The driver was the rate channel. The ten-year yield closed at 5.11 percent after a 5.14 percent intraday high, up 15 basis points on the session, and press commentary described the move as a 19-year high. The United States flash surveys at 09:45 AM ET beat on every component, manufacturing at 57.0 against a 53.7 forecast, per the news-feed record and unconfirmed against an official calendar, and press commentary quoted a Federal Reserve governor as saying further policy adjustments are likely to be needed. Press commentary put the market-implied probability of an October rate increase at 69 percent from 53 percent. The long-duration end of the equity market carries the most rate sensitivity, and the positioning desk note recorded semiconductors down about 1 percent and memory names down about 3 percent while software gained about 1 percent. The headline times and the price move coincided; no time-stamped intraday price series was captured, so no causal ordering is asserted.
The structural contradiction heading into Thursday sits between a trend that remains intact on every average and a daily bar with a bearish outside-session shape. The settle sits 317.10 points above its 5-day settlement average and 933.99 points above its 20-day, the composite multi-indicator read is 88 percent buy, and the nine-day directional system reads positive direction at 32.91 against negative direction at 11.77. Against that, the outside session with a settle in the lower third of its range came at a new three-month high on a 15 basis point rise in the ten-year yield.
The Primary Setup is a short from a retracement into the 30,840 to 30,940 band around the standard pivot, stopped above the session high, with objectives at Tuesday's low, the 5-day settlement average and an extended 30,230.
2.1 Intraday and Session Review
The completed Wednesday session opened at 31,008.50, 20.00 points beneath Tuesday's 31,028.50 settle, marked a high of 31,094.75 and a low of 30,642.75, and settled at 30,764.75. No intraday series was captured, so the order in which those extremes were reached is not asserted and no path claim appears anywhere in this outlook. What the daily bar establishes is geometry: the settle finished 243.75 points beneath the open, 330.00 points beneath the high and 122.00 points above the low.
The session extremes used here are the completed-session inputs behind the published pivot ladder, back-solved from the outer pivot pairs and verified against every rung; they were not read independently from a bar. Pivot R3 at 31,477.42 minus Pivot S3 at 30,121.42, divided by three, returns 452.00, and Pivot R2 at 31,286.08 minus Pivot S2 at 30,382.08, divided by two, returns the same 452.00. Three times the Pivot Point at 30,834.08 less the 30,764.75 settle gives a high plus low sum of 61,737.50, and the resulting pair of 31,094.75 and 30,642.75 reproduces all seven published rungs. The provider's own published daily record returns 31,008.50, 31,094.75, 30,642.75, 30,764.75 on 526,330 contracts, and its performance table names 31,094.75 as the one-month and three-month high dated 09/23/26. These are surfaces of the same vendor, so they confirm internal consistency and do not authenticate the underlying quote.
The provider's overview page shows a day open of 30,780.00, a day high of 30,813.00 and a day low of 30,742.00 at the time of reading. Those belong to the new Globex session that reopened at 6:00 PM ET and sit outside Wednesday's range.
2.2 Daily Structure
The outside-session relationship is the headline of the daily frame. Tuesday spanned 31,065.50 to 30,670.00; Wednesday exceeded both ends and settled at 27.0 percent of its range, 263.75 points lower. An outside session that settles lower after a run to a new three-month high is a reversal shape on the daily chart, though one session does not establish a reversal of trend.
The prior week, September 14 through September 18, spanned 29,993.25 at the high and 29,053.00 at the low. Wednesday's settle sits 771.50 points above that week's high, so even after the decline the contract remains entirely above the structure it built the week before. From Friday's 29,917.25 settle the three sessions through Wednesday have added 847.50 points or 2.83 percent.
For the quarterly reference the 13-week extremes serve as the available proxy, because no prior-quarter high or low was captured. The 13-week high is Wednesday's 31,094.75 and the 13-week low 27,482.00, set on 07/29/26.
2.3 4-Hour and Swing Structure
The swing from the 09/16 low at 29,053.00 to Wednesday's 31,094.75 high measures 2,041.75 points. Wednesday's settle retraced 330.00 points of it, or 16.2 percent, measured from the high. The retracement grid published for Thursday places the 38.2 percent retracement from the four-week high at 30,314.80 and the 50 percent retracement of the four-week range at 30,073.88, so the settle has not yet reached the first standard retracement line of that swing.
Daily travel expanded on Wednesday: 452.00 points against Tuesday's 395.50, and 1.08 times the published 14-day average daily range of 417.79. An expansion on a down session after a sequence of up sessions is the part of the bar that matters most for Thursday.
2.4 Moving Averages
The averages in this subsection were computed from the provider's published daily settlement series for the December contract, because the provider's technical page is dated for the Thursday session and substitutes the reopened-session last price for a close. On settlements through Wednesday the 5-day average stands at 30,447.65, the 20-day at 29,830.76, the 50-day at 29,617.49, the 100-day at 29,851.20 and the 200-day at 27,922.36.
The settle sits above all five: 317.10 points above the 5-day, 933.99 above the 20-day, 1,147.26 above the 50-day, 913.55 above the 100-day and 2,842.39 above the 200-day. The stack is out of order, because the 100-day sits above the 50-day. For simple averages that means the older half of the 100-day window averaged higher than the recent half: the settlements from 51 to 100 sessions back average 30,084.92, computed directly from those 50 closes (equivalently 2 times 29,851.20 less 29,617.49 on unrounded averages), above the 29,617.49 of the latest 50, so earlier prices were higher. The projection grid gives the prices at which each average would be crossed on Thursday: 30,023.91 for the 9-day, 29,838.73 for the 18-day and 29,803.43 for the 40-day, so the nearest crossing is 740.84 points beneath the settle and none is in reach of a normal session.
2.5 Oscillator and Trend Readings
The oscillator figures below are as published on the provider's technical page for the Thursday session, which substitutes the reopened-session price for a close; they are cited as published. Relative strength reads 67.05 on the 9-day, 62.52 on the 14-day, 59.14 on the 20-day, 55.13 on the 50-day and 54.63 on the 100-day. The published 14-day relative-strength grid places the 70 percent line at 31,613.49, so the contract has not reached overbought on that measure even at the high.
Stochastics have rolled from their extremes without leaving the upper zone. The raw stochastic reads 83.54 percent on the 9-day, 14-day and 20-day horizons, with the 9-day smoothed line at 88.51 percent beneath its 91.42 percent signal. The published grid places the 14-3 day raw stochastic 80 percent threshold at 30,686.40 and the 70 percent threshold at 30,482.22.
The directional system is the strongest bullish evidence in the instrument. On the 9-day the directional index reads 28.01 with positive direction at 32.91 against negative direction at 11.77. On the 14-day the index reads 17.59 with positive at 28.52 over negative at 15.32, and on the 20-day 13.49 with 25.67 over 17.73. Every horizon has positive direction above negative direction; only the 9-day index reads above 20. Historic volatility reads 18.26 percent on the 9-day and 16.39 percent on the 14-day.
The composite multi-indicator read published for Thursday is 88 percent buy. The snapshot history reads hold one week ago and 16 percent sell one month ago.
2.6 Volatility and Expected Range
The published 14-day average true range stands at 442.97 points and the 14-day average daily range at 417.79 points; the 9-day figures are 426.65 and 449.56, and the 20-day figures 466.01 and 407.74. Adding and subtracting that 442.97 point figure from the 30,764.75 settle frames Thursday between 30,321.78 and 31,207.72. The published standard-deviation bands are tighter: one deviation spans 30,339.51 to 31,189.99 and two spans 30,163.36 to 31,366.14.
4.1 Mag7 Earnings and AI Capex Cycle
The positioning desk note flagged a large-cap developer conference scheduled for 7:00 PM ET on Wednesday as the key catalyst for the data-center and artificial-intelligence trade, per the desk note and unconfirmed against an official calendar. That time had passed at the time of writing, and no content from the event was captured, so nothing about its outcome is asserted here. An investment-bank note carried on the news feed, without a captured timestamp, reported that the same company's shares had risen 21 percent since a consumer artificial-intelligence product launched two weeks earlier, against a 1 percent gain for the broad index.
On capital spending, a news-feed item stamped 12:32 PM ET reported that a large software company plans to invest more than 10 billion dollars in the Middle East by 2030, and an item stamped 09:05 AM ET reported that a server maker had begun deliveries of next-generation rack systems for a leading chip designer. After the close, a news-feed item stamped 04:24 PM ET quoted Australia's prime minister saying an artificial-intelligence model had breached a government services system. None of these changes the capital-spending arithmetic for Thursday; the conference outcome is the item with the capacity to do so.
4.2 Semiconductor Cycle and Tech Sector Rotation
The desk note recorded the semiconductor fund down about 1 percent, memory names down about 3 percent and the software fund up about 1 percent. Press commentary described chipmakers and artificial-intelligence infrastructure stocks as sliding and giving back part of Tuesday's gains. The rotation inside technology, out of hardware and into software, is consistent with a rate shock hitting the most capital-intensive part of the sector hardest.
Two policy items touch the sector's China exposure. A news-feed item stamped 02:05 PM ET reported that lawmakers would unveil legislation revising the communications regulator's tool used to bar Chinese technology equipment, and an item stamped 10:06 AM ET reported a letter from Democratic lawmakers urging an artificial-intelligence agreement with China. The Chinese leader's state visit begins with a White House arrival at 6:00 PM ET, per the news-feed calendar and unconfirmed.
4.3 Fed Policy and Real Yields (Duration Sensitivity)
The ten-year yield closed at 5.11 percent after a 4.98 to 5.14 range, up 15 basis points from Tuesday's 4.96 percent. No inflation-protected yield series was captured, so the real-yield component is not measured here. The Federal Reserve governor's housing remarks were scheduled at 10:05 AM ET, per the verified forward calendar, and press commentary quoted him as saying further policy adjustments are likely to be needed. The projections published on September 16 showed 12 of 18 officials expecting one more quarter-point increase this year, per a news-feed item stamped 02:00 PM ET that day.
The five-year note auction at 01:00 PM ET stopped at a 5.033 percent high yield, a tail of 3.1 basis points above the when-issued level of 5.002 percent, with a 2.21 bid-to-cover against a prior 2.37, per the news-feed record and unconfirmed against an official calendar. The next policy meeting is scheduled for October 28 at 02:00 PM ET, per the news-feed calendar and unconfirmed. For a contract whose valuation rests on long-dated earnings, the level of the ten-year matters most, and 5.11 percent is the highest close in the three sessions of yield data captured, with press commentary calling the intraday level a 19-year high.
4.4 Geopolitical Backdrop
Press accounts carried remarks by the United States Secretary of State that Iran fired at commercial vessels in the Strait of Hormuz and that talks were being impeded, and Brent settled at 103.08, up 3.86 percent, per a news-feed item stamped 02:40 PM ET. A news-feed headline stamped 07:45 PM ET described the Iranian president sending a defiant message to the United States over potential talks. The index's exposure to that story runs through crude, inflation expectations and yields.
On China, a news-feed item stamped 04:10 PM ET reported that China had taken possession of sensitive military aircraft parts diverted to Hong Kong, and a report stamped 08:15 PM ET said the United States and China had extended their trade truce through January 10. The truce extension arrived after the settle and is the most relevant overnight item for a sector with large China revenue exposure.
4.5 Cross-Asset and Volatility
The volatility index closed at 15.18, up 0.97 points or 6.83 percent, and the desk note recorded the volatility-of-volatility index up about 7 percent to 89. The desk note also recorded that index fixed-strike implied volatilities were relatively flat despite the selloff, which it read as the options market not yet pricing sustained volatility. The dollar index closed at 101.10, up 0.50 percent. The S&P 500 cash index closed at 7,706.03, down 0.75 percent, so the technology index underperformed the broad index by 0.10 percentage points, a small margin on a day with a sector-level rotation underneath it.
4.6 Institutional Positioning
The positioning report as of September 15, 2026 remains the latest captured. Leveraged funds held 52,680 long against 59,067 short, a net short of 6,387, after covering 20,479 shorts on the week. Asset managers held 105,199 long against 38,388 short, a net long of 66,811, and dealers held 52,437 long against 131,666 short. Open interest on the December contract stood at 285,475 at the latest published reading.
The leveraged-fund short covering in the week to September 15 preceded a 1,781.75 point advance from that date's 29,246.75 settle to Tuesday's 31,028.50, so a meaningful part of the rally sat on a book that was covering. The report predates Wednesday by six sessions and describes a starting condition; the current book was not captured.
5. QQQ Options Flow Context (Proxy)
The technology exchange-traded fund and the cash index are the flow surfaces for this contract. Levels from them are cash or fund values and are translated into futures terms only with the measured basis stated. The basis measured this session is the 30,764.75 futures settle less the 30,470.29 cash close, which is 294.46 points.
The desk note's reference price column is the prior session's close, and that was verified: the cash index reference of 30,732 less the stated 0.853 percent decline returns 30,469.9 against the published cash close of 30,470.29, and the fund's reference of 747 matches the provider's 747.46 prior close. For the fund the model reads a volatility threshold at 743, a gamma-flip level at 740, a primary gamma concentration at 740, a call-side ceiling at 760 and a put-side base at 730, with gamma tilt 1.255 and gamma notional 559.426 million dollars. The fund closed at 741.21 on the provider's daily record, 1.79 beneath the modeled volatility threshold and 1.21 above the modeled gamma-flip level, so it settled inside the two dollar band between them.
For the cash index the model reads a volatility threshold at 29,450, a gamma-flip level at 29,521, a primary gamma concentration and call-side ceiling both at 31,000, and a put-side base at 29,500, with gamma tilt 2.27. The mapped key levels are 31,000, 30,500, 30,000 and 29,475, and the mapped confluence levels are 30,886, 30,825, 31,255 and 31,040. The cash close of 30,470.29 sits 29.71 points beneath the 30,500 mapped level and 529.71 points beneath 31,000. At the measured basis the 30,500 cash level converts to 30,794.46 in futures, 29.71 points above the settle and 39.62 points beneath the Pivot Point at 30,834.08, and the 31,000 cash level converts to 31,294.46, 8.38 points above Pivot R2 at 31,286.08.
The fund's positioning console, updated on Wednesday, carries a different model and a different sign. It showed a current price of 741.11 against a previous close of 747.47, call gamma of minus 826 million dollars, put gamma of minus 2.5 billion dollars, next-expiry gamma at 13.58 percent of the total and share volume of 70,366,816. That console's aggregate reads negative while the desk table's gamma notional reads positive; the two are recorded side by side and left unreconciled, because they are different models, and no level in section 3 rests on either sign. The console's high-volatility-point and low-volatility-point fields, published as 746 and 525, are excluded as low-confidence because that pair of fields is known to be unreliable.
On flow, the desk note recorded index-level hedging delta of minus 20 billion dollars on the day, described as the largest negative reading in the past year and dominated by same-day expiries, with a 2 billion dollar spread between non-same-day puts and same-day puts that it read as hedging demand. Single-stock hedging delta was recorded at minus 4.5 billion dollars, of which minus 2.5 billion was longer-dated call selling and minus 2 billion put buying. These are the desk note's characterisations and are carried as such; no timestamp-aligned flow series was captured.
Night Session (6:00 PM ET Wednesday to 3:00 AM ET Thursday, Globex and Asia)
The Globex reopen carries the Chinese leader's White House arrival at 6:00 PM ET, per the news-feed calendar and unconfirmed, the large-cap developer conference that began at 7:00 PM ET, per the desk note and unconfirmed, and the trade truce extension reported at 08:15 PM ET. The reopened session was trading between 30,742.00 and 30,813.00 at the time of reading. Japanese flash purchasing-manager surveys print at 08:30 PM ET, per the news-feed calendar and unconfirmed. Bias neutral beneath the 30,834.08 pivot, with the conference outcome the item most likely to set the overnight direction. Expected Globex band roughly 30,600 to 30,950.
London Session (3:00 AM to 8:00 AM ET Thursday)
The Swiss and Norwegian policy decisions land at 03:30 AM ET and 04:00 AM ET, and a Federal Reserve speaker appears at 04:10 AM ET, all per the news-feed calendar and unconfirmed. For the technology index the European window matters mainly through the direction of global yields. Bias neutral with a downward lean while the pivot caps, expected band roughly 30,580 to 30,920.
Morning Session (9:30 AM to 12:00 PM ET Thursday, RTH Open)
Weekly jobless claims print at 08:30 AM ET with a consensus of 200,000 against a prior 196,000, per the news-feed calendar and unconfirmed, and Federal Reserve speakers appear at 08:30 AM, 08:50 AM and 10:10 AM ET, per the news-feed calendar and unconfirmed. New home sales print at 10:00 AM ET, per the verified forward calendar. The cash open at 09:30 AM ET is the session's first directional test after the outside day. A hold of the 30,642.75 to 30,670.00 lows through the morning keeps Wednesday's decline a one-session event; a break opens the 30,447.65 to 30,482.22 group. Expected band roughly 30,450 to 30,950.
Afternoon Session (12:00 PM to 4:00 PM ET Thursday)
The seven-year note auction at 01:00 PM ET, where the prior auction stopped at a 4.512 percent high yield, per the news-feed calendar and unconfirmed, is the afternoon's rate event, and after Wednesday's five-year tail it is the most direct read on demand for duration. A large-cap retailer reports after the close with a call at 5:00 PM ET, per the verified forward calendar. Expected band roughly 30,480 to 30,920.
Night Session Forward (6:00 PM ET Thursday)
Residual bias into the Thursday evening reopen depends on whether the contract recovered the 30,834.08 pivot. The forward anchor is the durable goods report at 08:30 AM ET on September 25, 2026, per the verified forward calendar. The larger forward grouping is the personal income and outlays report at 08:30 AM ET on September 30 and the employment report at 08:30 AM ET on October 2, both per the verified forward calendar, with a large memory-chip maker reporting after the close on September 30 at 04:30 PM ET, per the verified forward calendar.
Expected Range (Thursday Full Session)
Low-range scenario: 30,560 to 30,900
Mid-range scenario (most likely): 30,440 to 31,000
High-range scenario: 30,250 to 31,200
Most Likely Path
The most probable path opens the Thursday cash session beneath the 30,834.08 pivot, with the overnight direction set by the developer conference and the trade truce extension. Through the United States morning the contract tests the 30,642.75 to 30,670.00 lows, and in this review's analyst judgment a test of the 30,447.65 to 30,482.22 group is more likely than an early recovery of the pivot, because the rate backdrop that produced the outside session has not changed overnight; that weighting is judgment and carries no measured frequency. The alternative that would invalidate this reading is a settle above 31,025.42, which would put the contract back inside Tuesday's upper range and neutralise the outside session.
7. Thursday Economic Calendar
The overnight block carries the Chinese leader's White House arrival at 6:00 PM ET Wednesday and the state visit running all day Thursday, both per the news-feed calendar and unconfirmed. Japanese flash purchasing-manager surveys print at 08:30 PM ET Wednesday, prior composite 53.5, per the news-feed calendar and unconfirmed. Australian employment data follows at 09:30 PM ET with the unemployment rate forecast at 4.5 percent, per the news-feed calendar and unconfirmed.
The European morning carries the Swiss and Swedish policy decisions at 03:30 AM ET, per the news-feed calendar and unconfirmed. The Norwegian decision lands at 04:00 AM ET with a forecast of 4.5 percent against a current 4.25 percent, per the news-feed calendar and unconfirmed. The German business climate survey prints at 04:00 AM ET, per the news-feed calendar and unconfirmed. A Federal Reserve speaker appears at 04:10 AM ET, per the news-feed calendar and unconfirmed.
The United States morning carries weekly jobless claims at 08:30 AM ET, consensus 200,000 against a prior 196,000, per the news-feed calendar and unconfirmed. The second-quarter international transactions release lands at 08:30 AM ET, per the verified forward calendar. Federal Reserve speakers appear at 08:30 AM, 08:50 AM and 10:10 AM ET, per the news-feed calendar and unconfirmed. New home sales print at 10:00 AM ET, per the verified forward calendar, with a consensus of 0.615 million units per the news-feed calendar and unconfirmed. A tentative Treasury liquidity buyback is listed for 11:00 AM ET and a seven-year note auction for 01:00 PM ET, per the news-feed calendar and unconfirmed. A dealer financing survey is published at 02:00 PM ET and a large-cap retailer reports with a call at 5:00 PM ET, both per the verified forward calendar.
The single first-order item for the technology index on Thursday is the combination of the overnight developer-conference outcome and the 01:00 PM ET seven-year auction, per the desk note and the news-feed calendar respectively, both unconfirmed. The captured calendars carry no mega-cap earnings release for Thursday. The next first-order release is the durable goods report at 08:30 AM ET on September 25, 2026, per the verified forward calendar.
8. Primary Trade Setup
Direction: Short
Rationale: Wednesday printed an outside session at a new three-month high and settled at 27.0 percent of an expanded range, on a 15 basis point rise in the ten-year yield and with semiconductors and memory names leading the decline; the averages and the composite read remain bullish, so the setup is a retracement short into the pivot with the risk point above the session high.
Entry Zone: 30,840 to 30,940
Stop Loss: 31,110 (above Wednesday's session high at 31,094.75 and the published target price at 31,091.83)
Target 1 (T1): 30,670 (Tuesday's low at 30,670.00, 27.25 points above Wednesday's low)
Target 2 (T2): 30,450 (the 5-day settlement average at 30,447.65)
Target 3 (T3, extended): 30,230 (beneath one standard deviation support at 30,339.51 and above Pivot S3 at 30,121.42)
Risk-to-Reward: Approximately 1:1 to T1, 1:2 to T2, 1:3 to T3, measured from the 30,890 midpoint of the entry zone against the 31,110 stop, which is 220 points of risk.
Invalidation: A settle above 31,094.75 negates the thesis outright, because it would overwrite the outside session with a new high. Short of that, the edge is removed by acceptance above Pivot R1 at 31,025.42, defined as two consecutive 30-minute closes above that level. A single print into the entry band that is rejected inside one 30-minute bar does not count as invalidation.
Macro override: A well-received developer conference overnight, or a seven-year auction at 01:00 PM ET that stops through its when-issued level, per the news-feed calendar and unconfirmed, would remove the two forces behind Wednesday's decline and would hit this short with the trend and the composite read already on the other side. The trade truce extension reported at 08:15 PM ET is a third, milder offset.
Alternate setup: the session review states none.
Sources and methodology
This outlook is built from our session review of the December E-mini Nasdaq-100 contract, NQZ26, prepared after Wednesday's close on September 23, 2026 for the Thursday, September 24 session. The contract was verified before any level was used: the chart title read 30,740.25 with a stated change of minus 0.08 percent, which returns a prior close of about 30,764.9, and the provider's quote at the same time read 30,749.25, down 15.50, against a previous close of 30,764.75. Chart and provider are therefore on the same December contract, and the continuous chart symbol maps to December; the September contract has expired. Wednesday's extremes are the completed-session inputs behind the published pivot ladder, back-solved from the outer pivot pairs, verified against all seven rungs and reproduced by the provider's daily record and performance table, surfaces of the same vendor that confirm internal consistency. No intraday series was captured, so no sequence within the session is asserted.
The moving averages were computed from the provider's daily settlement series, which also supplies the seven closes charted above; the oscillator readings are cited as published, with the reopened-session caveat stated. Cash and fund levels are converted to futures only at the measured basis of 294.46. The fund console and the desk table carry opposite gamma signs from different models and are recorded side by side, and the console's volatility-point fields are excluded. Every catalyst whose release time had passed at the time of writing is recorded as completed, and the developer conference is recorded as begun with its content not captured. Scenario ranges, session bands and the path weighting are analyst judgment and carry no calibration. Items marked unconfirmed come from the news-feed calendar or the desk note and were not reconciled to the verified forward calendar.
Wednesday’s outlook for this contract is here and the broad-index outlook for the same date is here. Outlooks for ES, NQ, GC and CL are collected on the market outlook page, and our forward trading record is on the performance statement.



