
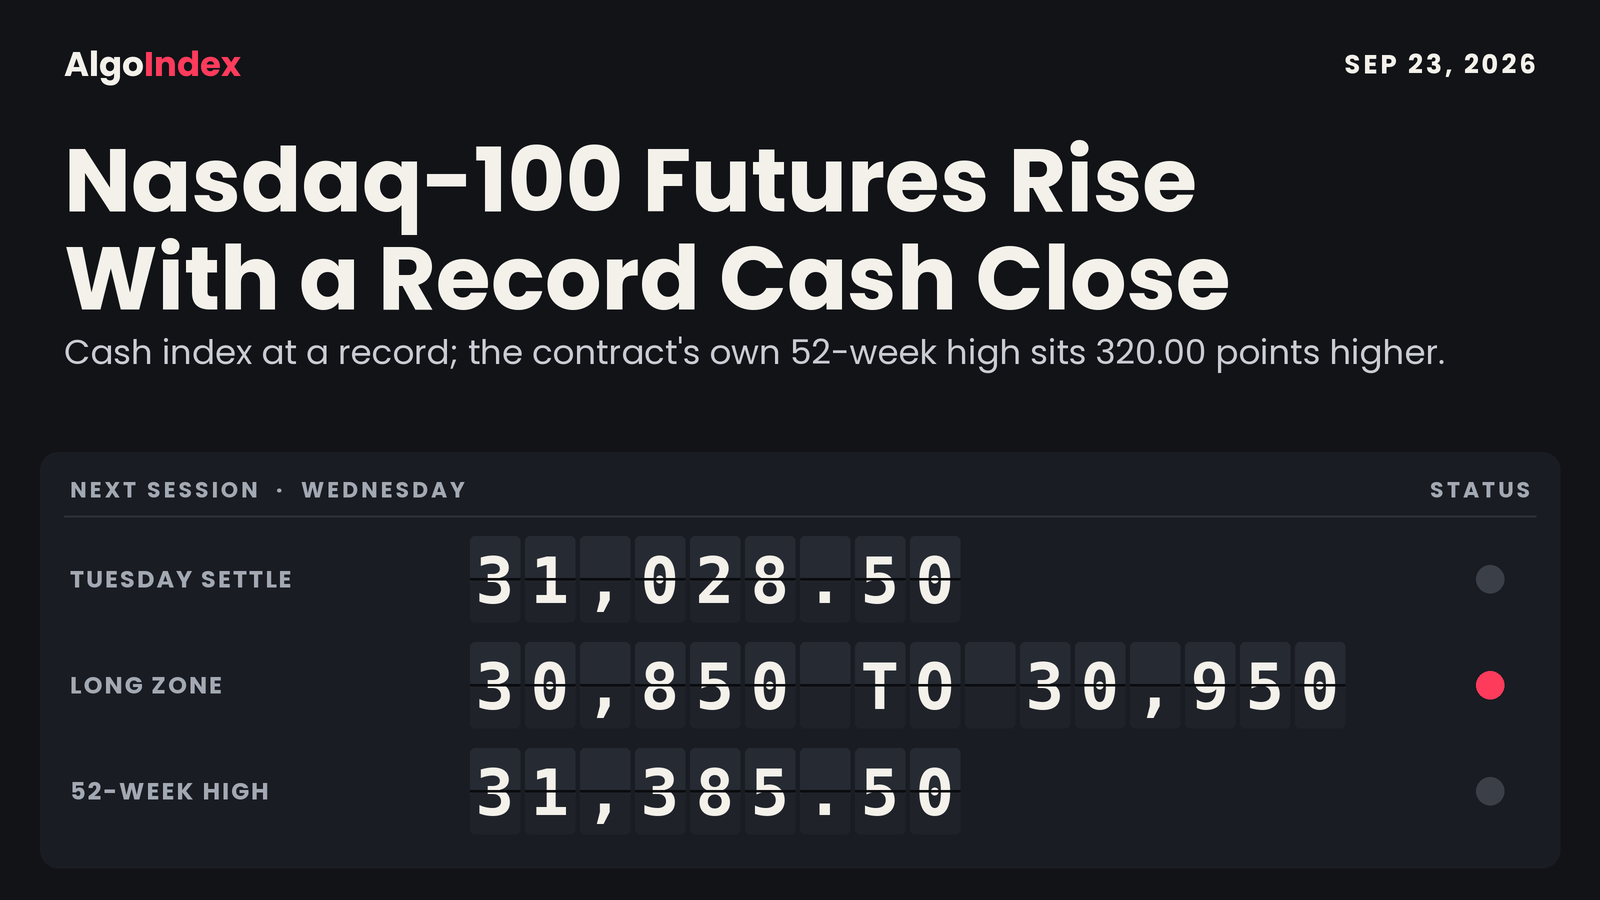
Memory chips led. Press commentary put memory names up 3 percent on Tuesday, with two memory issuers cited up 5 and 7 percent and the semiconductor complex up 2 percent. It credited that leadership directly with the cash Nasdaq-100's record. December Nasdaq-100 futures settled at 31,028.50, up 243.75 points or 0.79 percent from Monday's 30,784.75 close, after a completed session that ran from 30,670.00 to 31,065.50. The settle landed 37.00 points beneath the high.
The record belongs to the cash index. It closed at 30,732.40, up 250.05 points or 0.82 percent, after a record print at 30,770.63. The December contract set no such mark: its own 52-week high of 31,385.50 stands 320.00 points above Tuesday's 31,065.50 high and has not been exceeded, and every level in this outlook is measured on that contract. Beneath the headline the market split. The financial sector fell 2 percent, one large bank fell 3 percent, and the S&P 500 cash index closed unchanged at 7,764.64 while the Nasdaq-100 set its record, which is dispersion.
December Nasdaq-100 futures settled at 31,028.50 on 496,455 contracts, at 90.6 percent of a 395.50 point range and 107.17 points above the Pivot Point at 30,921.33. Two sessions have added 1,111.25 points, or 3.71 percent, since Friday's 29,917.25 settle. The raw stochastic reads 98.16 percent on the 9-day, 14-day and 20-day horizons at once, and the nearest moving average, the 5-day at 30,146.05, sits 882.45 points beneath the settle. Overhead: Tuesday's 31,065.50 high, Pivot R1 at 31,172.67 and the 31,316.83 to 31,385.50 band, where Pivot R2 meets the contract's own 52-week high. Support sits close. Beneath: the 30,921.33 pivot, Pivot S1 at 30,777.17 near Monday's settle, and the 30,663.00 to 30,670.00 pair at the session low. The primary setup is a long from 30,850 to 30,950, stop 30,660, targets 31,140, 31,380 and 31,620. The first-order event is the 09:45 AM ET United States flash composite survey, per the news-feed calendar and unconfirmed.
Tuesday's long traded 30 points into its band
Our Tuesday outlook set a long from 30,540 to 30,700 with a stop at 30,440 and targets at 30,863, 31,130 and 31,386. Tuesday opened at 30,780.00, above the band. The completed-session low printed 30,670.00, 30.00 points inside its upper edge. The 30,620 midpoint never traded; the low held 50.00 points above it. The stop sat 230.00 points under the low and was never touched.
No intraday series was captured, so the order of the high and the low is not asserted here. The settle resolves the first target anyway. At 31,028.50 it sits 165.50 points above 30,863, so whenever the band traded, price crossed the first target afterwards. The session high of 31,065.50 stopped 64.50 points short of the second target at 31,130 and 320.50 short of the third at 31,386. First target printed. The second and third did not.
Monday carried the heavy lifting. On 09/21 the contract opened at 29,938.00, ranged from 29,904.00 to 30,862.75 and closed at 30,784.75, a 958.75 point range and an 867.50 point advance in one session. Tuesday extended it on 395.50 points, 41.2 percent of Monday's travel. The low sat 110.00 points beneath the open and the high 285.50 points above it. A second-day continuation on less than half the prior range, closing at 90.6 percent of it, is a controlled extension; it does not carry the signature of an exhaustion bar.
Crude supplied the second leg. The November contract fell 2.00 percent to 90.52 and November Brent settled at 99.25, beneath the round 100 handle, which eased the inflation impulse and, by both the evening desk note's account and press commentary, supported risk appetite directly. The broad exchange-traded proxy for this index gained 0.8 percent. The Dow was reported down 0.36 percent, so this index outperformed the broad market by 0.82 percentage points and the Dow by 1.18. The one-month correlation index fell back beneath 8. Single names are trading on their own news.
A stochastic pinned at 98.16 on three horizons
The prior week, September 14 through September 18, spanned 29,993.25 to 29,053.00. Tuesday's settle sits 1,035.25 points above that entire range. Over two sessions the contract has gapped clear of it, and that is the single most important structural fact here. The provider's published five-day change, measured from the 09/15 settle of 29,246.75, is 1,781.75 points or 6.09 percent.
Seven closes tell it: 29,449.50, 29,246.75, 29,256.75, 29,743.00, 29,917.25, 30,784.75, then 31,028.50. From 09/17 through 09/22 each session printed a higher high and a higher low than the one before it, four in a row. The run is scoped to those four sessions. The preserved rows show a lower high on 09/15 at 29,495.25 beneath the 09/14 high of 29,604.50, and a lower low on 09/16 at 29,053.00 beneath the 09/15 low of 29,207.50.
Every average sits beneath price. The 5-day stands at 30,146.05, the 20-day at 29,770.88, the 50-day at 29,604.07, the 100-day at 29,824.19, the 200-day at 27,901.96 and the year-to-date average at 28,054.42. One irregularity survives. The 100-day sits 220.12 points above the 50-day, a mild inversion left over from the summer consolidation. Projected crossing prices for Wednesday are 29,888.84 on the 9-day, 29,781.27 on the 18-day and 29,722.63 on the 40-day, all more than 1,100 points under the settle. No average supports Wednesday's likely range, so the levels come from pivot arithmetic, standard deviations and Tuesday's extremes.
Momentum is at the ceiling. The raw stochastic reads 98.16 percent on the 9-day, 14-day and 20-day horizons, identical because the settle is at the top of each lookback window, and 98.97 percent on the 50-day. Smoothed lines read 93.19 percent on the 9-day and 14-day. Relative strength is less stretched: 75.18 on the 9-day and 67.41 on the 14-day, up 2.28 points, with the 14-day 70 line at 31,327.12, another 298.62 points higher. The 14-3 day raw stochastic 80 percent threshold sits at 30,663.00, only 7 points beneath the session low, so even a retest of that low would barely dent the reading.
Trend strength backs the move. The 9-day directional system carries positive direction at 36.72 against negative at 13.41, a spread of 23.31 and the widest of the four instruments covered this evening, with an index of 22.89. The 50-day and 100-day indices at 7.50 and 4.97 say the trend is young. The composite multi-indicator read is 72 percent buy with strength graded strong and direction graded strongest, and the short-horizon group is 100 percent buy on all five components. It read 64 percent sell one week ago. A market at 98 percent of its stochastic range with the strongest direction grade published offers no case for fading on the oscillator alone, and it has no cushion beneath it.
Tuesday's 395.50 point range came in beneath every average-true-range and average-daily-range measure captured, the nearest being the 20-day average daily range of 418.29, undershot by 22.79 points. The 14-day average true range is 473.42 points, or 1.53 percent. Open interest rose from 256,290 contracts on 09/18 to 287,421 on 09/21 in the published record. Fresh contracts arrived with the advance, the opposite of short covering closing it out.
Positioning thresholds 1,230 points below the cash close
The cash-index positioning stack sits far beneath the market. Its modeled volatility threshold is 29,450, its primary gamma concentration 29,500, its call-side ceiling 29,475 and its modeled gamma-flip level 29,503, all within 53 points of each other and all roughly 1,230 points beneath Tuesday's cash close of 30,732.40. None of the four is positioned to act on Wednesday's likely range. That observation covers those four fields only and does not show that hedging effects are absent. The same surface maps confluence levels at 30,848, 30,757, 30,635 and 30,421, three of them inside a plausible Wednesday band and 30,848 above the cash record, and no model output quantifying their effect was captured, so their influence is neither asserted nor ruled out.
Gamma tilt on the cash index reads 1.951, the highest of any symbol in the evening desk note's table, on gamma notional of only 17.665 million dollars. Put open interest of 103,897 contracts against call open interest of 74,015 completes that stack. The fund proxy tells a tighter story. It closed at 746.63 on 47,864,537 shares, above its 740 primary gamma concentration and 3.37 points beneath its 750 call-side ceiling, inside the band where positive dealer positioning damps movement. Next-expiry gamma there is 11.90 percent of the total, against 6.01 percent on the broad index and 4.02 percent on the bullion fund.
Flow tilted to the large names. The desk note recorded 3 billion dollars of positive delta on the large-capitalisation technology proxy, described as a record high, against 4 billion dollars positive on the broad index dominated by same-day expiries. The small-capitalisation proxy took 601 million dollars of net negative delta and sits roughly 6 percent beneath its August record, which the note puts down to higher rates pressing on small companies while large ones absorb them. Volatility sold off. The volatility index closed at 14.21, down 0.66 points or 4.44 percent, and the S&P 500 implied-volatility rank was put at 8 percent, near the lowest of the past year.
Rates are the headwind. The ten-year yield closed at 4.97 percent against 4.96 percent on Monday, within three basis points of 5 percent. A record in the longest-duration index against that yield says more about earnings expectations than about rates. Projections from the September 16 meeting showed 12 of 18 officials expecting one further 25 basis point increase this year. Tuesday's two-year note auction at 01:00 PM ET stopped at a 4.787 percent high yield with a 2.630 bid-to-cover, against a prior 4.204 percent and 2.600, a 58 basis point jump in the stop, per the news-feed calendar and unconfirmed. The September Richmond manufacturing survey fell 6 points to a seven-month low of minus 2.
Geopolitics leaned toward de-escalation and helped twice, through oil and through risk appetite. A news-agency report stamped 04:39 AM ET said Iran has proposed reopening the Strait of Hormuz within seven days if the United States lifts its blockade of Iranian ports, and later items recorded talks and a meeting through the afternoon; Iran's armed forces dismissed the remarks at 03:54 PM ET. All of it is unconfirmed reporting. The sharper risk sits on the chip leadership itself. A group of senators was reported at 03:05 PM ET arguing that one major economy's access to advanced chips should be ended, three days before a scheduled state visit on Thursday, per the news-feed calendar and unconfirmed. That is unconfirmed advocacy and is not policy. It is still the headline most capable of reversing the semiconductor leadership. The broad-index outlook covers the same session from the S&P 500 side.
The trade map for Wednesday
The primary setup is a long from 30,850 to 30,950 on a pullback toward the standard daily pivot at 30,921.33, which sits inside the band. The case rests on four readings. The short-horizon indicator group is a clean 100 percent buy, the nine-day directional spread of 36.72 against 13.41 is the widest of the four instruments covered, open interest rose with the advance, and the settle finished at 90.6 percent of a 395.50 point range. The stop at 30,660 sits beneath the completed session low of 30,670.00 and beneath the 14-3 day raw stochastic 80 percent threshold at 30,663.00. Targets step through the ladder at 31,140, 31,380 and 31,620.
Overhead the first test is close. Tuesday's 31,065.50 high is also the one-month and 13-week high, and structure above it is thin until Pivot R1 at 31,172.67. Then comes the grouping that matters most. Pivot R2 at 31,316.83 and the 14-day relative-strength 70 line at 31,327.12 sit roughly ten points apart, with the December contract's own 52-week high at 31,385.50 just above them. Further out sit the published target price at 31,470.72, Pivot R3 at 31,568.17 and the crossover stall at 31,604.61 immediately behind it. One standard deviation resistance at 31,768.82 marks the outer edge of a plausible single session.
Support starts at the pivot. The 30,921.33 Pivot Point sits 107.17 points under the settle, and Pivot S1 at 30,777.17 lands close to Monday's 30,784.75 settle. The group that matters most is 30,663.00 to 30,670.00, the stochastic threshold and Tuesday's low 7 points apart; losing it would be the first evidence of distribution in this move. That pair defines Wednesday's risk. Pivot S2 at 30,525.83 and S3 at 30,381.67 come in 144.16 points apart, with the 70 percent stochastic threshold at 30,461.75 and one standard deviation support at 30,288.18 interleaved. Deeper still, 29,975.38 to 29,989.75 around the round 30,000 level is the true structural support base for this advance.
Session by session the frame is tight. Globex is framed at roughly 30,940 to 31,120, bias mildly higher while 30,921.33 holds. The reopen has been quiet: it opened at 31,008.50, has traded between 30,997.50 and 31,059.25, and the last print of 31,058.00 stands 29.50 points above the settle. London carries roughly 30,900 to 31,150, with 31,065.50 deciding whether Europe extends the move or caps it. The morning is framed at 30,800 to 31,250 and the afternoon at 30,850 to 31,200. Across the full session the low-range case is 30,880 to 31,180, the mid-range and most likely case 30,800 to 31,280, and the high-range case 30,620 to 31,420.
Wednesday turns on one print. United States flash purchasing-manager surveys land at 09:45 AM ET, composite forecast 54.9 against a prior 56.0, services 55.9 against 56.5 and manufacturing 53.7 against 53.9, per the news-feed calendar and unconfirmed. The cash open at 09:30 AM ET comes first, so the open and the data arrive close together. A composite miss beneath 54.9 that softens the front end is the cleanest path through 31,172.67 toward the 31,316.83 to 31,385.50 band. An upside surprise that lifts the ten-year yield through 5 percent is the most direct threat. The afternoon adds a five-year note auction at 01:00 PM ET, prior high yield 4.393 percent and bid-to-cover 2.370, per the news-feed calendar and unconfirmed, and after Tuesday's 58 basis point two-year jump that stop is a live risk for duration.
The most probable path holds the overnight bid into the cash open, tests 31,065.50 from below or just above in the first hour, and then takes direction from the composite survey. The weighting favours an extension attempt over a reversal. A failure at 31,172.67 followed by a close beneath 30,921.33 would be the shape of the first distribution day of this move, and a loss of 30,670.00 would end the extension read outright and put the round 30,000 band in play over subsequent sessions. These weightings are analyst judgment and carry no derived frequency.
Leadership this narrow holds an index up only as long as the chips do.
The complete data picture
Every number behind Wednesday’s plan, charted first, then the full level map, then the complete numeric reference underneath.
No cash-index pairs are listed beside these levels: the session review publishes its cash positioning levels in cash terms only and gives no futures translation, so none is stated here.
Full numeric reference, every remaining figure from the session review
3.1 Resistance, level by level
31,065.50 is Tuesday's session high, simultaneously the one-month and 13-week high, and therefore the only level that matters on the first attempt. Above it the structure is thin until Pivot R1.
31,172.67 is Pivot R1, the first standard pivot resistance; Target 1 at 31,140 sits just beneath it.
31,316.83 is Pivot R2 and 31,327.12 is the 14-day relative-strength 70 percent line, a pair roughly ten points apart, and the contract's own 52-week high at 31,385.50 sits just above them. The 31,316.83 to 31,385.50 band is the most consequential overhead grouping in the instrument, because it combines computed resistance with the December contract's own 52-week high. Target 2 at 31,380 sits immediately beneath that high.
31,470.72 is the provider's published target price for Wednesday.
31,568.17 is Pivot R3, with the three-and-ten day moving-average crossover stall at 31,604.61 immediately behind it; Target 3 at 31,620 sits above both.
31,768.82 is one standard deviation resistance, the outer edge of a plausible single session. The two and three deviation bands at 32,075.47 and 32,310.78 are structural references outside a tradeable band this week.
3.2 Support, level by level
30,921.33 is the Pivot Point, 107.17 points beneath the settle and the level that separates a constructive Wednesday from a rotation. It sits inside the 30,850 to 30,950 entry zone.
30,777.17 is Pivot S1, the second line, and it sits close to Monday's 30,784.75 settle, a genuine confluence of computed support with the prior session's close.
30,663.00 to 30,670.00 is the group that matters most: the 14-3 day raw stochastic 80 percent threshold and Tuesday's completed-session low sit 7 points apart. A loss of it would be the first evidence that the move is being distributed. The stop at 30,660 sits beneath both.
30,525.83 is Pivot S2 and 30,381.67 is Pivot S3, 144.16 points apart, with the 14-3 day raw stochastic 70 percent threshold at 30,461.75 and one standard deviation support at 30,288.18 interleaved.
30,146.05 is the 5-day average, the first moving average of any kind beneath price, 882.45 points from the settle.
29,981.53 is two standard deviations support, 29,975.38 the stall level on the 14-day stochastic and 29,989.75 the 18-day average crossing stall. Together they form a dense band around the round 30,000 level, and that band is the true structural support base for this advance. The 38.2 percent retracement from the four-week high at 30,296.72 sits above it.
1. Executive Summary
The December Nasdaq-100 contract settled at 31,028.50 on Tuesday, up 243.75 points or 0.79 percent from Monday's 30,784.75 close, and the cash index it tracks closed at 30,732.40, up 250.05 points or 0.82 percent, at a record. The completed session ran 31,065.50 to 30,670.00, a 395.50 point band, and the settle finished at 90.6 percent of that range, about as strong a close by position as a session produces. Volume printed 496,455 contracts. The two sessions since Friday's 29,917.25 settle have added 1,111.25 points, or 3.71 percent, and the provider's published five-day change, measured from the 09/15 settle of 29,246.75, is 1,781.75 points or 6.09 percent.
The driver was semiconductors and the oil price, in that order. Press commentary put the semiconductor complex up 2 percent and memory names up 3 percent on the day, with two memory issuers cited up 5 and 7 percent respectively, while the broad exchange-traded proxy for this index gained 0.8 percent. Underneath it the financial sector fell 2 percent and one large bank fell 3 percent, so the session was a rotation into offence and the advance was narrow. The second leg was crude: the November contract fell 2.00 percent to 90.52 and the November Brent contract settled beneath the round 100 handle, which eased the inflation impulse and, by both the desk note's account and press commentary, supported risk appetite directly. The S&P 500 cash index closed unchanged at 7,764.64 while this index made a record, and that pattern is dispersion.
The structural contradiction is between momentum and extension. The composite multi-indicator read is 72 percent buy with strength graded strong and direction graded strongest, and the short-horizon indicator group is a clean 100 percent buy. The nine-day directional system carries positive direction at 36.72 against negative direction at 13.41, the widest spread of the four instruments covered this evening. Against that, the raw stochastic reads 98.16 percent on the 9-day, 14-day and 20-day horizons simultaneously, which means the contract is closing at the top of every lookback window it has, and the 14-day relative-strength reading of 67.41 is approaching but has not reached an extreme.
The Primary Setup is a long from the 30,850 to 30,950 band on a pullback toward the standard daily pivot at 30,921.33, stopped beneath Tuesday's session low, targeting the first standard pivot resistance at 31,172.67, the contract's own 52-week high at 31,385.50 and then the third standard pivot resistance at 31,568.17.
2.1 Intraday and Session Review
The completed Tuesday session opened at 30,780.00, a fraction beneath Monday's 30,784.75 settle, marked a low of 30,670.00 and a high of 31,065.50, and settled at 31,028.50. No intraday series was captured this run, so the order in which those extremes were reached is not asserted and no path claim appears anywhere in this outlook. What the bar establishes is the asymmetry: the low sat 110.00 points beneath the open and the high 285.50 points above it, and the settle finished 37.00 points beneath the high.
These session extremes are the completed-session inputs behind the published pivot ladder and were not independently read from a bar. They were back-solved from the outer pivot pairs and verified twice: the third resistance point at 31,568.17 minus the third support point at 30,381.67 divided by three, and the second resistance point at 31,316.83 minus the second support point at 30,525.83 divided by two, both return 395.50. Adding three times the pivot point at 30,921.33 and subtracting the settle gives a high-plus-low sum of 61,735.49, and the resulting pair of 31,065.50 and 30,670.00 reproduces all seven published rungs.
Two corroborations exist, both from the same vendor on different surfaces and neither from an independent source: the provider's own published daily record returns 30,780.00, 31,065.50, 30,670.00, 31,028.50 on 496,455 contracts, and the provider separately publishes 31,065.50 as both the one-month high and the 13-week high, which can only be Tuesday's print. They confirm internal consistency; they do not establish the authenticity of the underlying quote.
Close quality was excellent. A settle at 90.6 percent of a 395.50 point range, 37 points beneath the session high, with the cash index at a record, is a session that buyers finished in control of without a late fade. The 30,670.00 low is the number that defines Wednesday's risk.
2.2 Daily Structure
The prior week, September 14 through September 18, spanned 29,993.25 at the high and 29,053.00 at the low. Tuesday's settle at 31,028.50 sits 1,035.25 points above the entire prior weekly range, the single most important structural fact in this instrument: over two sessions the contract has gapped clear of that range entirely.
For the quarterly reference the 13-week extremes serve as the available proxy, because no prior-quarter high or low was captured this run. The 13-week high stands at 31,065.50, which is Tuesday's own print, and the 13-week low at 27,482.00. The 52-week high is 31,385.50 and the 52-week low 23,429.00, with the last price 1.14 percent beneath the 52-week high and 32.44 percent above the 52-week low.
That 52-week high deserves precision, because the headline and the contract disagree. The cash index made a record on Tuesday at 30,770.63. The December futures contract did not: its own 52-week high of 31,385.50 sits 320.00 points above Tuesday's 31,065.50 high and has not been exceeded. Anyone reading the record-high headline straight into the futures contract is 320 points out, and that distinction governs every level in section 3.
The 20-day average at 29,770.88 sits 1,257.62 points beneath the settle. There is no medium-horizon average interaction to discuss in this instrument; price has left them all behind.
2.3 4-Hour and Swing Structure
The seven-session closing sequence from the published record reads 29,449.50, then 29,246.75, then 29,256.75, then 29,743.00, then 29,917.25, then 30,784.75, then 31,028.50. The break happened on 09/21, when the contract opened at 29,938.00, ranged between a 30,862.75 high and a 29,904.00 low, and closed at 30,784.75, a 958.75 point range and an 867.50 point advance in a single session. Tuesday extended it with a 395.50 point range, which is 41.2 percent of Monday's travel, so the second session of the move was materially narrower than the first.
That narrowing is the swing-structure observation that matters. A second-day continuation on less than half the prior day's range, closing at 90.6 percent of that range, is a controlled extension and does not carry the signature of an exhaustion bar. From 09/17 through 09/22 each session printed a higher high and a higher low than the session before it, four in a row. That run is scoped to those four sessions, because the preserved rows show a lower high on 09/15 at 29,495.25 beneath the 09/14 high of 29,604.50 and a lower low on 09/16 at 29,053.00 beneath the 09/15 low of 29,207.50.
The retracement grid published for Wednesday places the 38.2 percent retracement from the four-week high at 30,296.72 and the 50 percent retracement of the four-week range at 30,059.25. Both sit far beneath the settle, which is the arithmetic way of saying there is no nearby retracement shelf; the first structural catch beneath the session low is the pivot ladder itself.
2.4 Moving Averages
Every average in the stack sits beneath price and the stack is in correct ascending order on the short end. The 5-day average stands at 30,146.05, the 20-day at 29,770.88, the 50-day at 29,604.07, the 100-day at 29,824.19, the 200-day at 27,901.96 and the year-to-date average at 28,054.42. Tuesday's settle sits 882.45 points above the 5-day, 1,257.62 above the 20-day, 1,424.43 above the 50-day, 1,204.31 above the 100-day and 3,126.54 above the 200-day.
The one irregularity is that the 100-day average at 29,824.19 sits 220.12 points above the 50-day at 29,604.07, a mild inversion left over from the summer consolidation. The projection grid gives Wednesday crossing prices of 29,888.84 for the 9-day, 29,781.27 for the 18-day and 29,722.63 for the 40-day, all more than 1,100 points beneath the settle. No moving average provides support anywhere near Wednesday's likely range, and the level structure comes entirely from pivot arithmetic, standard deviations and the prior session's extremes.
2.5 Oscillator and Trend Readings
Relative strength reads 75.18 on the 9-day, 67.41 on the 14-day, 62.25 on the 20-day, 56.17 on the 50-day and 55.16 on the 100-day, with the 14-day reading up 2.28 points on the session. The published grid places the 14-day relative-strength 70 percent line at 31,327.12, so the contract would need another 298.62 points to register a conventional overbought reading on that measure.
Stochastics are at the ceiling. The raw stochastic reads 98.16 percent on the 9-day, the 14-day and the 20-day horizons, identical across all three because the settle is at the top of each lookback window, and 98.97 percent on the 50-day. The smoothed lines read 93.19 percent on the 9-day and 14-day, 91.89 percent on the 20-day and 91.33 percent on the 50-day, with signal lines between 76.11 and 80.69 percent. The published grid puts the 14-3 day raw stochastic 80 percent threshold at 30,663.00, only 7 points beneath Tuesday's session low, which means even a retest of the session low would barely dent the reading.
The directional system is the strongest of the four instruments. The 9-day index reads 22.89 with positive direction at 36.72 against negative at 13.41, a spread of 23.31. The 14-day index reads 15.58 with positive at 30.48 against negative at 16.62. The 20-day reads 12.97 with positive at 26.80 against negative at 18.73. The 50-day and 100-day indices at 7.50 and 4.97 show the trend is young, with direction pairs nearly level on those horizons. Historic volatility reads 18.59 percent on the 9-day against 15.87 percent on the 14-day and 15.55 percent on the 20-day, so realised volatility is expanding at the short end.
The composite multi-indicator read published for Wednesday is 72 percent buy, with strength graded strong and direction graded strongest, and the composite indicator itself reads buy. Underneath it the short-horizon group is 100 percent buy on all five components, the medium-horizon group 50 percent buy with the 20 to 100 day crossover the one dissent, and the long-horizon group 33 percent buy with both long crossovers still reading sell. The prior readings were 72 percent buy at Monday's close, 64 percent sell one week ago and hold one month ago. A move from 64 percent sell to 72 percent buy in five sessions is the mirror image of what crude did over the same window.
2.6 Volatility and Expected Range
The 14-day average true range stands at 473.42 points, or 1.53 percent, with a 14-day average daily range of 437.73 points, or 1.41 percent. The 9-day average true range is 474.06 with a 9-day average daily range of 495.25, the 20-day average true range 488.85 and the 50-day 514.37. Tuesday's realised 395.50 point range therefore came in beneath every average-true-range and average-daily-range measure captured, the nearest being the 20-day average daily range of 418.29, which it undershot by 22.79 points.
A one-range projection from the 31,028.50 settle using the 14-day average true range of 473.42 points frames Wednesday between roughly 30,555.08 and 31,501.92. The published standard-deviation bands run 30,288.18 to 31,768.82 at one deviation, 29,981.53 to 32,075.47 at two and 29,746.22 to 32,310.78 at three. The one-deviation band is materially wider than the average true range on both sides, which is what a five-session closing series containing an 867.50 point day does to a standard deviation.
4.1 Mag7 Earnings and AI Capex Cycle
No mega-cap earnings were reported on Tuesday and none is scheduled after Wednesday's close on the captured calendar; the nearest large-cap report on the forward calendar is Thursday at 05:00 PM ET. The session's mega-cap news flow was product and partnership news, with no results. A large-cap chipmaker launched two flagship mobile platforms at 04:04 PM ET, a hardware maker introduced refreshed desktop computers with new silicon, a large-cap artificial-intelligence developer announced an expansion of its model family at 02:20 PM ET, and a rival laboratory announced a new model tier the same day. A payments company and a social-media platform announced a checkout partnership at 11:20 AM ET, and the same platform was reported at 11:59 AM ET to be testing a human concierge layer for its personal agent.
The policy dimension of the capital-expenditure cycle also moved. Remarks from the United Nations rostrum at 11:01 AM and 11:03 AM ET rejected an international scheme to govern artificial intelligence and characterised warnings about the technology as overstated, and a press report at 01:58 PM ET named a senior Treasury official as a candidate for an artificial-intelligence coordination role. A Federal Reserve official noted at 12:52 PM ET that there is momentum outside data centres and artificial intelligence, with consumer spending holding up and strength in defence and manufacturing, the first policy-side acknowledgement in this run that the expansion is broader than the capital-expenditure theme.
4.2 Semiconductor Cycle and Tech Sector Rotation
This is the driver of record. Press commentary put the semiconductor complex up 2 percent and memory names up 3 percent, with one memory issuer up 5 percent and another up 7 percent, and attributed the record in the cash index directly to that leadership. The desk note recorded the same, describing continued bullish flow in artificial-intelligence-related names with memory issuers leading.
Rotation was the other half. The financial sector fell 2 percent on the day and one large bank fell 3 percent, described as capital moving out of defensive sectors and into offensive ones. The dispersion this produced is measurable: the one-month correlation index fell back beneath 8, which means single names are moving on their own news more than on the index. A low correlation reading supports the index only while the leadership holds; it is also what makes a leadership reversal expensive.
One policy risk sits directly on this driver. A group of senators was reported at 03:05 PM ET arguing that access to advanced chips for one major economy should be ended. That is unconfirmed advocacy and is not policy. It is still the specific headline most capable of reversing the semiconductor leadership, and it lands three days before a scheduled state visit on Thursday, per the news-feed calendar and unconfirmed.
4.3 Fed Policy and Real Yields (Duration Sensitivity)
The ten-year yield closed at 4.97 percent against 4.96 percent on Monday, having traded 4.93 to 4.98. A nominal yield within three basis points of 5 percent is the structural headwind for the longest-duration index in the complex, and a record in this index against it says more about earnings expectations than about rates.
Policy commentary leaned hawkish. Officials were reported describing an increased likelihood of inflation remaining notably above 2 percent and warning it could take time to settle. The projection material from the September 16 meeting, reported at 02:00 PM ET that day, showed 12 of 18 officials expecting one further 25 basis point increase this year, four expecting two and two expecting none. Against that, the September Richmond manufacturing survey fell 6 points to a seven-month low of minus 2 against an expectation of 2. A two-year note auction on Tuesday at 01:00 PM ET stopped at a 4.787 percent high yield with a 2.630 bid-to-cover, against a prior 4.204 percent and 2.600, and that 58 basis point jump in the auction stop is the clearest single indication in this run of how far front-end pricing has moved, per the news-feed calendar and unconfirmed.
New York Federal Reserve officials spoke on money-market plumbing at 04:25 PM and 04:26 PM ET, describing reserve-management purchases as not on a pre-set course and saying central clearing of repurchase operations would have benefits. That is technical commentary with no directional content.
4.4 Geopolitical Backdrop
The geopolitical direction on Tuesday was toward de-escalation and it helped this index twice, once through the oil price and once through risk appetite. A news-agency report stamped 04:39 AM ET said Iran has proposed reopening the Strait of Hormuz within seven days if the United States lifts its blockade of Iranian ports. A 01:52 PM ET item recorded a statement that United States officials had met an Iranian delegation for three hours, a 03:24 PM ET item reported a meeting between Iran's foreign minister and a United States envoy, and rostrum remarks between 03:32 PM and 03:41 PM ET spoke of momentum toward a deal. Iran's armed forces dismissed the remarks at 03:54 PM ET. All of it is unconfirmed reporting and none of it is settled fact.
The second thread is trade. A state visit is scheduled for Thursday, and investment-bank commentary read it as likely to reinforce a managed-competition framework and unlikely to produce a reset, per the news-feed calendar and unconfirmed. A social-media chief executive was reported at 02:45 PM ET as planning to attend the associated dinner. For a semiconductor-led index the trade thread carries more asymmetry than the energy thread, because export policy affects the leadership directly.
4.5 Cross-Asset and Volatility
The volatility index closed at 14.21, down 0.66 points or 4.44 percent, after a 14.19 to 14.95 session, and the desk note recorded the volatility-of-volatility measure closing at 83.17, down 3 percent. Fixed-strike volatility was described as falling roughly one point across the board, and the S&P 500 implied-volatility rank was put at 8 percent, near the lowest of the past year.
The dollar index closed at 100.601, up 0.17 percent at a seven-week high. The November crude contract settled at 90.52, down 2.00 percent, and the November Brent contract at 99.25. Gold's December contract settled at 4,376.4, down 0.17 percent. The S&P 500 cash index closed unchanged at 7,764.64 and the Dow was reported down 0.36 percent, so this index outperformed the broad market by 0.82 percentage points and the Dow by 1.18 percentage points on the session.
The small-capitalisation contrast is the sharpest cross-asset signal available. The desk note recorded the small-capitalisation proxy taking 601 million dollars of net negative delta while the large-capitalisation technology proxy took 3 billion dollars positive, and placed the small-capitalisation index roughly 6 percent beneath its August record. The stated explanation is the higher-rate environment pressing on small companies while large ones absorb it.
4.6 Institutional Positioning
No commitment-of-traders report was captured for this contract this run, so speculative positioning in the futures itself is not asserted. Open interest stands at 287,421 contracts, having risen from 256,290 on 09/18 through 287,421 on 09/21 in the published record, which is fresh open interest arriving alongside the advance, the opposite of short covering closing it out.
The positioning evidence that does exist comes from the options proxy in section 5 and from the desk note's flow record: a 3 billion dollar positive delta day on the large-capitalisation technology proxy, described as reaching a record high, against 4 billion dollars positive on the broad index dominated by same-day expiries. The asymmetry between a same-day-driven broad index and a proxy whose flow was longer-dated is the positioning fact most relevant to Wednesday.
5. Options Flow Context (Proxy)
The large-capitalisation technology exchange-traded fund is this instrument's flow proxy and not its primary surface, and every figure here is a cash-equity level that carries no futures basis. Nothing in the level lists originates in this section.
The proxy closed at 746.63 on 47,864,537 shares, with a 52-week high of 748.64 that is consistent with an intraday record and a close slightly beneath it. The desk note's reference price of 741 is the prior session's close, verified by the arithmetic: 741 multiplied by the stated 0.8 percent gain returns 746.9, which reconciles with the 746.63 close, and the same test on the cash index reference of 30,482 against a 0.82 percent gain returns 30,732, matching the published cash close of 30,732.40 to within a point.
On the proxy the dealer-positioning stack reads a modeled volatility threshold at 738, a primary gamma concentration at 740, a call-side ceiling at 750 and a put-side base at 700, with a modeled gamma-flip level at 734. Gamma tilt is 1.265 and gamma notional 475.825 million dollars. The 25-delta risk reversal is flat at 0.00. Call volume was 1.92 million against put volume 2.139 million, and call open interest 5.061 million against put open interest 6.994 million. The key mapped strikes are 740, 730, 750 and 720, and the mapped confluence levels are 725.06, 730.11, 720.01 and 699.81.
The configuration is the important part. The proxy closed at 746.63, which is above its primary gamma concentration at 740 and beneath its call-side ceiling at 750, so it spent Tuesday inside the band where positive dealer positioning damps movement, and it finished 3.37 points short of the ceiling. The options surface separately shows call gamma at minus 537 million and put gamma at minus 2.5 billion, with next-expiry gamma at 11.90 percent of the total, against 6.01 percent on the broad index and 4.02 percent on the bullion fund.
The cash-index stack tells a more striking story. Its modeled volatility threshold is 29,450, its primary gamma concentration 29,500, its call-side ceiling 29,475 and its modeled gamma-flip level 29,503, all within 53 points of each other and all roughly 1,230 points beneath Tuesday's cash close of 30,732.40. Gamma tilt on the cash index is 1.951, the highest of any symbol in the desk note's table, on gamma notional of only 17.665 million dollars. Put open interest of 103,897 contracts against call open interest of 74,015 completes it.
The practical reading is narrower than it first appears. The model's principal thresholds sit far beneath spot, so none of them is positioned to act on Wednesday's likely range. That observation covers those four fields only and does not demonstrate that hedging effects are absent, because the same surface publishes mapped confluence levels at 30,848, 30,757, 30,635 and 30,421, three of which sit inside a plausible Wednesday band and one of which, 30,848, sits above the cash record. No model output quantifying the effect of those nearer levels was captured this run, so their influence is neither asserted nor ruled out.
Night Session (6:00 PM ET Tuesday to 3:00 AM ET Wednesday, Globex and Asia)
The Globex reopen has been quiet and constructive. The new session opened at 31,008.50, has traded between 30,997.50 and 31,059.25, and the last print of 31,058.00 stands 29.50 points above Tuesday's settle, so the contract is holding its close within the top of Tuesday's range.
Australian flash purchasing-manager surveys print at 07:00 PM ET, per the news-feed calendar and unconfirmed. The captured calendar places the Japanese flash surveys in Wednesday evening's block and not in tonight's, per the news-feed calendar and unconfirmed. Asian semiconductor trade is the transmission channel that matters in this window. Bias mildly higher while 30,921.33 holds, expected Globex band roughly 30,940 to 31,120.
London Session (3:00 AM to 8:00 AM ET Wednesday)
European flash purchasing-manager surveys run from 03:15 AM ET for France, 03:30 AM ET for Germany with manufacturing forecast at 54.0, 04:00 AM ET for the eurozone aggregate with the composite forecast at 51.7 against a prior 52.0, and 04:30 AM ET for the United Kingdom. European Central Bank speakers appear at 03:00 AM and 04:50 AM ET.
For a technology index the European window matters mainly through the dollar and through European semiconductor names. Bias neutral with an upward lean, expected band roughly 30,900 to 31,150, with 31,065.50 the level that defines whether Europe extends the move or caps it.
Morning Session (9:30 AM to 12:00 PM ET Wednesday, RTH Open)
United States flash purchasing-manager surveys print at 09:45 AM ET, composite forecast 54.9 against a prior 56.0, services 55.9 against 56.5 and manufacturing 53.7 against 53.9, per the news-feed calendar and unconfirmed. A Federal Reserve governor speaks at 10:05 AM ET on housing and a Bank of England deputy at 10:00 AM ET.
The cash open at 09:30 AM ET sets the session's first directional test, and the survey lands shortly after it, so the open and the data arrive close together. A composite miss beneath 54.9 that softens the front end is the cleanest path through 31,172.67 toward the 31,316.83 to 31,385.50 band; an upside surprise that lifts the ten-year yield through 5 percent is the most direct threat to a record-priced duration index. Expected band roughly 30,800 to 31,250.
Afternoon Session (12:00 PM to 4:00 PM ET Wednesday)
The afternoon carries European Central Bank speakers at 12:00 PM and 12:30 PM ET and a five-year note auction at 01:00 PM ET, where the prior auction stopped at a 4.393 percent high yield with a 2.370 bid-to-cover, per the news-feed calendar and unconfirmed. Tuesday's two-year auction stopped 58 basis points above its prior, so the five-year stop is a live risk for duration and no formality, per the news-feed calendar and unconfirmed.
With next-expiry gamma at 11.90 percent on the proxy, same-day expiry flow is a meaningful share of the surface into the close. Expected band roughly 30,850 to 31,200.
Night Session Forward (6:00 PM ET Wednesday)
Residual bias into the Wednesday evening reopen depends on whether 31,065.50 was cleared and held during the United States session. Japanese flash surveys at 08:30 PM ET and Australian labour data at 09:30 PM ET, with the unemployment rate forecast at 4.5 percent, provide the overnight texture.
The larger forward anchor is Thursday, carrying jobless claims at 08:30 AM ET with a consensus of 200,000 against a prior 196,000, new home sales at 10:00 AM ET, a seven-year note auction at 01:00 PM ET, a large-cap retailer's results after the close at 05:00 PM ET, and a state visit running all day whose trade content bears directly on the semiconductor leadership, per the news-feed calendar and unconfirmed.
Expected Range (Wednesday Full Session)
Low-range scenario: 30,880 to 31,180
Mid-range scenario (most likely): 30,800 to 31,280
High-range scenario: 30,620 to 31,420
Most Likely Path
The most probable path holds the overnight bid into the cash open at 09:30 AM ET, tests 31,065.50 from below or just above in the first hour, and then takes direction from the 09:45 AM ET composite survey. The weighting favours an extension attempt over a reversal, because the short-horizon indicator group is a clean 100 percent buy, the directional spread is the widest of the four instruments covered, and fresh open interest arrived with the advance.
The constraint is that the raw stochastic is at 98.16 percent on three horizons at once, so a failure at 31,172.67 followed by a close beneath 30,921.33 would be the shape of the first distribution day of this move. A loss of 30,670.00 would end the extension read outright and put the round 30,000 band in play over subsequent sessions. These weightings are analyst judgment and carry no derived frequency.
7. Wednesday Economic Calendar
The overnight block opens with Australian flash purchasing-manager surveys at 07:00 PM ET Tuesday, prior readings 52.0 manufacturing and 52.7 composite, while the captured calendar places the Japanese flash surveys at 08:30 PM ET, prior manufacturing 54.9 and composite 53.5, and the Australian labour data at 09:30 PM ET, unemployment forecast 4.5 percent and employment change 20,000 against a prior decline of 15,800, in Wednesday evening's block and not in Tuesday's, per the news-feed calendar and unconfirmed.
The European morning carries a European Central Bank speaker at 03:00 AM ET, French flash surveys at 03:15 AM ET, German flash surveys at 03:30 AM ET with manufacturing forecast at 54.0 against a prior 54.3, the eurozone aggregate at 04:00 AM ET with the composite forecast at 51.7 against a prior 52.0, United Kingdom flash surveys at 04:30 AM ET with the composite forecast at 52.0 against a prior 52.5, and a further European Central Bank speaker at 04:50 AM ET.
The United States morning opens with flash purchasing-manager surveys at 09:45 AM ET, composite forecast 54.9 against a prior 56.0, services 55.9 against 56.5 and manufacturing 53.7 against 53.9, per the news-feed calendar and unconfirmed. A Bank of England deputy speaks at 10:00 AM ET and a Federal Reserve governor at 10:05 AM ET on housing. The weekly petroleum status report lands at 10:30 AM ET on Wednesday and matters to this index only through the energy-price channel that supported it on Tuesday. The afternoon carries European Central Bank speakers at 12:00 PM and 12:30 PM ET and a five-year note auction at 01:00 PM ET, prior high yield 4.393 percent, prior bid-to-cover 2.370, per the news-feed calendar and unconfirmed.
The single first-order event for this index is the 09:45 AM ET United States flash composite survey, because it is the only Wednesday release capable of moving the ten-year yield, and a record-priced long-duration index is more exposed to that yield than to anything else on the schedule. No mega-cap earnings are scheduled after Wednesday's close on the captured calendar, and no structural expiry falls on Wednesday; the monthly option expiry passed on September 18 and the next volatility-index expiry is in October. The next first-order grouping is Thursday, with jobless claims at 08:30 AM ET, new home sales at 10:00 AM ET, a seven-year note auction at 01:00 PM ET, a large-cap retailer reporting at 05:00 PM ET and an all-day state visit, per the news-feed calendar and unconfirmed.
8. Primary Trade Setup
Direction: Long
Rationale: The short-horizon indicator group reads a clean 100 percent buy, the nine-day directional spread of positive 36.72 against negative 13.41 is the widest of the four instruments covered this evening, open interest rose with the advance, and the settle finished at 90.6 percent of a 395.50 point range, so a pullback toward the standard daily pivot at 30,921.33 offers a long inside an intact trend.
Entry Zone: 30,850 to 30,950
Stop Loss: 30,660 (below the completed session low of 30,670.00, which is also below the 14-3 day raw stochastic 80 percent threshold at 30,663.00)
Target 1 (T1): 31,140 (approaching the first standard pivot resistance at 31,172.67)
Target 2 (T2): 31,380 (immediately beneath the contract's own 52-week high at 31,385.50 and above the second standard pivot resistance at 31,316.83)
Target 3 (T3, extended): 31,620 (above the third standard pivot resistance at 31,568.17 and at the three-and-ten day moving-average crossover stall at 31,604.61)
Risk-to-Reward: Approximately 1:1 to T1, 1:2 to T2, 1:3 to T3, measured from the 30,900 midpoint of the entry zone against the 30,660 stop, which is 240 points of risk.
Invalidation: A settle beneath 30,670.00 negates the thesis, and a close beneath the Pivot Point at 30,921.33 after a failure at 31,172.67 removes the edge before the stop is reached, because that sequence has the shape of a distribution day.
Macro override: A hot United States flash composite survey at 09:45 AM ET that lifts the ten-year yield through 5 percent would press directly on the longest-duration index in the complex and invalidate the long in real time. The second override is export policy: the senators' argument reported at 03:05 PM ET on Tuesday for ending one major economy's access to advanced chips, if it moved from advocacy toward action ahead of Thursday's state visit, would strike the semiconductor leadership this entire advance rests on.
Sources and methodology
This outlook is built from our session review of the December E-mini Nasdaq-100 contract, NQZ26, the December ’26 contract, prepared after Tuesday's close on September 22, 2026 for the Wednesday, September 23 session. The contract domain was checked before any level was used: the chart last of 31,058.00 less its stated change of 29.50 returns 31,028.50, equal to the provider's published previous close, and the chart's open of 31,008.50 and low of 30,997.50 equal the provider's published open and low for the new session. The day high, day low and open shown for the new Globex session belong to the session dated September 23 and are never presented as Tuesday's range.
The completed session is recovered from the published pivot ladder: the outer pivot pairs both give a 395.50 point range, and solving against the 30,921.33 Pivot Point and the 31,028.50 settle returns the 31,065.50 high and the 30,670.00 low that reproduce all seven published levels, with the provider's own daily record and its one-month and 13-week high as same-vendor corroboration. No intraday series, no commitment-of-traders report and no prior-quarter high or low were captured in this run, so none is stated. The record high belongs to the cash index and the December contract's 52-week high of 31,385.50 remains above Tuesday's high. The exchange-traded fund and the cash index are flow proxies, their levels are quoted in their own domains and no level in the lists above originates in either. Scenario ranges, session windows and path weightings are analyst judgment and carry no calibration. Scheduled items marked unconfirmed come from the news-feed calendar captured for this run.
Tuesday’s outlook for this contract is here and the broad-index outlook for the same date is here. Outlooks for ES, NQ, GC and CL are collected on the market outlook page, and our forward trading record is on the performance statement.



