
At Tuesday's close the S&P 500 cash index had moved six hundredths of a point. It finished at 7,764.64 against 7,764.70. Underneath, the market was anything but still. The Nasdaq-100 cash index closed up 0.82 percent at a record, the Dow was reported down 0.36 percent, semiconductors gained 2 percent and memory names 3 percent, while the financial sector fell 2 percent with one large bank down 3 percent. Two big blocks moved 2 percent in opposite directions. The index netted them to zero.
December E-mini futures settled at 7,831.75, down 1.75 points or 0.02 percent from Monday's 7,833.50, after a completed session from 7,810.50 to 7,848.50. That 38.00 point band was 49.3 percent of the 14-day average true range of 77.02 points, and the settle landed at 55.9 percent of it on 1,260,077 contracts. The cash index traded 7,756.26 to 7,782.19, a 25.93 point range worth 33.4 basis points of the index level. It closed at 32.3 percent of that range. The settle sits 1.50 points above the 7,830.25 pivot. No cushion either way.
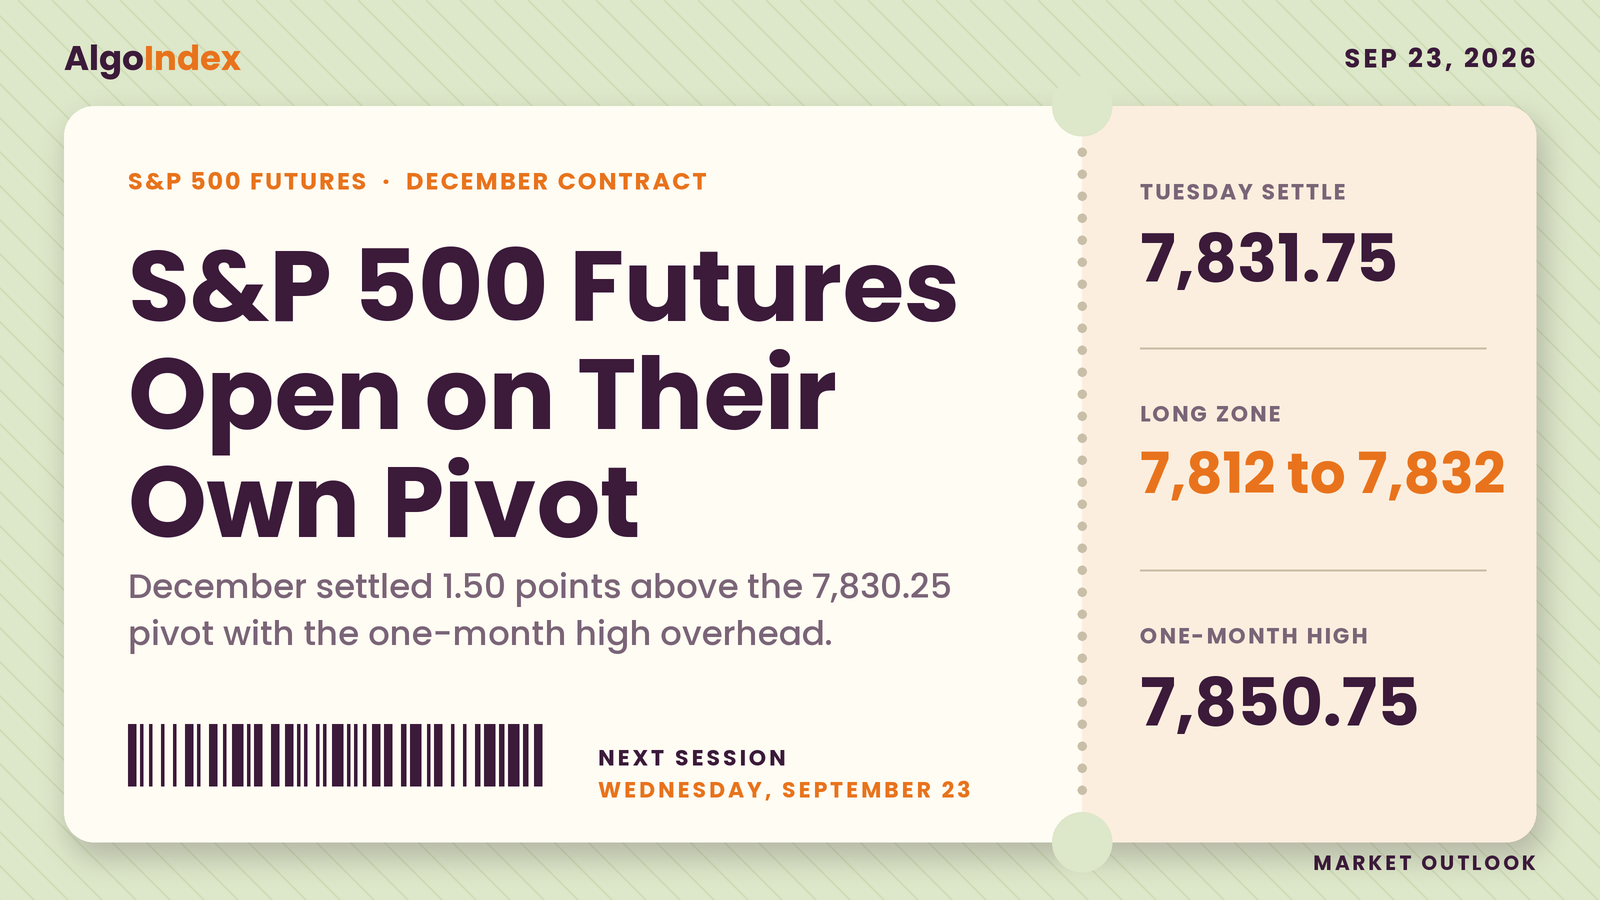
December S&P 500 futures settled at 7,831.75, 1.50 points above the 7,830.25 pivot and 73.25 points under the 7,905.00 annual high. Resistance begins with a 2.25 point barrier: Tuesday's 7,848.50 high, the 7,850.00 first pivot resistance and the 7,850.75 one-month high. Above it sit 7,868.25, the call-side ceiling pair at 7,867.70 (cash 7,800) and the 7,876.54 to 7,888.00 band. Support starts at the 7,810.50 to 7,812.00 pair and thickens at 7,741.38 to 7,750.73, where two averages, a retracement, a crossing and the 1 standard deviation band sit inside 9.35 points. The primary setup is a long from 7,812 to 7,832, stop 7,792, targets 7,852, 7,882 and 7,912. Positioning leans constructive: roughly 8 billion dollars of index delta swung from negative to positive into the close, and the implied-volatility rank sits at 8 percent.
The long that never filled
Tuesday's outlook set a long from 7,770 to 7,800, stop 7,735, targets 7,847, 7,883 and 7,932. Tuesday's completed session ran 7,810.50 to 7,848.50. The low never reached the zone. It stopped 10.50 points above the 7,800 top edge, so the long never filled and the card produced no trade. The session high did print 1.50 points above the 7,847 first target, which counts for nothing without an entry. The 7,735 stop sat 75.50 points beneath the session low and was never in play.
The range call fared better. We wrote that a narrower Tuesday was the base expectation after Monday's 133.50 point span, and it came in at 38.00 points. The whole session sat inside the 7,805 to 7,870 low-range case we published. The 7,831.75 settle landed inside 7,810 to 7,865, the band we gave as the most likely settlement. Right on the size of the day, too deep on the entry.
Tuesday's extremes are the completed-session inputs behind the published pivot ladder, back-solved from the outer pivot pairs and matched by the provider's daily record of 7,830.00, 7,848.50, 7,810.50 and 7,831.75. No timestamp-aligned price and flow series was captured, so the order of the high and the low is not established here. The miss needs no sequence to read.
What the session did establish is a pause. Monday travelled 7,713.75 to 7,847.25 and advanced 121.00 points to close at 7,833.50. Tuesday kept 98.6 percent of that gain. Its high beat Monday's by 1.25 points, and its low sat 96.75 points above Monday's. The range shrank to 28.5 percent of Monday's, a compression of 95.50 points. Both extremes moved higher. There is no lower high anywhere in the sequence, which the review reads as a continuation pattern.
A 2.25 point barrier over a pivot with no cushion
Overhead, three levels crowd into 2.25 points. Tuesday's completed-session high at 7,848.50 comes first. The first standard pivot resistance at 7,850.00 sits one and a half points above it, and the one-month high at 7,850.75 three quarters of a point above that. The contract spent the day within a hair of its best level of the month and never cleared it. Clearing that barrier is what defines a constructive Wednesday.
Next comes the second standard pivot resistance at 7,868.25. The positioning note's own futures-and-cash pair puts its call-side ceiling at 7,867.70 (cash 7,800), effectively the same level from a separate method. That pair carries the source's fixed 67.70 point offset; the basis measured for this session was 67.11. Beyond it the three-and-ten day crossover stall at 7,876.54, the published target price at 7,881.06 and the third standard pivot resistance at 7,888.00 form a 12 point band. Then the ceiling. The 7,905.00 high is both the 52-week and the 13-week high, with one standard deviation resistance at 7,922.12 above it and two and three deviations at 7,959.55 and 7,988.27, beyond a plausible single session.
Translation relocates three of the note's cash confluence levels. The 7,897 and 7,889 levels, scored 99.80 and 91.70, convert at the measured 67.11 basis to futures 7,964.11 and 7,956.11, above the entire 7,876.54 to 7,922.12 region. They belong to the next zone higher. The 7,796 level, scored 92.65, converts to 7,863.11, which puts it overhead in futures terms and out of the support map.
Beneath price the ladder starts at once. The pivot point at 7,830.25 sits 1.50 points under the settle. The first standard pivot support at 7,812.00 and Tuesday's low at 7,810.50 form the first genuine test, 1.50 points apart. Another tight pair follows at 7,793.80 and 7,792.25. Those are the 14-3 day raw stochastic 80 percent threshold and the second standard pivot support. The third standard pivot support at 7,774.00 sits 1.30 points above the modeled volatility threshold pair at 7,772.70 (cash 7,705), which carries the same source offset, and the stochastic 70 percent threshold at 7,766.45 closes the group.
Then the densest confluence on the chart. The 40-day average crossing at 7,750.73, the 38.2 percent retracement from the four-week high at 7,745.41, the 20-day average at 7,742.55, the 5-day average at 7,741.60 and one standard deviation support at 7,741.38 fit inside 9.35 points. Five references. The two averages and the deviation band alone converge within 1.17 points. Below that band the 18-day crossing at 7,736.84, the relative-strength 50 percent line at 7,736.64, the 9-day crossing at 7,723.00, the 50 percent retracement at 7,712.88 and the 38.2 percent retracement from the 13-week high at 7,706.74 bracket two standard deviations support at 7,703.95. The modeled gamma-flip pair at 7,728.70 (cash 7,661) sits inside that zone on the same offset caveat.
Every average is beneath price. The settle sits 90.15 points above the 5-day at 7,741.60, 89.20 above the 20-day at 7,742.55, 118.26 above the 50-day at 7,713.49, 187.09 above the 100-day at 7,644.66 and 499.80 above the 200-day at 7,331.95. The year-to-date average reads 7,358.63. Wednesday's 9-day, 18-day and 40-day crossings at 7,723.00, 7,736.84 and 7,750.73 sit within 27.73 points of each other inside a 7,712 to 7,751 band that also holds the 50-day and two retracement lines. That band is 81 to 119 points beneath the settle. More than one average true range away.
Zoom out and the picture is a gap. The prior week, September 14 through September 18, spanned 7,575.00 to 7,739.25, and Tuesday's settle sits 92.50 points above all of it. The 13-week range runs 7,386.00 to 7,905.00 and the 52-week low is 6,466.00, so the last price sits 0.93 percent beneath the annual high and 21.12 percent above the annual low. Open interest rose from 1,843,461 contracts on 09/18 to 1,866,649 on 09/21. Positions were added into the advance.
Flat on the index, split underneath
The flow told a busier story than the close. The positioning note recorded cumulative index delta swinging from a 4 billion dollar negative trough to 4 billion dollars positive into the close, roughly 8 billion dollars of net swing, dominated by same-day expiries. The mix matters more than the total. Longer-dated calls at 7,800, 7,850 and 7,900 were lifted from roughly 10,000 to 15,000 contracts each, and longer-dated puts at 7,650 were cut from roughly 20,000 to 10,000. Upside bought and downside sold, in longer tenors, on a day the index went nowhere. Our review reads that as positioning for a move. No timestamp-aligned price and flow series was captured, so the swing cannot be pinned to the price path.
Single names carried the conviction. S&P constituents took 2 billion dollars of positive delta on longer-dated call buying, with memory issuers up 5 and 7 percent and one large bank down 3 percent. The large-capitalisation technology proxy gained 0.8 percent to a record. The small-capitalisation proxy took 601 million dollars of net negative delta and sits roughly 6 percent beneath its August record, with the higher-rate environment given as the reason.
Correlation is extremely low. The one-month correlation index fell beneath 8, which makes the index level the residue of large offsetting single-name moves. The review draws two consequences for Wednesday. Index volatility stays suppressed, consistent with a 33.4 basis point cash range and an 8 percent implied-volatility rank. And the usual shock absorber is gone, because a leadership reversal in a low-correlation market gets no cushion from anything rotating the other way.
Dealer positioning offers one reading of the narrow range. The gamma index reads 5.787, gamma tilt 1.557 and gamma notional 1.361 billion dollars, the largest of any symbol in the note's table. Positive dealer positioning of that size is generally read as hedging that leans against movement in both directions. The index closed 35.36 points beneath the 7,800 call-side ceiling and 264.64 points above the 7,500 put-side base, comfortably inside the damped band. The review offers that as interpretation only; the model snapshot cannot be shown to have produced the range.
Volatility fell alongside. The volatility index closed at 14.21, down 0.66 points or 4.44 percent after a 14.19 to 14.95 session, and the volatility-of-volatility measure closed at 83.17, down 3 percent. Fixed-strike volatility fell roughly a point across the board. The note's implied one-day move for the cash index is 0.67 percent, or 52.02 index points on a 7,764 reference, against a 77.02 point average true range on the futures. That gap is the clearest sign available that protection is cheap relative to recent movement.
Momentum is constructive and young. The 14-day relative strength reads 58.43, down 0.17 on the session, with the 9-day at 62.74 and the 20-day at 56.60. Raw stochastics sit at 93.88 percent on both the 9-day and 14-day and 93.11 percent on the 20-day. The smoothed lines read 83.70, 80.67 and 78.91 percent against signal lines between 60.39 and 65.81 percent, a wide gap that marks a reading which rose quickly. The 14-day directional index is 14.82, positive 22.54 against negative 19.72. A trend just starting. The composite reads 72 percent buy with strength average and direction strengthening while the composite indicator itself reads hold, and the short, medium and long groups read 80, 75 and 67 percent buy.
Rates carry the risk. The ten-year yield closed at 4.97 percent against 4.96 percent after trading 4.93 to 4.98, and the dollar index closed at 100.601, up 0.172 points or 0.17 percent, at what press commentary described as a seven-week high. Officials were reported describing an increased likelihood of inflation remaining notably above 2 percent. Then the auction hit. The two-year note stopped at a 4.787 percent high yield against a prior 4.204 percent, a 58.3 basis point jump, with a 2.630 bid-to-cover against a prior 2.600, per the news-feed calendar and unconfirmed. The September Richmond manufacturing survey fell 6 points to a seven-month low of minus 2 against an expectation of 2. The next policy decision is October 28.
Two headline threads ran alongside. Middle East diplomacy pointed toward de-escalation through the session, in reporting that remains unconfirmed. A news-agency report stamped 4:39 AM ET said Iran has proposed reopening the Strait of Hormuz within seven days if the United States lifts its blockade of Iranian ports, and Iran's armed forces dismissed the afternoon's deal remarks at 3:54 PM ET. November crude settled at 90.52, down 2.00 percent, and November Brent at 99.25, down 1.09 percent, both credited with supporting sentiment through the inflation channel. Trade is the other thread. A state visit is scheduled for Thursday, per the news-feed calendar and unconfirmed, and a group of senators was reported at 3:05 PM ET arguing for ending one major economy's access to advanced chips. For a broad index that thread carries the real asymmetry into Thursday.
The trade map for Wednesday
The primary setup is a long from 7,812 to 7,832. All three indicator horizon groups read buy for the first time in a week, the flow bought longer-dated upside and sold longer-dated downside, open interest rose with Monday's advance, and the settle sits 1.50 points above its own pivot. A shallow pullback into the first standard pivot support gives a long with a tightly defined risk point. The stop is 7,792, below the second standard pivot support at 7,792.25 and below the completed session low at 7,810.50. The targets step through the ladder above: 7,852, then 7,882, then 7,912.
From the 7,822 midpoint of the zone the risk to the stop is 30 points, 39.0 percent of the 14-day average true range of 77.02. The three targets sit 30, 60 and 90 points above that midpoint. A one-range projection from the 7,831.75 settle frames Wednesday between roughly 7,754.73 and 7,908.77. That envelope holds the zone, the stop and the first two targets. The third target sits 3.23 points above its upper edge.
The scenario ranges are analyst judgment and carry no calibration. The low-range case runs 7,805 to 7,860, the most likely 7,795 to 7,875 and the high-range case 7,770 to 7,900. Session by session the review expects roughly 7,815 to 7,850 through Globex with a neutral bias, then 7,810 to 7,860 through London with an upward lean. The morning band is 7,800 to 7,870 and the afternoon 7,805 to 7,860.
The reopen is flat so far. The new session opened at 7,830.00, has traded between 7,829.00 and 7,834.00, and last printed 7,833.25, 1.50 points above the settle. A five point band. Those figures belong to the Wednesday session and form no part of Tuesday's completed range.
Overnight, Australian flash purchasing-manager surveys print at 7:00 PM ET, per the news-feed calendar and unconfirmed, and the captured calendar places the Japanese flash surveys in Wednesday evening's block, per the news-feed calendar and unconfirmed. Europe sets the dollar leg. French flash surveys land at 3:15 AM ET, German at 3:30 AM ET with manufacturing forecast at 54.0, the eurozone aggregate at 4:00 AM ET with the composite forecast at 51.7 against a prior 52.0, and the United Kingdom at 4:30 AM ET with the composite forecast at 52.0 against a prior 52.5, with European Central Bank speakers at 3:00 AM and 4:50 AM ET. A soft eurozone composite firms the dollar further and caps the index beneath 7,848.50, while an upside surprise relieves it.
The morning is the event. The cash open at 9:30 AM ET sets the first directional test, and the United States flash surveys land at 9:45 AM ET, composite forecast 54.9 against a prior 56.0, services 55.9 against 56.5 and manufacturing 53.7 against 53.9, per the news-feed calendar and unconfirmed. The open and the data arrive close together. A Bank of England deputy speaks at 10:00 AM ET and a Federal Reserve governor at 10:05 AM ET on housing. The barrier is the morning's question. Clearing the 7,848.50 to 7,850.75 barrier opens 7,868.25 and then the 7,876.54 to 7,888.00 band; a failure there with the settle back beneath 7,830.25 points at the 7,810.50 to 7,812.00 pair.
The afternoon brings the auction. European Central Bank speakers appear at 12:00 PM and 12:30 PM ET, and a five-year note auction follows at 1:00 PM ET, where the prior auction stopped at a 4.393 percent high yield with a 2.370 bid-to-cover, per the news-feed calendar and unconfirmed. After Tuesday's 58.3 basis point jump in the two-year, that stop is a live risk. A weak result that lifts the ten-year through 5 percent is the most direct threat to the session, per the news-feed calendar and unconfirmed. Then the close. With gamma notional at 1.361 billion dollars and a tilt of 1.557, same-day expiry hedging is the mechanism most often cited for a pull toward the densest mapped levels into the close. The two nearest the cash close, 7,765 at a 79.67 score and 7,772 at 99.46, convert to futures 7,832.11 and 7,839.11.
The most probable path opens near the pivot. It tests the 7,848.50 to 7,850.75 barrier once in the first hour and then takes its direction from the 9:45 AM ET composite survey. As analyst judgment, the weighting favours a session that resolves higher. The constraint is gamma: a tilt of 1.557 on 1.361 billion dollars of notional argues that whichever direction is chosen, the distance travelled will be smaller than the 77.02 point average true range suggests, and the 52.02 point implied move is the market's own estimate of that. Failure has its own map. A failure at the barrier followed by a close beneath 7,830.25 opens 7,810.50 and then the 7,792.25 to 7,793.80 pair.
Two sector blocks moved 2 percent in opposite directions and left the S&P 500 six hundredths of a point from where it started, a balance that, with correlation beneath 8, has no shock absorber left.
The complete data picture
Every number behind Wednesday’s plan, charted first, then the full level lists, then the complete numeric reference underneath.
Full numeric reference, every remaining figure from the session review
1. Executive Summary
The December S&P 500 contract settled at 7,831.75 on Tuesday, down 1.75 points or 0.02 percent from Monday's 7,833.50 close, and the cash index it tracks closed at 7,764.64 against 7,764.70, a decline of six hundredths of a point. The completed futures session ran 7,848.50 to 7,810.50, a 38.00 point band, and the settle finished at 55.9 percent of that range on 1,260,077 contracts. The cash index traded 7,782.19 to 7,756.26, a 25.93 point range that is 33.4 basis points of the index level, matching the positioning note's own description of a 33 basis point day.
Nothing about that flatness was quiet underneath. The Nasdaq-100 cash index closed up 0.82 percent at a record while the Dow was reported down 0.36 percent, the semiconductor complex gained 2 percent and memory names 3 percent, and the financial sector fell 2 percent with one large bank down 3 percent. A broad index that finishes unchanged while its two largest sector blocks move 2 percent in opposite directions is not a dormant market; it is a market whose internal dispersion happened to net to zero. The one-month correlation index falling beneath 8 is the same observation expressed as a number.
The positioning evidence points the other way from the price. The positioning note recorded cumulative index flow moving from a 4 billion dollar negative delta intraday trough to a 4 billion dollar positive delta into the close, roughly 8 billion dollars of net swing, and attributed it to longer-dated call buying at 7,800, 7,850 and 7,900 lifting those lines from roughly 10,000 to 15,000 contracts while longer-dated puts at 7,650 were trimmed from roughly 20,000 to 10,000. Volatility confirmed the direction: the volatility index closed at 14.21, down 4.44 percent, the volatility-of-volatility measure at 83.17, down 3 percent, fixed-strike volatility fell roughly a point across the board, and the implied-volatility rank was put at 8 percent, near the lowest of the past year.
The structural contradiction heading into Wednesday is that the flow, the volatility complex and the indicator composite all lean constructive while the index itself has not moved and sits 73.25 points beneath its 52-week high with a ten-year yield at 4.97 percent. The composite multi-indicator read is 72 percent buy with strength graded average and direction graded strengthening, yet the composite indicator itself reads hold. The primary setup is a long from the 7,812 to 7,832 band, stopped beneath the second standard pivot support at 7,792.25, targeting the computed resistance ladder above.
2.1 Intraday and Session Review
The completed Tuesday futures session opened at 7,830.00, marked its low at 7,810.50 and its high at 7,848.50, and settled at 7,831.75, which is 1.75 points above the open and 1.75 points beneath Monday's close. The entire session took place inside a 38.00 point band, and the settle landed at 55.9 percent of it, marginally above the midpoint.
These session extremes are the completed-session inputs behind the published pivot ladder rather than an independently read bar. They were back-solved from the outer pivot pairs and verified twice: the third resistance point at 7,888.00 minus the third support point at 7,774.00 divided by three returns 38.00, and the second resistance point at 7,868.25 minus the second support point at 7,792.25 divided by two returns the same 38.00. Adding three times the pivot point at 7,830.25 and subtracting the settle gives a high-plus-low sum of 15,659.00, and the resulting pair of 7,848.50 and 7,810.50 reproduces all seven published rungs exactly. The provider's own published daily record returns 7,830.00, 7,848.50, 7,810.50, 7,831.75 on 1,260,077 contracts, so the derived extremes and the published record agree. That record is a second surface of the SAME vendor rather than an independent source, so it confirms internal consistency and not the underlying quote.
The cash session gives the better read on session character. The index opened at 7,770.81, made its high at 7,782.19 and its low at 7,756.26, and closed at 7,764.64, which is 6.17 points beneath the open and 32.3 percent of the way up the cash range. So the cash index closed in the lower third of its day while the futures contract closed in the upper half of its own; the difference is the overnight component that the futures session carries and the cash session does not. Close quality on the cash index was therefore weaker than the futures settle suggests.
2.2 Daily Structure
The prior week, September 14 through September 18, spanned 7,739.25 at the high and 7,575.00 at the low on the futures contract. Tuesday's settle at 7,831.75 sits 92.50 points above the entire prior weekly range, so like the Nasdaq contract this market has gapped away from the prior week rather than extended within it. The move happened on Monday, which travelled 7,713.75 to 7,847.25 and settled at 7,833.50.
For the quarterly reference the review uses the 13-week extremes as the available proxy, because no prior-quarter high or low was captured this run. The 13-week high stands at 7,905.00 and the 13-week low at 7,386.00, with the 52-week high also 7,905.00 and the 52-week low 6,466.00. The last price sits 0.93 percent beneath the 52-week high and 21.12 percent above the 52-week low. The one-month high of 7,850.75 sits only 2.25 points above Tuesday's session high, so the contract spent Tuesday within a hair of its best level of the month without clearing it.
The 20-day average at 7,742.55 sits 89.20 points beneath the settle, and the 5-day average at 7,741.60 sits almost exactly on top of it, 0.95 points lower. That coincidence is worth noting because the two averages together form a single shelf at 7,741.60 to 7,742.55, and the one standard deviation support at 7,741.38 falls on the same line. Three independent measures converging within 1.17 points is the most tightly defined support in this instrument.
2.3 4-Hour and Swing Structure
The five-session closing sequence from the published record reads 7,692.75, then 7,656.00, then 7,623.00, then 7,707.25, then 7,712.50, then 7,833.50, then 7,831.75. The low of the sequence was the 7,575.00 print on 09/16 and the character changed on 09/21, when the contract advanced 121.00 points and closed at 7,833.50. Tuesday's 38.00 point range is 28.5 percent of Monday's 133.50 point range, so the second session of this move was dramatically narrower than the first.
That is the swing-structure observation. A 121.00 point advance followed by a 38.00 point consolidation that retained 98.6 percent of the gain is a continuation pattern rather than a reversal one. There is no lower high in the sequence: Tuesday's 7,848.50 exceeded Monday's 7,847.25 by 1.25 points, and Tuesday's low of 7,810.50 sat 96.75 points above Monday's low of 7,713.75. Both extremes moved higher while the range compressed by 95.50 points, which is the plainest description of a market pausing.
The retracement grid published for Wednesday puts the 38.2 percent retracement from the four-week high at 7,745.41 and the 50 percent retracement of the four-week range at 7,712.88, and the 38.2 percent retracement from the 13-week high at 7,706.74 sits just beneath it. The first of those falls almost on the 5-day and 20-day average shelf, which reinforces the 7,741 to 7,745 area as the first structural catch beneath the pivot ladder.
2.4 Moving Averages
The stack is correctly ordered and entirely beneath price. The 5-day average stands at 7,741.60, the 20-day at 7,742.55, the 50-day at 7,713.49, the 100-day at 7,644.66, the 200-day at 7,331.95 and the year-to-date average at 7,358.63. The settle sits 90.15 points above the 5-day, 89.20 above the 20-day, 118.26 above the 50-day, 187.09 above the 100-day and 499.80 above the 200-day.
The projection grid gives Wednesday crossing prices of 7,723.00 for the 9-day, 7,736.84 for the 18-day and 7,750.73 for the 40-day. Those three sit within 27.73 points of each other and all fall inside the 7,712 to 7,751 band that also contains the 50-day average and two retracement lines. That band is the structural support zone for this advance and it is 81 to 119 points beneath the settle, which is more than one average true range away.
2.5 Oscillator and Trend Readings
Relative strength reads 62.74 on the 9-day, 58.43 on the 14-day, 56.60 on the 20-day, 55.38 on the 50-day and 55.09 on the 100-day, with the 14-day reading down 0.17 points on the session. The published grid places the 14-day relative-strength 70 percent line at 8,049.36 and its 50 percent line at 7,736.64, so the contract sits 95.11 points above neutral and 217.61 points beneath overbought on that measure.
Stochastics are elevated but not pinned. The raw stochastic reads 93.88 percent on both the 9-day and 14-day horizons and 93.11 percent on the 20-day, with smoothed lines at 83.70, 80.67 and 78.91 percent and signal lines between 60.39 and 65.81 percent. The gap between the smoothed lines in the low 80s and the signal lines in the low 60s is wide, which is the signature of a reading that has risen quickly rather than one that has been extended for a while. The published grid puts the 14-3 day raw stochastic 80 percent threshold at 7,793.80 and its 70 percent threshold at 7,766.45.
The directional system is constructive but young. The 9-day index reads 22.45 with positive direction at 24.72 against negative at 18.21; the 14-day reads 14.82 with positive at 22.54 against negative at 19.72; the 20-day reads 10.82 with positive at 21.45 against negative at 20.24. The 50-day and 100-day indices at 5.88 and 4.40 carry direction pairs that are effectively level and marginally negative. An index beneath 15 on the 14-day with a positive but narrow direction spread describes a market that has just started to trend rather than one that is trending. Historic volatility is the lowest of the four instruments covered this evening at 11.73 percent on the 9-day and 11.20 percent on the 14-day.
The composite multi-indicator read published for Wednesday is 72 percent buy, with strength graded average and direction graded strengthening, while the composite indicator itself reads hold. Underneath it the short-horizon group averages 80 percent buy, the medium-horizon group 75 percent buy and the long-horizon group 67 percent buy, which is the most internally consistent set of the four instruments. The prior readings were 72 percent buy at Monday's close, 16 percent sell one week ago and 56 percent buy one month ago.
2.6 Volatility and Expected Range
The 14-day average true range stands at 77.02 points, or 0.98 percent, with a 14-day average daily range of 78.77 points, or 1.01 percent. The 9-day average true range is 78.24 with a 9-day average daily range of 83.61, the 20-day average true range 77.62 and the 50-day 80.17. Tuesday's realised 38.00 point range was therefore 49.3 percent of the 14-day average true range and came in beneath every average-true-range and average-daily-range measure captured, which quantifies how unusual the session's compression was.
A one-range projection from the 7,831.75 settle using the 14-day average true range of 77.02 points frames Wednesday between roughly 7,754.73 and 7,908.77. The published standard-deviation bands run 7,741.38 to 7,922.12 at one deviation, 7,703.95 to 7,959.55 at two and 7,675.23 to 7,988.27 at three. The positioning note's own implied one-day move for the cash index is 0.67 percent, which on a 7,764 reference is 52.02 index points, and its implied one-day band runs 7,717.49 to 7,821.61 on the cash index. That implied band is materially narrower than the 77.02 point average true range, and the difference between an options market pricing 52 points and a realised-range measure of 77 points is the clearest statement available that protection is cheap relative to recent movement.
3.1 Resistance
The first ceiling is the completed session high at 7,848.50, with the first standard pivot resistance at 7,850.00 one and a half points above it and the one-month high at 7,850.75 three quarters of a point above that. Those three levels form a single 2.25 point barrier, and clearing it is what defines a constructive Wednesday.
Above that the second standard pivot resistance at 7,868.25 is the next line, and it carries additional weight because the positioning note's own futures-and-cash pair places its call-side ceiling at 7,867.70 against a cash value of 7,800, which is effectively the same level from an independent method. Note that the pair carries the source's own fixed offset of 67.70 rather than the basis measured for this session, which was 67.11.
Further out, the three-and-ten day moving-average crossover stall sits at 7,876.54, the provider's published target price at 7,881.06 and the third standard pivot resistance at 7,888.00, forming a 12 point band. The 52-week and 13-week high at 7,905.00 is the structural ceiling, and one standard deviation resistance at 7,922.12 sits above it. The positioning note's mapped confluence levels at 7,897 and 7,889, carrying conviction scores of 99.80 and 91.70, are cash index values and do not reinforce this band. Converted at this session's measured basis of 67.11 they sit at futures 7,964.11 and 7,956.11, which is above the 7,876.54 to 7,922.12 region entirely, so they belong to the next zone higher rather than to this one. The two and three standard deviations resistance at 7,959.55 and 7,988.27 are beyond a plausible single session.
3.2 Support
The immediate support is the Pivot Point at 7,830.25, only 1.50 points beneath the settle, which means Wednesday opens effectively on its own pivot with no cushion in either direction. Beneath it the first standard pivot support at 7,812.00 and Tuesday's session low at 7,810.50 form a 1.50 point pair that is the first genuine test.
The next group is the 14-3 day raw stochastic 80 percent threshold at 7,793.80 and the second standard pivot support at 7,792.25, another tight pair. The positioning note's mapped confluence at 7,796 carries a conviction score of 92.65 but is a cash index value: converted at the measured basis of 67.11 it sits at futures 7,863.11, which is overhead rather than in this support region, and it is named here only so the domain difference is explicit. Below that the third standard pivot support at 7,774.00 and the positioning note's own modeled volatility threshold pair of 7,772.70 against a cash value of 7,705 are 1.30 points apart, and that pair likewise carries the source's fixed offset rather than this session's measured basis. The 14-3 day raw stochastic 70 percent threshold at 7,766.45 closes the group.
Deeper, the 40-day average crossing price at 7,750.73, the 38.2 percent retracement from the four-week high at 7,745.41, the 20-day average at 7,742.55, the 5-day average at 7,741.60 and one standard deviation support at 7,741.38 form the densest confluence in the instrument inside a 9.35 point band. That is the structural support base for this advance. Beneath it the 18-day average crossing at 7,736.84, the 14-day relative-strength 50 percent line at 7,736.64, the 9-day average crossing at 7,723.00, the 50 percent retracement of the four-week range at 7,712.88 and the 38.2 percent retracement from the 13-week high at 7,706.74 bracket two standard deviations support at 7,703.95. The positioning note's modeled gamma-flip pair at 7,728.70 against a cash value of 7,661 sits inside that zone and carries the same offset caveat.
4.1 Dollar, Rates, and Fed Policy
The ten-year yield closed at 4.97 percent against 4.96 percent on Monday, having traded 4.93 to 4.98, and the dollar index closed at 100.601, up 0.172 points or 0.17 percent at what press commentary described as a seven-week high. A broad index unchanged on a day when the dollar makes a seven-week high and the ten-year holds within three basis points of 5 percent is a reasonable outcome rather than a weak one.
Policy commentary leaned hawkish and was the proximate reason the dollar made its high. Officials were reported describing an increased likelihood of inflation remaining notably above 2 percent and warning it could take time to settle, with press commentary reading both as opening the door to further tightening. The projection material from the September 16 meeting, reported at 2:00 PM ET that day, showed 12 of 18 officials expecting one further 25 basis point increase this year, four expecting two and two expecting none. A Richmond official noted at 12:52 PM ET that there is momentum outside data centres and artificial-intelligence capital spending, with consumer spending holding up and strength in defence and manufacturing.
The auction evidence is the sharpest rate signal of the day. A two-year note auction at 1:00 PM ET stopped at a 4.787 percent high yield with a 2.630 bid-to-cover, against a prior 4.204 percent and a prior 2.630 cover measure of 2.600, per the news-feed calendar and unconfirmed. That 58.3 basis point jump in the stopping yield is the front end repricing the tightening path in one auction. Against all of that, the September Richmond manufacturing survey fell 6 points to a seven-month low of minus 2 against an expectation of 2. New York Federal Reserve officials spoke on money-market plumbing at 4:25 PM and 4:26 PM ET, describing reserve-management purchases as not on a pre-set course. The next policy decision is October 28.
4.2 Large-Cap Leadership and Earnings
No mega-cap earnings were reported on Tuesday and none is scheduled after Wednesday's close on the captured calendar; the nearest large-cap report is Thursday at 5:00 PM ET. Leadership was therefore driven by product and flow rather than results. The positioning note recorded 2 billion dollars of positive delta in single-stock S&P names driven by longer-dated call buying, with memory issuers leading at 5 and 7 percent gains while one large bank fell 3 percent.
The corporate news flow was dense and one-directional. A large-cap chipmaker launched two flagship mobile platforms at 4:04 PM ET, a hardware maker introduced refreshed desktop computers, an artificial-intelligence developer announced a model-family expansion at 2:20 PM ET and a rival announced a new model tier, a payments company and a social-media platform announced a checkout partnership at 11:20 AM ET, and a cloud provider was reported at 11:55 AM ET to have won a first restricted-cloud approval from a defence alliance. A software issuer began a round of roughly 500 layoffs, reported at 10:07 AM ET.
4.3 Geopolitical Backdrop
Two threads moved. The first was Middle East diplomacy, which pointed toward de-escalation throughout the session and is unconfirmed reporting rather than settled fact. A news-agency report stamped 4:39 AM ET said Iran has proposed reopening the Strait of Hormuz within seven days if the United States lifts its blockade of Iranian ports. A 1:52 PM ET item recorded a statement that United States officials had met an Iranian delegation for three hours, a 3:24 PM ET item reported a meeting between Iran's foreign minister and a United States envoy, and rostrum remarks between 3:32 PM and 3:41 PM ET spoke of momentum toward a deal and of facilitating renewed flow through the Strait. Iran's armed forces dismissed those remarks at 3:54 PM ET.
The second was trade. A state visit is scheduled for Thursday, and investment-bank commentary read it as likely to reinforce a managed-competition framework rather than produce a reset, with the main focus on extending existing arrangements, per the news-feed calendar and unconfirmed. A social-media chief executive was reported at 2:45 PM ET as planning to attend the associated dinner, and a group of senators was reported at 3:05 PM ET arguing for ending one major economy's access to advanced chips. For a broad index the trade thread is the one with real asymmetry into Thursday.
4.4 Sector Breadth and Rotation
This is the defining feature of the session. The semiconductor complex rose 2 percent and memory names 3 percent while the financial sector fell 2 percent, described in the positioning note as capital rotating out of defensive sectors and into offensive ones. The large-capitalisation technology proxy gained 0.8 percent and made a record while the small-capitalisation proxy took 601 million dollars of net negative delta and sits roughly 6 percent beneath its August record, with the higher-rate environment given as the explanation.
The measurable consequence is the one-month correlation index falling beneath 8. Extremely low realised correlation means the index level is the arithmetic residue of large offsetting single-name moves, which has two implications for Wednesday. It suppresses index volatility, which is consistent with a 33.4 basis point cash range and an 8 percent implied-volatility rank. And it removes the index's usual shock absorber, because a leadership reversal in a low-correlation market is not cushioned by anything rotating the other way.
4.5 Cross-Asset and Volatility
The volatility index closed at 14.21, down 0.66 points or 4.44 percent, after a 14.19 to 14.95 session, and the positioning note recorded the volatility-of-volatility measure at 83.17, down 3 percent, with fixed-strike volatility falling roughly a point across the board and the implied-volatility rank at 8 percent. That is a volatility complex pricing calm at close to the cheapest level of the past year.
Elsewhere the November crude contract settled at 90.52, down 2.00 percent, and the November Brent contract at 99.25, down 1.09 percent, both of which the positioning note credited with supporting sentiment through the inflation channel. Gold's December contract settled at 4,376.4, down 0.17 percent. The Nasdaq-100 cash index closed up 0.82 percent at a record and the Dow down 0.36 percent, so this index sat precisely between its two neighbours and finished unchanged.
4.6 Institutional Positioning
No commitment-of-traders report was captured for this contract this run, so speculative futures positioning is not asserted. Open interest stands at 1,866,649 contracts. The published record shows open interest at 1,843,461 on 09/18 and 1,866,649 on 09/21, so positions were added alongside Monday's advance rather than closed out.
The options-side positioning is covered in detail in section 5. The headline from it is that the positioning note's recorded intraday flow swing of roughly 8 billion dollars of delta, from minus 4 billion to plus 4 billion into the close, occurred on a session where the cash index finished almost unchanged, six hundredths of a point on the close, inside a 25.93 point intraday range. A flat close is not an absence of movement through the flow window, and no timestamp-aligned price and flow series was captured this run, so the two cannot be tied together here. The gamma readings in section 5 offer an interpretation of why the realised range stayed narrow; they do not establish it.
5. Index Options Flow Context
This is the primary flow surface for this instrument rather than a proxy, and every level quoted from it is a cash index value unless a futures pair is stated explicitly.
The dealer-positioning stack reads a modeled volatility threshold at 7,705, a primary gamma concentration at 8,000, a call-side ceiling at 7,800 and a put-side base at 7,500, with a modeled gamma-flip level at 7,661. The gamma index reads 5.787, gamma tilt 1.557 and gamma notional 1.361 billion dollars, the largest of any symbol in the positioning note's table. The 25-delta risk reversal sits at minus 0.03, close to flat. Call volume was 1.091 million against put volume 1.171 million, and call open interest 8.81 million against put open interest 12.415 million. The key mapped cash levels are 8,000, 7,800, 7,700 and 7,000.
A gamma tilt above 1.5 on 1.361 billion dollars of notional is consistent with Tuesday's 33.4 basis point cash range, and is offered as an interpretation rather than a demonstrated cause: no timestamp-aligned price and flow series was captured this run, so the model snapshot cannot be shown to have produced the range. Positive dealer positioning of that size is generally read as hedging flows leaning against movement in both directions, and the index closed 35.36 points beneath the mapped call-side ceiling at 7,800 and 264.64 points above the put-side base at 7,500, which is comfortably inside the damped band.
The reference price column requires care and this run verified it explicitly. That column is the prior session's close, not Tuesday's. The verification does not work on this index alone, because the cash index was flat and its reference of 7,764 is indistinguishable from its close of 7,764.64. It works cleanly on the technology index: a reference of 30,482 multiplied by the stated 0.82 percent gain returns 30,732, which reconciles with that index's published cash close of 30,732.40, and the equivalent test on the technology proxy returns 746.9 against a published close of 746.63. The reference column is therefore the prior close on every symbol in the table.
That matters most for the futures column, which is where the trap sits. The table's December futures column reads a reference of 7,831.70, a modeled volatility threshold of 7,772.70, a primary gamma concentration of 8,067.70, a call-side ceiling of 7,867.70, a put-side base of 7,567.70 and a modeled gamma-flip level of 7,728.70. Every one of those is the corresponding cash value plus exactly 67.70, so the entire column is a fixed-offset translation rather than an independent futures quote. Its reference of 7,831.70 happens to sit five hundredths of a point from Tuesday's actual futures settle of 7,831.75, which is a coincidence produced by a flat cash session, and reading it as Tuesday's futures close would be wrong by the full basis. The basis measured this session is 7,831.75 minus 7,764.64, which is 67.11, and where a level in section 3 is quoted as a futures-and-cash pair from this source it carries the source's 67.70 offset and is labelled as such.
On flow, the positioning note recorded cumulative index delta moving from minus 4 billion dollars at the intraday trough to plus 4 billion into the close, dominated by same-day expiries, and characterised the index-level activity as tactical on that basis. The composition is more interesting than the total: longer-dated calls at 7,800, 7,850 and 7,900 were lifted from roughly 10,000 to 15,000 contracts each, while longer-dated puts at 7,650 were cut from roughly 20,000 to 10,000. Buying upside and selling downside in longer tenors, on a day when the index did not move, is positioning for a move rather than a reaction to one.
The mapped confluence levels with their conviction scores give the finest-grained map available for Wednesday. Immediately around the close: 7,772 at 99.46, 7,780 at 98.91, 7,788 at 99.66, 7,796 at 92.65, 7,804 at 99.92, 7,811 at 98.90, 7,819 at 94.44 and 7,827 at 99.83. Above: 7,842 at 98.03, 7,850 at 99.46, 7,858 at 91.11, 7,873 at 96.95, 7,881 at 93.73, 7,889 at 91.70 and 7,897 at 99.80. Beneath: 7,765 at 79.67, 7,757 at 93.51, 7,749 at 96.31, 7,741 at 84.51 and 7,734 at 68.95. These are conviction scores rather than calibrated frequencies and are treated as such throughout.
One conflict is recorded rather than resolved. An equity positioning dashboard row for this index showed a current price of 7,760.00 with a previous close field of 7,650.50 and a stated daily change of 1.43 percent, which contradicts both the positioning note's reference of 7,764 and the published cash series of 7,764.70 into 7,764.64. The same row also showed a 52-week low of zero. The row's prior-close and daily-change fields were therefore not used anywhere in this review; its call gamma of 6.2 billion, put gamma of minus 3.5 billion, next-expiry gamma of 6.01 percent and share volume of 1,767,425,367 are carried as read. That dashboard's high-volatility-point and low-volatility-point fields, published as 8,180 and 9,020 with the low above the high, are inverted and are excluded.
6.1 Night Session (6:00 PM ET Tuesday to 3:00 AM ET Wednesday, Globex and Asia)
The Globex reopen is flat. The new session opened at 7,830.00, has traded between 7,829.00 and 7,834.00, and the last print of 7,833.25 stands 1.50 points above Tuesday's settle, a five point overnight band. Australian flash purchasing-manager surveys print at 7:00 PM ET, per the news-feed calendar and unconfirmed. The captured calendar places the Japanese flash surveys in Wednesday evening's block rather than tonight's, per the news-feed calendar and unconfirmed. With the settle sitting 1.50 points from its own pivot and the overnight range five points wide, this is a market waiting rather than positioning. Bias neutral, expected Globex band roughly 7,815 to 7,850.
6.2 London Session (3:00 AM to 8:00 AM ET Wednesday)
European flash purchasing-manager surveys run from 3:15 AM ET for France, 3:30 AM ET for Germany with manufacturing forecast at 54.0, 4:00 AM ET for the eurozone aggregate with the composite forecast at 51.7 against a prior 52.0, and 4:30 AM ET for the United Kingdom with the composite forecast at 52.0 against a prior 52.5. European Central Bank speakers appear at 3:00 AM and 4:50 AM ET. The European window sets the dollar leg: a soft eurozone composite firms the dollar further and caps the index beneath 7,848.50, while an upside surprise relieves it. Bias neutral with an upward lean, expected band roughly 7,810 to 7,860.
6.3 Morning Session (9:30 AM to 12:00 PM ET Wednesday, regular trading hours open)
United States flash purchasing-manager surveys print at 9:45 AM ET, composite forecast 54.9 against a prior 56.0, services 55.9 against 56.5 and manufacturing 53.7 against 53.9, per the news-feed calendar and unconfirmed. The cash open at 9:30 AM ET sets the session's first directional test, and the survey lands shortly after it rather than before it, so the open and the data arrive close together rather than in separate hours. A Bank of England deputy speaks at 10:00 AM ET and a Federal Reserve governor at 10:05 AM ET on housing. The 7,848.50 to 7,850.75 barrier is what the morning is about: clearing it opens 7,868.25 and then the 7,876.54 to 7,888.00 band, while a failure there with the settle back beneath 7,830.25 points at the 7,810.50 to 7,812.00 pair. Expected band roughly 7,800 to 7,870.
6.4 Afternoon Session (12:00 PM to 4:00 PM ET Wednesday)
The afternoon carries European Central Bank speakers at 12:00 PM and 12:30 PM ET and a five-year note auction at 1:00 PM ET, where the prior auction stopped at a 4.393 percent high yield with a 2.370 bid-to-cover, per the news-feed calendar and unconfirmed. Tuesday's two-year auction stopped 58.3 basis points above its prior, so the five-year stop is a live risk rather than a formality, and a weak result that lifts the ten-year through 5 percent is the most direct threat to the session, per the news-feed calendar and unconfirmed. With gamma notional at 1.361 billion dollars and a tilt of 1.557, same-day expiry hedging is the mechanism most often cited for a pull toward the densest mapped confluence levels into the close. Those levels are cash index values: the two nearest the 7,764.64 cash close are 7,765 at a 79.67 conviction score and 7,772 at 99.46, which convert at the measured basis of 67.11 to futures 7,832.11 and 7,839.11. Expected band roughly 7,805 to 7,860.
6.5 Night Session Forward (6:00 PM ET Wednesday)
Residual bias into the Wednesday evening reopen depends on whether the 7,848.50 to 7,850.75 barrier was cleared and held. Japanese flash surveys at 8:30 PM ET and Australian labour data at 9:30 PM ET, with the unemployment rate forecast at 4.5 percent, provide the overnight texture. The larger forward anchor is Thursday, carrying jobless claims at 8:30 AM ET with a consensus of 200,000 against a prior 196,000, the current account at 8:30 AM ET, new home sales at 10:00 AM ET, a senior credit officer survey at 2:00 PM ET, a seven-year note auction at 1:00 PM ET, a large-cap retailer's results at 5:00 PM ET and an all-day state visit, per the news-feed calendar and unconfirmed.
6.6 Expected Range (Wednesday Full Session)
Low-range scenario: 7,805 to 7,860
Mid-range scenario (most likely): 7,795 to 7,875
High-range scenario: 7,770 to 7,900
6.7 Most Likely Path
The most probable path opens the cash session at 9:30 AM ET near the pivot, tests the 7,848.50 to 7,850.75 barrier once in the first hour, and then takes direction from the 9:45 AM ET composite survey. The weighting favours a session that resolves higher rather than lower, because the flow composition was upside calls bought and downside puts sold in longer tenors, the indicator groups agree across all three horizons for the first time in a week, and open interest rose with Monday's advance. The constraint is the gamma configuration: a tilt of 1.557 on 1.361 billion dollars of notional argues that whatever direction is chosen, the distance travelled will be smaller than the 77.02 point average true range suggests, and the implied one-day move of 52.02 index points is the market's own estimate of that. A failure at the barrier followed by a close beneath 7,830.25 opens 7,810.50 and then the 7,792.25 to 7,793.80 pair. These weightings are analyst judgment rather than derived frequencies.
7. Wednesday Economic Calendar
The overnight block opens with Australian flash purchasing-manager surveys at 7:00 PM ET Tuesday, prior readings 52.0 manufacturing and 52.7 composite, while the captured calendar places the Japanese flash surveys at 8:30 PM ET, prior manufacturing 54.9 and composite 53.5, and the Australian labour data at 9:30 PM ET, unemployment forecast 4.5 percent and employment change 20,000 against a prior decline of 15,800, in Wednesday evening's block rather than Tuesday's, per the news-feed calendar and unconfirmed. The European morning carries a European Central Bank speaker at 3:00 AM ET, French flash surveys at 3:15 AM ET with the composite forecast at 48.7, German flash surveys at 3:30 AM ET with manufacturing forecast at 54.0 against a prior 54.3, the eurozone aggregate at 4:00 AM ET with the composite forecast at 51.7 against a prior 52.0, United Kingdom flash surveys at 4:30 AM ET with the composite forecast at 52.0 against a prior 52.5, and a further European Central Bank speaker at 4:50 AM ET.
The United States morning opens with flash purchasing-manager surveys at 9:45 AM ET, composite forecast 54.9 against a prior 56.0, services 55.9 against 56.5 and manufacturing 53.7 against 53.9, per the news-feed calendar and unconfirmed. A Bank of England deputy speaks at 10:00 AM ET and a Federal Reserve governor at 10:05 AM ET on housing. The weekly petroleum status report lands at 10:30 AM ET on Wednesday and reaches this index only through the energy and inflation channel that supported it on Tuesday. The afternoon carries European Central Bank speakers at 12:00 PM and 12:30 PM ET and a five-year note auction at 1:00 PM ET, prior high yield 4.393 percent, prior bid-to-cover 2.370, per the news-feed calendar and unconfirmed.
The single first-order event for this index is the 9:45 AM ET United States flash composite survey. It is the only Wednesday release capable of moving the front end and the ten-year yield together, and with the front end having repriced 58.3 basis points at Tuesday's two-year auction, the rate reaction function is the dominant transmission channel this week, per the news-feed calendar and unconfirmed. No mega-cap earnings are scheduled after Wednesday's close on the captured calendar, and no structural expiry falls on Wednesday; the monthly option expiry passed on September 18, the next volatility-index expiry is in October, and quarter end is September 30. The next first-order grouping is Thursday, with jobless claims at 8:30 AM ET, new home sales at 10:00 AM ET, a seven-year note auction at 1:00 PM ET, a senior credit officer survey at 2:00 PM ET, a large-cap retailer reporting at 5:00 PM ET and an all-day state visit, per the news-feed calendar and unconfirmed.
8. Primary Trade Setup
Direction: Long
Rationale: All three indicator horizon groups read buy for the first time in a week at 80, 75 and 67 percent, the positioning note's flow composition was longer-dated upside bought and longer-dated downside sold, open interest rose with Monday's advance, and the settle sits 1.50 points above its own pivot, so a shallow pullback into the first standard pivot support offers a long with a tightly defined risk point.
Entry Zone: 7,812 to 7,832
Stop Loss: 7,792 (below the second standard pivot support at 7,792.25, which is also below the completed session low at 7,810.50)
Target 1 (T1): 7,852 (above the first standard pivot resistance at 7,850.00 and the one-month high at 7,850.75)
Target 2 (T2): 7,882 (at the published target price of 7,881.06 and above the second standard pivot resistance at 7,868.25)
Target 3 (T3, extended): 7,912 (above the 52-week high at 7,905.00 and beneath one standard deviation resistance at 7,922.12)
Risk-to-Reward: Approximately 1:1 to T1, 1:2 to T2, 1:3 to T3
Invalidation: A settle beneath 7,792.25 negates the thesis, and a full session spent beneath the Pivot Point at 7,830.25 after a failed test of 7,848.50 removes the edge before the stop is reached, because the entire case rests on the 38.00 point inside session holding as a consolidation rather than a distribution.
Macro override: A hot United States flash composite survey at 9:45 AM ET that lifts the ten-year yield through 5 percent, or a five-year auction at 1:00 PM ET that stops as far above its prior as Tuesday's two-year did, would reprice duration and invalidate the long in real time, per the news-feed calendar and unconfirmed. The second override is the state visit on Thursday: with the one-month correlation reading beneath 8 and the index's advance resting on a single sector, an adverse export-policy headline would strike the leadership without any rotation available to cushion it.
Sources and methodology
This outlook is built from our session review of the December E-mini S&P 500 contract, the December ’26 contract, prepared after Tuesday's close on September 22, 2026 for the Wednesday, September 23, 2026 session. Tuesday's completed extremes are recovered from the published pivot ladder: the third-level pair of 7,888.00 and 7,774.00 divided by three and the second-level pair of 7,868.25 and 7,792.25 divided by two both return 38.00, and three times the 7,830.25 pivot less the settle gives a high-plus-low sum of 15,659.00, which yields 7,848.50 and 7,810.50 and reproduces all seven published rungs. The provider's daily record agrees; it is a second surface of the same vendor, so it confirms internal consistency and not the underlying quote.
The contract domain was checked before any level was used: the chart's last of 7,833.25 less its stated change of 1.50 returns 7,831.75, equal to the published previous close, and the new session's 7,830.00 open, 7,834.00 high and 7,829.00 low belong to Wednesday and are never presented as Tuesday's range. Cash index levels from the positioning note are quoted as published; its futures column is a fixed 67.70 translation, and any conversion made here uses the 67.11 basis measured this session, the 7,831.75 settle less the 7,764.64 cash close. Conviction scores are scores, not calibrated frequencies. Scenario ranges are analyst judgment. Items marked unconfirmed come from the news-feed calendar. No timestamp-aligned price and flow series and no commitment-of-traders report were captured for this session, and no figure is asserted for them.
Tuesday’s outlook for this contract is here, and the Nasdaq-100 contract's Tuesday outlook covers the index that closed at a record on the same session. Outlooks for ES, NQ, GC and CL are collected on the market outlook page, and our forward trading record is on the performance statement.



