
At 10:16 AM ET on Monday, AMD crossed a one trillion dollar market capitalisation for the first time. INTC added 12 percent, ARM 17 percent, and the semiconductor sector as a whole gained 5 percent. META did the heaviest lifting. It rose 11 percent on optimism around its new model offering and was the single largest contributor to the index advance. The cash index closed at 7,765, up 1.5 percent inside a 114 basis point intraday range. Strongest session since early August.
December E-mini futures settled at 7,833.50 after a completed range from 7,847.25 down to 7,713.75, a span of 133.50 points. Settlement landed 89.7 percent of the way up that range and 35.33 points above the pivot point at 7,798.17. Open interest reads 1,843,461 contracts, by a wide margin the deepest book of the four instruments in this package, and the five-day change is a gain of 140.75 points, or 1.83 percent. The 52-week high at 7,905.00 sits 71.50 points above settlement, 0.91 percent. So the contract finished inside one percent of its own annual peak without exceeding it. Tuesday's first test sits within 14 points overhead. Monday's high and the 7,850.75 one-month high stand 3.50 points apart.
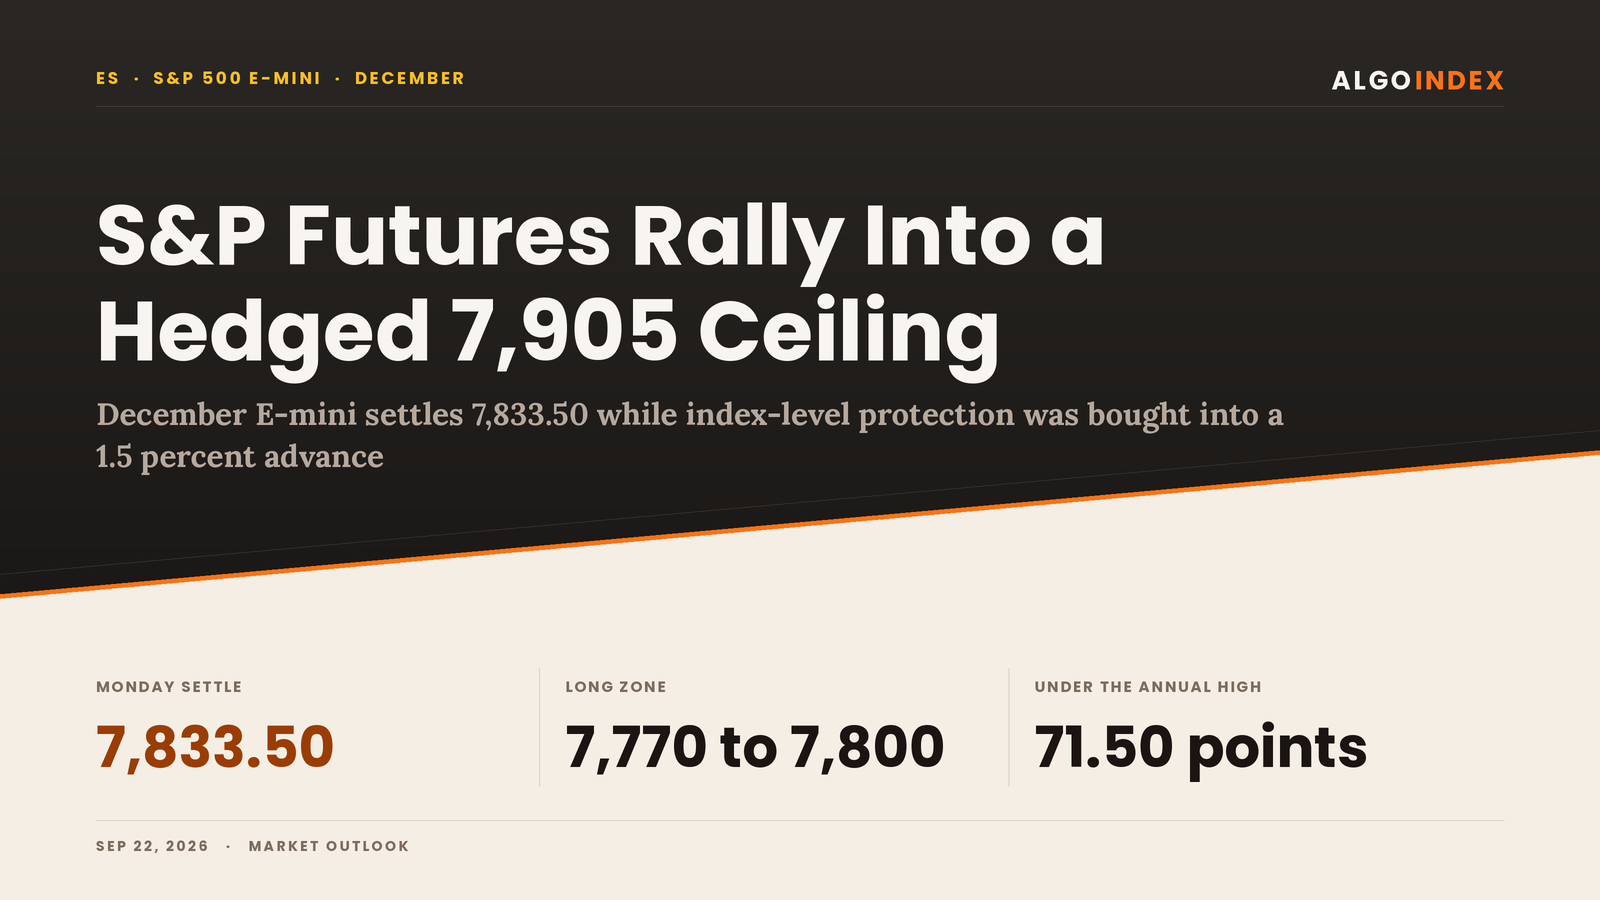
December S&P 500 futures settled at 7,833.50, up 1.83 percent over five sessions and 35.33 points above the pivot point at 7,798.17. Resistance starts at Monday's completed-session high of 7,847 (cash 7,779), with the 7,851 one-month high (cash 7,782) three and a half points above it. Then the year's ceiling. Above that pair sit the first pivot resistance at 7,883 (cash 7,814), the computed target price at 7,889 (cash 7,820) and the 7,905 annual high (cash 7,837). Support begins at the 7,798 pivot (cash 7,730) and thickens into the 7,735 to 7,753 band, where the 20-day average, the first pivot support, the 1 standard deviation support and two moving-average crossings overlap inside 18 points. The primary setup is a long from 7,770 to 7,800, stop 7,735, targets 7,847, 7,883 and 7,932. At-the-money implied volatility for Tuesday is quoted at 9.9 percent, with index-level protection accumulated into Monday's advance.
The short that filled, then lost
Monday's outlook set a short from 7,731 to 7,743, stop 7,760, targets 7,709, 7,687 and 7,675. Monday's completed range ran 7,713.75 to 7,847.25. Price crossed the entry band, so the short filled. Then it kept going. The 7,760 stop was taken out and the session high printed 87.25 points above it. The first target at 7,709 was never reached, missing by 4.75 points at the 7,713.75 low. The published invalidation, a settlement above 7,750.49, came in 83.01 points clear at 7,833.50. That call failed, and it failed on every line of the card.
One caution belongs on the record. This run recovered the completed session from the published pivot ladder and captured no time-stamped intraday series, so the order of the high and the low inside Monday's session is not something the data can establish. The outcome it does establish needs no sequence: the stop sat 87.25 points beneath the high and no reading of the path rescues the trade.
The reason sits in the lead. Concentrated leadership in the largest names moves a capitalisation-weighted index hard, and the positioning note captured at 5:26 PM ET records roughly plus 2 billion dollars of hedging flow in META alone against a 76 dollar move on a 16 dollar implied move. A supply shelf assembled from moving averages does not survive that arithmetic. Working alongside it, the front crude contract settled at 92.37 with the expiring contract down 4.51 percent as diplomatic activity around the Iran conflict drained the supply premium, and lower energy lowers the headline inflation that sets the expected policy path. Growth and discount rate pointed the same way on the same day.
Three and a half points between two highs
Overhead the map is thin, and then it is hard. Monday's completed-session high at 7,847 (cash 7,779) is the first reference, and the one-month high at 7,850.75 sits 3.50 points above it, which means the session tested the month's ceiling and stopped fractionally beneath it. Above that pair the first pivot resistance prints at 7,883 (cash 7,814) and the computed target price at 7,889 (cash 7,820). Then the year. The 52-week high at 7,905.00 doubles as the 13-week high, one price that has capped this contract for twelve months, with the 1 standard deviation resistance band at 7,914 (cash 7,845) calculated on the past five closing prices just above it. Beyond, the second pivot resistance at 7,932 (cash 7,863) carries the 2 standard deviations band at 7,946.83 immediately over it, and the third pivot resistance at 8,016 (cash 7,948) closes the ladder.
Beneath price the structure is denser. The pivot point at 7,798.17 (cash 7,730) is the first mechanical support and the level that defines the constructive read. Then the band that matters. The 1 standard deviation support at 7,753 (cash 7,685) sits 4.28 points above the first pivot support at 7,749.08 (cash 7,681). Directly under those two, the 38.2 percent retracement from the four-week high at 7,745.41, the 40-day average crossing at 7,743.04, the 20-day average at 7,737.76 and the 18-day crossing at 7,735.54 stack inside ten points. Six references, eighteen points. That makes 7,735 to 7,753 the densest support in the structure, and it is the only reason a 50 point stop is defensible on a contract whose 14-day average true range is 80.02 points.
Below the band sits the cleanest alignment in this edition. Monday's completed-session low at 7,714 (cash 7,645) printed within two points of the modeled volatility threshold the positioning note publishes at 7,711.8 on its own futures column. That threshold prints at 7,645 on cash and carries the source's own 66.8 point offset, and not the 68.5 point basis measured for this session. The contract then settled 119.75 points above it. Deeper down, the modeled gamma-flip level prints at 7,673 (cash 7,606), the second pivot support at 7,665 (cash 7,596) and the third pivot support at 7,616 (cash 7,547), with the one-month low at 7,575.00 beneath it. The put-side hedging boundary at 7,567 (cash 7,500) is the one of those three modeled levels that sits on a listed strike. The 13-week low at 7,386.00 is the base of the three-month range. This market is now testing that range at its top.
Every average is beneath the settlement. The 5-day sits at 7,706.45, the 20-day at 7,737.76, the 50-day at 7,709.48, the 100-day at 7,639.13 and the 200-day at 7,328.16. Settlement is 127.05 points above the 5-day and 505.34 points above the 200-day, with the 20-day above the 50-day in the constructive ordering. The 20-day also lands inside the 7,735 to 7,745 retracement grouping. That is what concentrates the first genuine support into a narrow band.
Bought in the names, hedged at the index
Flow ran two ways at once. Captured hedging-flow data shows single-stock flow at roughly plus 8 billion dollars of delta, the largest reading of the past 30 days, with 75 percent of it from the seven largest names. Index-level flow ran about minus 2 billion dollars, built on same-day-expiry call selling and longer-dated put buying. Traders chased individual names and paid up for index protection in the same session. That describes a narrow advance rather than a broad one, and breadth itself was not captured as a series in this run, so no advance-decline or volume-differential figure is asserted here.
The pin is the other half. The positioning note records a roughly 20,000-lot same-day-expiry call position at 7,765 on cash as the largest single position of the day, and 7,765 on cash is where the index closed. Whether that position held the price there or merely marked it is not something this capture can separate.
Volatility barely moved. The cash index gained 1.5 percent and the volatility complex shrugged. The volatility index closed at 14.86, up 0.07, and the volatility-of-volatility index at 85.77, both described as relatively flat in the captured positioning note. Fixed-strike volatility rose 1 to 3 points across the surface. At-the-money implied volatility for Tuesday reads 9.9 percent, toward the lower end of the past year's range, which the note frames as leaving long index options at relatively attractive risk and reward. Low implied volatility alongside index-level protection buying is an unusual pairing, and it is the cleanest available signal that this rally is being hedged and not trusted.
The momentum readings argue with the price. The 14-day relative strength measure reads 58.60, up 9.43 points, with the 9-day at 63.02 and the 20-day at 56.71. None is near an overbought extreme. That is unusual for a contract that just closed inside one percent of its annual high. The advance looks built in steps and not in one impulse. The 14-day raw stochastic prints 94.95 percent while stochastic %K reads 65.37 percent and %D 42.90 percent, the signature of a fresh push into the upper part of a range. The 14-day directional index reads 15.45, with the positive indicator at 23.24 against the negative at 20.44 and the 9-day index at 23.37. Neither side leads by much. A directional index in the mid-teens with under three points between the two indicators describes a range and not a trend, which sits in tension with a settlement one percent from the annual high. The multi-indicator composite prints 72 percent buy at average strength and strongest direction while the composite trend signal reads hold, and the group splits read 80 percent buy short-term, 75 percent medium-term and 67 percent long-term.
Policy cuts the other way. That is the defining tension of this environment. Investment-bank commentary in the news feed records a unanimous 25 basis point hike in September that lifted the target range to 3.75 to 4.00 percent. Projections published at 2:00 PM ET on September 16 show 12 of 18 officials expecting one further 25 basis point increase this year, four expecting two and two expecting none. The commentary got louder on Monday. A regional policymaker said at 2:19 PM ET that interest rates likely need to rise further to tame inflation that is both demand and supply driven. He added at 2:20 PM ET that increases are better earlier and incremental than later and larger, and noted at 2:20 PM ET that the commodity shock extends past oil into base metals such as copper. At 2:39 PM ET he said core inflation may be running a full percentage point above target. The dollar index firmed 0.20 percent on that commentary. Longer-dated yields slipped on the day according to the captured positioning note. Investment-bank commentary in the news feed described yields pushing toward 5 percent over the prior week, a characterisation unconfirmed against any verified series captured in this run. A precise 10-year level was not captured and is not asserted here.
The trade map for Tuesday
The primary setup is a long from 7,770 to 7,800, a pullback toward the pivot point at 7,798.17. That is the structurally cheapest way to join a contract that settled 35.33 points above its own pivot with price over all five averages and the composite at its strongest direction. The stop is 7,735, under the first pivot support at 7,749.08 and under the 20-day average at 7,737.76. The first target is 7,847 (cash 7,779), Monday's completed-session high. The second is 7,883 (cash 7,814), the first pivot resistance. The third is 7,932 (cash 7,863), the second pivot resistance above the 7,905 annual high.
From the 7,785 midpoint of the zone the risk is 50 points. That is roughly 62 percent of the 14-day average true range of 80.02 and inside the 14-day average daily range of 82.30. Monday's realised 133.50 point span was 167 percent of that average true range, so a narrower Tuesday is the base expectation. A one-average-true-range projection from the 7,833.50 settlement gives 7,753.48 to 7,913.52. That envelope holds the entry zone and the first two targets and leaves the third above it.
Scenario ranges are analyst judgment and carry no calibration. The low-range case runs 7,805 to 7,870, the most likely 7,780 to 7,895 and the high-range case 7,735 to 7,930. The 14-day average daily range is 82.30 points and the 20-day is 73.19. Session by session the expected bands are 7,800 to 7,870 through Globex while the market holds above the 7,798 pivot, then 7,800 to 7,875 through European hours. The first hour from the 9:30 AM ET cash open is 7,805 to 7,880. Into the 4:00 PM ET close the band is 7,795 to 7,880, with settlement most likely inside 7,810 to 7,865.
The reopened session has already traded a 4.75 point band between 7,829.00 and 7,833.75, six percent of the 14-day average true range, on 3,232 contracts, after opening at 7,830.00 and quoting last near 7,834. Gains held without extension. Those figures belong to the new session dated Tuesday, September 22 and form no part of Monday's completed range.
Tuesday's slate carries speakers and one auction. European hours open with a central-bank speaker at 4:30 AM ET and a United Kingdom industrial orders survey at 6:00 AM ET with a consensus of minus 35 against a prior minus 25. Two further European central-bank speakers follow at 8:30 AM ET and an international financial institution address at 9:00 AM ET, all news-feed items, unconfirmed against the verified forward calendar. The morning is where it matters. A European consumer confidence flash lands at 10:00 AM ET with a consensus of minus 16 against a prior minus 15.5, and a United States central-bank speaker follows at 10:05 AM ET on the same unconfirmed basis. A central-bank vice chair speaks at 10:20 AM ET on discount window modernisation and Treasury market functioning, which reconciles to the verified forward calendar. Then the auction. The afternoon's set-piece is a two-year note auction at 1:00 PM ET with a prior high yield of 4.204 percent and a prior bid-to-cover of 2.600, alongside a further central-bank speaker at the same hour, both unconfirmed. A European central-bank speaker follows at 3:30 PM ET and Australian flash purchasing managers indices land at 7:00 PM ET, both unconfirmed. The verified forward calendar carries no large-capitalisation earnings inside the Tuesday window. The auction is the single first-order event for the index, with the speaker block from 10:05 AM ET through 1:00 PM ET a close second.
The most probable Tuesday is narrower and holds the pivot. It works the 7,847 to 7,851 band where Monday's session high and the one-month high sit 3.50 points apart. A clean break there opens the first pivot resistance at 7,883 and then the 7,905 annual high that has capped this market for a year. Below is the other case. A loss of 7,798 turns attention straight to the 7,735 to 7,753 band, where the 20-day average, the first pivot support, the 1 standard deviation support and two moving-average crossings overlap inside 18 points. That band is where a pullback should find its first genuine resistance to further decline. Given that index-level protection was accumulated into a 1.5 percent advance while at-the-money implied volatility sits near the low end of its annual range, a reversal tail carries more weight than the composite reading alone would suggest.
Seventy-five percent of Monday's single-stock hedging flow came from seven names, and the index that carried them settled 71.50 points under a ceiling that has held for a year.
The complete data picture
Every number behind Tuesday’s plan, charted first, then the full level map, then the complete numeric reference underneath.
Full numeric reference, every remaining figure from the session review
3.1 Resistance
8,016 (cash 7,948) is the third pivot resistance, the extended upside projection from Monday's range.
7,932 (cash 7,863) is the second pivot resistance, with the 2 standard deviations resistance band at 7,946.83 just above it.
7,914 (cash 7,845) is the 1 standard deviation resistance band, calculated on the closing price over the past five sessions.
7,905 (cash 7,837) is the 52-week high and the 13-week high in a single price, the structural ceiling of the past year.
7,889 (cash 7,820) is the computed target price, a short-horizon projection beneath the annual high.
7,883 (cash 7,814) is the first pivot resistance, the first mechanical projection above the market.
7,851 (cash 7,782) is the one-month high, sitting only 3.50 points above Monday's session high.
7,847 (cash 7,779) is Monday's completed-session high, derived from the pivot ladder, and the most important immediate level.
3.2 Support
7,834 (cash 7,765) is Monday's settlement, and the captured positioning note records a roughly 20,000-lot same-day-expiry call position at 7,765 cash as the largest single position of the day, at the same price as the cash settlement.
7,798 (cash 7,730) is the pivot point, the first mechanical support and the level that defines the constructive read.
7,753 (cash 7,685) is the 1 standard deviation support band, sitting 4.28 points above the first pivot support.
7,749 (cash 7,681) is the first pivot support, and the 7,735 to 7,745 grouping of the 20-day moving average, the 38.2 percent retracement from the four-week high and the 18-day and 40-day crossings sits immediately beneath, making 7,735 to 7,753 the densest support band in the structure.
7,714 (cash 7,645) is Monday's completed-session low, and the captured positioning note's modeled volatility threshold prints at 7,645 on cash against 7,711.8 on its own futures column, a pairing that carries the source's 66.8 point offset and not the basis measured here. The coincidence of the session low with that modeled threshold is the single most notable level alignment in this edition.
7,673 (cash 7,606) is the captured note's modeled gamma-flip level, published as 7,606 on cash and 7,672.8 on its own futures column, again carrying the source's own offset. It is a modeled underlying-price threshold produced by the provider's model and not a listed contract, and it moves as positioning changes; the source date is the September 21, 2026 evening edition.
7,665 (cash 7,596) is the second pivot support.
7,616 (cash 7,547) is the third pivot support, with the one-month low at 7,575.00 beneath it.
7,567 (cash 7,500) is the captured note's put-side hedging boundary, published as 7,500 on cash and 7,566.8 on its own futures column with the same source offset; unlike the two modeled thresholds above, this one sits on a listed strike.
3.3 Basis note
Cash equivalents above are derived with the 68.5 point basis measured for this session, computed as the 7,833.50 futures settlement less the 7,765 cash close. Where the captured positioning note publishes its own futures and cash pair, that pair is quoted verbatim and carries the source's own 66.8 point offset.
1. Session summary
The broad market had its strongest session since early August and the December contract settled at 7,833.50, having traded a completed range from 7,847.25 down to 7,713.75, a span of 133.50 points, with settlement landing 89.7 percent of the way up that range. The cash index closed at 7,765, up 1.5 percent, inside a 114 basis point intraday range. Settlement sits 35.33 points above the pivot point at 7,798.17, which leaves the mechanical ladder tilted higher into Tuesday.
The advance was narrow at its source and broad in its effect. META rose 11 percent on optimism around its new model offering and was the single largest contributor to the index gain, the semiconductor sector added 5 percent, and AMD, INTC and ARM rose 10, 12 and 17 percent respectively. Working alongside that, the front crude contract settled at 92.37 with the expiring contract down 4.51 percent as diplomatic activity around the Iran conflict reduced the supply premium, and lower energy lowers the headline inflation that sets the expected policy path.
Captured hedging-flow data shows single-stock flow at roughly plus 8 billion dollars of delta, the largest reading of the past 30 days, with 75 percent of it from the seven largest names, while index-level flow ran about minus 2 billion dollars, driven by same-day-expiry call selling and longer-dated put buying. The captured note also records a roughly 20,000-lot same-day-expiry call position at 7,765 cash as the largest single position of the day, which is precisely where the cash index settled.
Volatility expectations are framed off a 14-day average true range of 80.02 points, which is 1.02 percent of settlement, and a 14-day average daily range of 82.30 points. The volatility index closed at 14.86 and broad-index at-the-money implied volatility for Tuesday reads 9.9 percent, toward the lower end of the past year's range. The Primary Setup is a long on a pullback toward the pivot point, with the acknowledgement that the contract settled within 71.50 points of its own 52-week high and that index-level protection was being accumulated into the rally.
2.1 Intraday and session review
The completed December session is recovered from the published pivot ladder and not from an independently read bar. The outer pairs agree: the third-level resistance at 8,016.08 less the third-level support at 7,615.58, divided by three, gives 133.50, and the second-level pair of 7,931.67 and 7,664.67, divided by two, gives the same 133.50. Solving against a pivot point of 7,798.17 and a settlement of 7,833.50 returns a session high of 7,847.25 and a session low of 7,713.75, and those two values reproduce all seven published levels. No intraday series was captured for this run, so the sequence within the session is not asserted here.
Computed from the same high, low and settlement, the closing-range position is 89.7 percent. The cash index's own numbers, taken from the captured positioning note, are a 114 basis point intraday range and a close at 7,765, up 1.5 percent; the reference price in that note's table is 7,650, and 7,650 multiplied by 1.015 returns 7,764.75, which reproduces the stated close and confirms that the reference column is the prior-session close and not the current one.
The new Globex session dated Tuesday, September 22 opened at 7,830.00, has traded between 7,829.00 and 7,833.75, and was last quoted near 7,834 on 3,232 contracts. Those figures belong to the new session and are not part of Monday's completed range.
2.2 Daily structure
December carries 1,843,461 contracts of open interest, by a wide margin the deepest book of the four instruments in this package. The 5-day change is a gain of 140.75 points, or 1.83 percent. The 52-week high at 7,905.00 doubles as the 13-week high and sits 71.50 points, or 0.91 percent, above settlement, so the contract closed within one percent of its own annual peak without exceeding it.
The 1-month high at 7,850.75 sits just 3.50 points above Monday's session high of 7,847.25, which means the session tested the month's ceiling and stopped fractionally beneath it. The 1-month low at 7,575.00 and the 13-week low at 7,386.00 sit far below.
2.3 4-hour and swing structure
The higher-timeframe layout was read at the daily interval with the header showing the December contract at 7,834.25, and the 30-minute layout was read with the header showing 7,834.00. Both confirm the December contract.
The swing structure is a test of the upper boundary of a three-month range whose base sits at the 7,386.00 13-week low. The 38.2 percent retracement from the four-week high at 7,745.41 sits close to the 7,743.04 level at which price would cross its 40-day moving average and the 7,735.54 eighteen-day crossing, and that 7,735 to 7,745 grouping is the first structural shelf beneath the market.
2.4 Moving averages
The stack is bullish with price above every average. The 5-day sits at 7,706.45, the 20-day at 7,737.76, the 50-day at 7,709.48, the 100-day at 7,639.13 and the 200-day at 7,328.16. Settlement is 127.05 points above the 5-day and 505.34 points above the 200-day. The 20-day above the 50-day is the constructive ordering.
The distance from the 5-day average is the extension a mean-reverting session would target, and the 20-day at 7,737.76 coincides closely with the 7,735 to 7,745 retracement grouping identified above, which concentrates the first genuine support into a narrow band.
2.5 Oscillator and trend readings
The 14-day relative strength measure reads 58.60, up 9.43 points, with the 9-day at 63.02 and the 20-day at 56.71. None is near an overbought extreme, which is unusual given the position of price against its own annual high and suggests the advance has been built in steps and not in one impulse.
The 14-day raw stochastic is 94.95 percent with stochastic %K at 65.37 percent and %D at 42.90 percent; the raw reading is at the top of its band while the two smoothed lines are mid-range, the signature of a fresh push into the upper part of a range.
The 14-day directional index reads 15.45 with the positive directional indicator at 23.24 against the negative at 20.44, and the 9-day directional index is 23.37. A directional index in the mid-teens with the two indicators less than three points apart describes a range and not a trend, which sits in tension with a settlement one percent from the annual high. Historic volatility is 11.75 percent on the 14-day window and 12.21 percent on the 9-day, both low.
The multi-indicator composite prints 72 percent buy with the current strength reading average and the current direction reading strongest, while the composite trend signal reads hold; the short-term group is 80 percent buy, the medium-term 75 percent buy and the long-term 67 percent buy.
2.6 Volatility and expected range
The 14-day average true range is 80.02 points at 1.02 percent of settlement, the 9-day is 83.27 points at 1.06 percent and the 20-day is 79.71 points at 1.02 percent. The 14-day average daily range is 82.30 points at 1.05 percent and the 20-day average daily range is 73.19 points at 0.93 percent.
A one-average-true-range projection from the 7,833.50 settlement gives 7,753.48 to 7,913.52 for Tuesday. The captured positioning note publishes an implied one-day move of 1.00 percent on the cash index and an at-the-money implied volatility of 9.9 percent for Tuesday, and its implied one-day high and low print at 7,770.38 and 7,616.52 on cash; those two are the source's own published pair and are quoted here verbatim and not recomputed. Monday's realised 133.50 point span was 167 percent of the 14-day average true range, so a narrower Tuesday is the base expectation.
4.1 Dollar, rates and policy
Policy is tightening into an equity advance, which is the defining tension of this environment. Investment-bank commentary in the news feed records a unanimous 25 basis point hike in September that lifted the target range to 3.75 to 4.00 percent. Projections published at 2:00 PM ET on September 16 show 12 of 18 officials expecting one further 25 basis point increase this year, four expecting two and two expecting none.
On Monday afternoon a regional policymaker said at 2:19 PM ET that interest rates likely need to rise further to tame inflation that is both demand and supply driven, added at 2:20 PM ET that it is better for increases to be earlier and incremental than later and larger, said at 2:20 PM ET that the commodity shock extends beyond oil into base metals such as copper, and noted at 2:39 PM ET that core inflation may be running a full percentage point above target. The dollar index rose 0.20 percent on that commentary.
Longer-dated yields slipped on the day according to the captured positioning note, while investment-bank commentary in the news feed described yields pushing toward 5 percent over the prior week, a characterisation that is unconfirmed against any verified series captured in this run. A precise 10-year level was not captured and is not asserted here.
4.2 Large-cap leadership and earnings
Leadership was extremely concentrated. META rose 11 percent and was the largest single contributor to the index advance, with the captured positioning note recording roughly plus 2 billion dollars of hedging flow in that name and a 76 dollar move against a 16 dollar implied move.
The semiconductor complex added 5 percent, with AMD up 10 percent and crossing a one trillion dollar market capitalisation for the first time at 10:16 AM ET, INTC up 12 percent and ARM up 17 percent. GOOGL unveiled artificial-intelligence laptops priced from 899 dollars at 9:02 AM ET.
The verified forward calendar carries no large-capitalisation earnings inside the Tuesday window; the nearest captured after-close report is a large retailer on September 24, 2026 at 5:00 PM ET.
4.3 Geopolitical backdrop
The geopolitical premium drained out of commodities and that fed the equity advance. Iran's foreign minister arrived in New York for the United Nations General Assembly at 4:14 PM ET and Qatar stated at 3:02 PM ET that it was working to facilitate an agreement between Iran and the United States. The front crude contract settled at 92.37 and the expiring contract fell 4.51 percent.
Cutting against the de-escalation narrative, an armed group closed a valve on Libya's Sharara pipeline at 3:30 PM ET, and the crude market absorbed that interruption without a meaningful bid.
4.4 Sector breadth and rotation
Breadth was not captured as a series in this run, so no advance-decline or volume-differential figure is asserted here. What the captured data does show is a distribution of flow that is the opposite of broad: 75 percent of the plus 8 billion dollars of single-stock hedging flow came from the seven largest names.
The accompanying minus 2 billion dollars of index-level flow, built on same-day-expiry call selling and longer-dated put buying, indicates that the index itself was a source of protection demand while the individual names were being chased. That configuration describes a rally carried by a small number of very large names and not by a rotation.
4.5 Cross-asset and volatility
The volatility complex barely moved through a 1.5 percent cash advance. The volatility index closed at 14.86, up 0.07, and the volatility-of-volatility index at 85.77, both described as relatively flat in the captured positioning note. Fixed-strike volatility rose 1 to 3 points across the surface, and at-the-money implied volatility for Tuesday reads 9.9 percent, toward the lower end of the past year's range, which the note frames as leaving long index options at relatively attractive risk and reward.
Crude settled sharply lower, gold's December contract settled at 4,383.9 and was close to unchanged, and the dollar firmed 0.20 percent. Low implied volatility alongside index-level protection buying is an unusual pairing and is the cleanest signal available that the rally is being hedged and not trusted.
4.6 Institutional positioning
The captured positioning table gives the cash index a reference price of 7,650, which is the prior-session close. The gamma index reads 0.587 on the cash index and minus 0.497 on the exchange-traded fund, so the two surfaces disagree in sign. Gamma tilt reads 1.051 on the index and 0.647 on the fund, and gamma notional reads 299.212 million dollars on the index against minus 921.234 million on the fund.
Call volume ran 720,408 contracts on the index against put volume of 1.132 million, and call open interest reads 8.55 million against put open interest of 12.17 million, so puts exceed calls on both volume and open interest. The 25-delta risk reversal reads minus 0.04 on the index and zero on the fund, a very mild skew.
The published key levels for the cash index are 8,000, 7,700, 7,600 and 7,000, and the note's own narrative levels list resistance at 7,700, 7,720, 7,760 and 7,800 with support at 7,600 and 7,350 and a pivot at 7,590 carrying a September 10, 2026 update stamp.
5. Index options flow context
The index positioning dataset for this run comes from the evening note published at 5:26 PM ET on September 21, 2026, supplemented by an index positioning hub row.
The published dealer-positioning levels on the cash index are a modeled volatility threshold at 7,645, a modeled gamma-flip level at 7,606, a primary gamma concentration strike at 8,000, a call-side hedging boundary at 8,100 and a put-side hedging boundary at 7,500. The note publishes its own futures column alongside each, at 7,711.8, 7,672.8, 8,066.8, 8,166.8 and 7,566.8 respectively, a uniform 66.8 point offset that is the source's own and is not the 68.5 point basis measured for this session. The volatility threshold and the gamma-flip level are modeled underlying-price thresholds produced by the provider's model and not listed contracts, and they move as positioning changes; the concentration strike and the two hedging boundaries sit on listed strikes. All five carry the September 21, 2026 evening source date.
The mechanically important observation is that Monday's completed-session low of 7,713.75 on the futures sits within two points of the note's own futures-column volatility threshold at 7,711.8, and the corresponding cash level of 7,645 is where that threshold prints. A session that traded down to the modeled volatility threshold and settled 119.75 points above it is the cleanest example in this package of positioning acting as a reference and not as an accident.
The index positioning hub row, carrying a build stamp of September 19, 2026, shows call gamma of 8.7 billion against put gamma of minus 1.8 billion, next-expiry gamma of 37.28 percent and next-expiry delta of 14.17 percent. One discrepancy is recorded explicitly: that hub's previous-close field reads 7,637.76 while the note's reference price for the same index reads 7,650, and the hub's current-price field of 7,761.10 is an intraday snapshot and not the 7,765 close. The hub is therefore treated as a dated build and its figures are used as lower-confidence context only; no level in the key-levels section is sourced from it.
6.1 Night Session (6:00 PM ET Monday to 3:00 AM ET Tuesday, Globex and Asia)
The reopened session has traded a 4.75 point band between 7,829.00 and 7,833.75, which is 6 percent of the 14-day average true range and describes a market holding its gains without extending them. Expected Globex range is 7,800 to 7,870 while the market holds above the 7,798 pivot point. The captured calendar's first item of the new day is a European central-bank speaker at 4:30 AM ET, reported by the news-feed calendar captured for this run and unconfirmed against the verified forward calendar.
6.2 London Session (3:00 AM to 8:00 AM ET Tuesday)
European hours carry macro items and not index drivers. Expected range 7,800 to 7,875. The captured calendar carries a European central-bank speaker at 4:30 AM ET, a United Kingdom industrial orders survey at 6:00 AM ET with a consensus of minus 35 against a prior minus 25, two further European central-bank speakers at 8:30 AM ET and an international financial institution address at 9:00 AM ET, all news-feed items, unconfirmed against the verified forward calendar.
6.3 Morning Session (9:30 AM to 12:00 PM ET Tuesday, regular trading hours open)
The cash open at 9:30 AM ET sets the session's first directional test, and the question it answers is whether Monday's concentrated advance broadens. Expected first-hour range 7,805 to 7,880. The captured calendar carries a European consumer confidence flash at 10:00 AM ET with a consensus of minus 16 against a prior minus 15.5 and a United States central-bank speaker at 10:05 AM ET, both news-feed items, unconfirmed against the verified forward calendar, and a United States central-bank vice chair speaking at 10:20 AM ET on discount window modernisation and Treasury market functioning, which reconciles to the verified forward calendar.
6.4 Afternoon Session (12:00 PM to 4:00 PM ET Tuesday)
The afternoon's set-piece is a two-year note auction at 1:00 PM ET with a prior high yield of 4.204 percent and a prior bid-to-cover of 2.600, reported by the news-feed calendar captured for this run and unconfirmed against the verified forward calendar, alongside a further United States central-bank speaker at the same hour, also unconfirmed. Expected range into the 4:00 PM ET cash close is 7,795 to 7,880, with settlement most likely inside 7,810 to 7,865.
6.5 Night Session Forward (6:00 PM ET Tuesday)
Residual bias into the Globex reopen is constructive while the December contract holds above the 7,798 pivot point, with 7,847 and then the 7,851 one-month high as the objectives and the 7,905 annual high as the structural ceiling. Attention then turns to the United States flash purchasing managers indices on September 23, 2026 at 9:45 AM ET, reported by the news-feed calendar with a composite consensus of 54.8 against a prior 56.0 and unconfirmed against the verified forward calendar.
6.6 Expected Range (Tuesday full session)
Low-range scenario: 7,805 to 7,870
Mid-range scenario (most likely): 7,780 to 7,895
High-range scenario: 7,735 to 7,930
6.7 Most Likely Path
The most probable Tuesday is a narrower session that holds the 7,798 pivot point and works the 7,847 to 7,851 band where Monday's session high and the one-month high sit 3.50 points apart. A clean break there opens the first pivot resistance at 7,883 and then the 7,905 annual high, which is the level that has capped this market for a year.
A loss of 7,798 turns attention to the 7,735 to 7,753 band where the 20-day moving average, the first pivot support, the 1 standard deviation support and two moving-average crossings overlap inside 18 points, and that band is where a pullback should find its first genuine resistance to further decline. Given that index-level protection was accumulated into a 1.5 percent advance while at-the-money implied volatility sits near the low end of its annual range, a reversal tail carries more weight than the composite reading alone would suggest.
7. Tuesday economic calendar
The captured calendar for Tuesday contains European and United States policy speakers, a European consumer confidence flash and a two-year note auction, all reported by the news feed and unconfirmed against the verified forward calendar except where noted. The overnight Asian block contains speaker items only.
European hours open with a central-bank speaker at 4:30 AM ET and a United Kingdom industrial orders survey at 6:00 AM ET with a consensus of minus 35 against a prior minus 25, then two further European central-bank speakers at 8:30 AM ET and an international financial institution address at 9:00 AM ET.
The United States morning carries a European consumer confidence flash at 10:00 AM ET with a consensus of minus 16 against a prior minus 15.5 and a central-bank speaker at 10:05 AM ET, both news-feed items and unconfirmed, followed by a central-bank vice chair at 10:20 AM ET speaking on discount window modernisation and Treasury market functioning, which reconciles to the verified forward calendar.
The afternoon carries a two-year note auction at 1:00 PM ET with a prior high yield of 4.204 percent and a prior bid-to-cover of 2.600, plus a central-bank speaker at the same hour, both news-feed items and unconfirmed. A European central-bank speaker follows at 3:30 PM ET and Australian flash purchasing managers indices land at 7:00 PM ET, both news-feed items and unconfirmed.
The single first-order event for the index on Tuesday is the two-year note auction at 1:00 PM ET, reported by the news feed and unconfirmed against the verified forward calendar, with the speaker block from 10:05 AM ET through 1:00 PM ET a close second.
Looking further out, the verified forward calendar carries new residential sales on September 24, 2026 at 10:00 AM ET, a senior credit officer survey on September 24, 2026 at 2:00 PM ET, a large retailer's results after the close on September 24, 2026 at 5:00 PM ET and the advance durable goods report on September 25, 2026 at 8:30 AM ET. The captured news-feed calendar also carries quarter end on September 30, 2026, reported by the news feed and unconfirmed against the verified forward calendar.
8. Primary trade setup
Direction: Long
Rationale: The December contract settled 35.33 points above its own pivot point at 7,798.17 with price above all five moving averages and the composite reading 72 percent buy at its strongest direction, and a pullback toward the pivot is the structurally cheapest way to join that without buying within 14 points of the session high.
Entry Zone: 7,770 to 7,800
Stop Loss: 7,735, beneath the first pivot support at 7,749.08 and beneath the 20-day moving average at 7,737.76, which places it under the densest support band in the structure
Target 1 (T1): 7,847 (cash 7,779), Monday's completed-session high
Target 2 (T2): 7,883 (cash 7,814), the first pivot resistance, the first mechanical projection above the market
Target 3 (T3, extended): 7,932 (cash 7,863), the second pivot resistance, above the 7,905 annual high
Risk-to-Reward: Approximately 1:1.2 to T1, 1:2.0 to T2 and 1:2.9 to T3. Measured from the 7,785 midpoint of the entry zone against the 7,735 stop, risk is 50 points, roughly 62 percent of the 14-day average true range of 80.02.
Invalidation: A sustained session beneath 7,735 negates the long thesis, because that level sits under the 20-day moving average, the first pivot support and the 1 standard deviation support band together, and turns attention to the 7,714 session low and the modeled volatility threshold beneath it.
Macro override: A weak two-year note auction at 1:00 PM ET, reported by the news-feed calendar captured for this run and unconfirmed against the verified forward calendar, a hawkish surprise from the 10:05 AM ET or 10:20 AM ET speakers, or an adverse headline in the concentrated leadership names would invert this setup in real time. A dovish tone with continued semiconductor leadership would accelerate it.
Sources and methodology
This outlook is built from our session review of the December E-mini S&P 500 contract, the December ’26 contract, prepared after Monday's close on September 21, 2026. The completed session is recovered from the published pivot ladder: the outer pivot pairs agree on a 133.50 point span, and solving against the 7,798.17 pivot point and the 7,833.50 settlement returns the 7,847.25 high and the 7,713.75 low, which reproduce all seven published levels. No intraday series was captured for this run, so no claim is made about the order of events inside the session.
Cash equivalents are derived with the 68.5 point basis measured for this session, the 7,833.50 futures settlement less the 7,765 cash close. Where the captured positioning note publishes its own futures and cash pair, that pair is quoted verbatim and carries the source's own 66.8 point offset. The modeled volatility threshold and the modeled gamma-flip level are model outputs and not listed contracts, and they move as positioning changes. Scenario ranges are analyst judgment and carry no calibration. Scheduled items marked unconfirmed come from the news-feed calendar captured for this run and were not verified against the verified forward calendar. Breadth as a series, a precise 10-year yield level and the 9-day directional components were not captured in this run and no figure is asserted for them.
Monday’s outlook for this contract is here, and the Nasdaq-100 contract closed above every average on the same session. Outlooks for ES, NQ, GC and CL are collected on the market outlook page, and our forward trading record is on the performance statement.



