
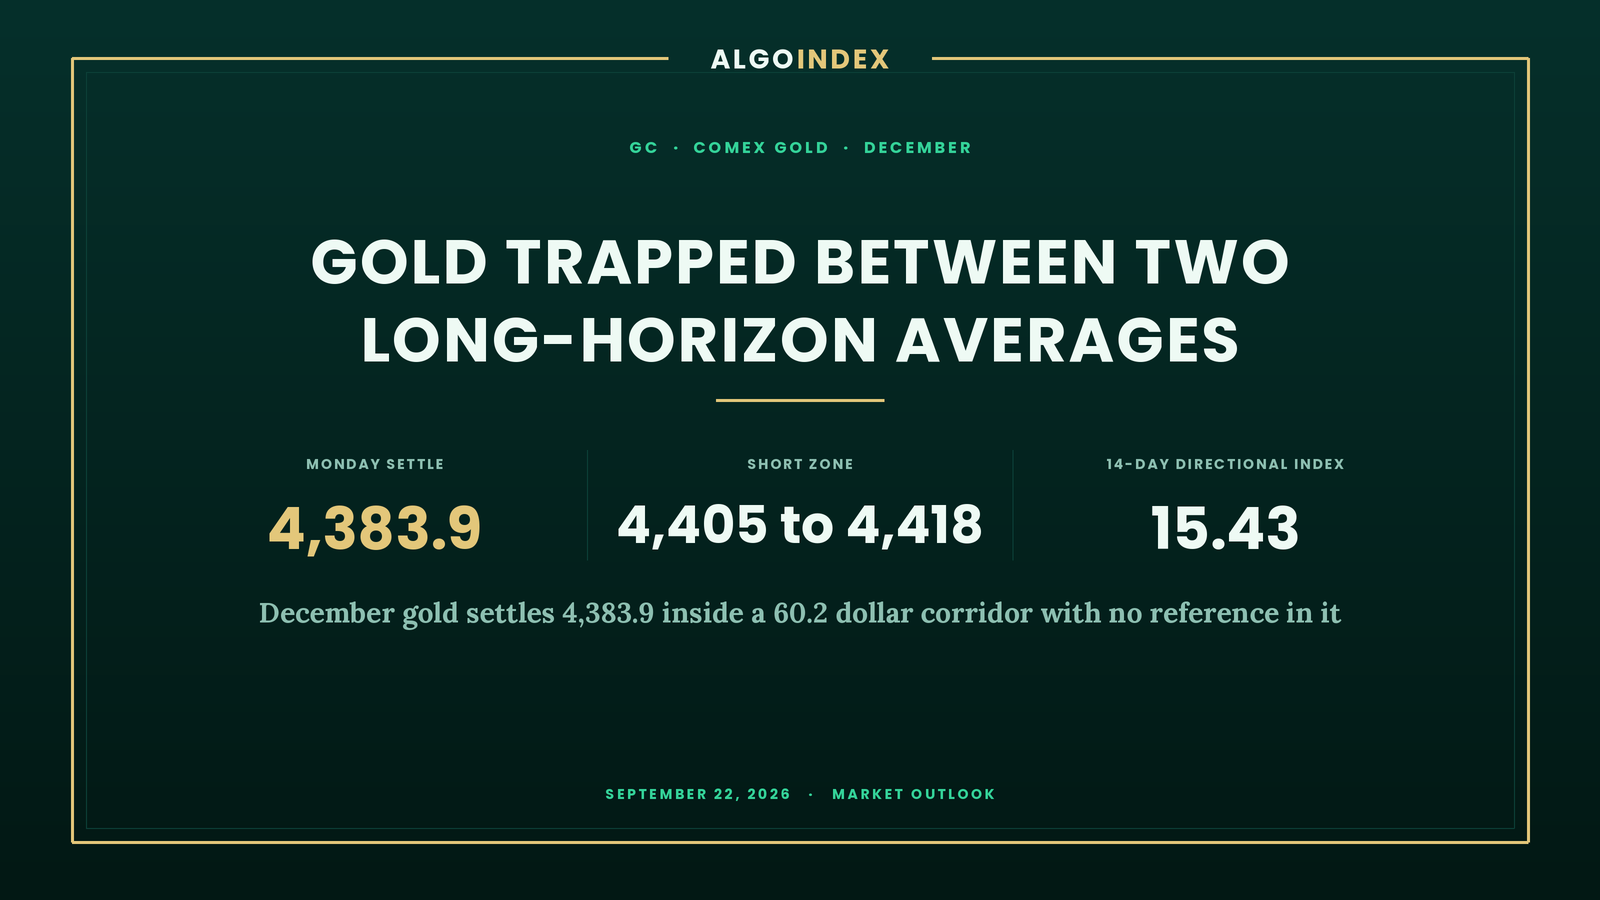
Between the 50-day average at 4,347.0 and the 100-day at 4,407.2 there is nothing. That corridor is 60.2 dollars wide, and December gold spent Monday inside it, settling at 4,383.9 after a completed session that ran 4,422.2 down to 4,360.4. The span came to 61.8 dollars. Settlement landed 4.9 dollars beneath the contract's own Pivot Point at 4,388.8, and 38 percent of the way up the day's range. That is the arithmetic of distribution.
Two forces pulled against each other all afternoon and both left marks. The dollar index rose 0.20 percent on hawkish central-bank commentary. A regional policymaker said at 02:19 PM ET that interest rates likely need to rise further to tame inflation that is both demand and supply driven. A firmer dollar and a higher expected policy path are conventional headwinds for a metal that pays nothing. Then the same official said at 02:39 PM ET that core inflation may be running a full percentage point above target, which is the argument for owning bullion in the first place. They cancelled. What survives the cancellation is the compression. Monday's 61.8 dollar span was 58 percent of a 105.6 dollar average true range, and a narrow day in a wide-range contract is the fact that carries into Tuesday.
December gold settled at 4,383.9, 4.9 dollars beneath the 4,388.8 Pivot Point. It sits inside the 60.2 dollar corridor between the 50-day average at 4,347.0 and the 100-day at 4,407.2. Overhead, the 4,405 to 4,418 window stacks the 100-day at 4,407.2, Pivot R1 at 4,417.2 and the 1 standard deviation band at 4,417.6 inside 11 dollars. That makes 4,417 the tightest confluence in the structure. Beneath, the first genuine demand area runs 4,355 to 4,360, holding Monday's completed-session low at 4,360.4 and Pivot S1 at 4,355.4. Two edges, nothing in between. The 14-day directional index reads 15.43, with the positive indicator at 15.83 against the negative at 16.69. That is what no trend looks like. The primary setup is a short from 4,405 to 4,418, stop 4,440, targets 4,360, 4,327 and 4,294. Tuesday's single first-order event is a two-year note auction at 01:00 PM ET, reported by the news feed and unconfirmed against the verified forward calendar.
Where Monday left the 4,385 long
Monday's outlook set a long from 4,385 to 4,397, stop 4,358, targets 4,440, 4,452 and 4,480. Monday's completed session ran 4,422.2 to 4,360.4 and settled at 4,383.9. The band was traded, so a fill was there. The stop survived by 2.4 dollars, because the session low at 4,360.4 stopped that far above 4,358. The first target never came into view. The session high at 4,422.2 finished 17.8 beneath 4,440. And the settlement at 4,383.9 printed 1.1 dollars beneath the lower edge of the entry band, which puts the long under water at the close. It failed. The published invalidation, a settlement beneath 4,360.8, was never triggered, so the thesis was not formally broken. The position still paid nothing. One caveat belongs with that account. This run captured no intraday series, so nothing here asserts whether the low preceded a fill or followed it.
Monday's own macro read is where the session gets interesting. Two regional policymakers were quoted through the afternoon saying policy may need to tighten further to restore price stability. One added at 02:20 PM ET that the commodity shock extends beyond oil into base metals such as copper. The same official argued that earlier, incremental rate increases are preferable to later and larger ones, and put inflation stripped of supply factors at up to 3 percent at 02:20 PM ET. Commentary also noted that the dollar's advance was limited because the crude collapse eased inflation expectations, which softens the case for further tightening. The yield side needs care. Longer-dated Treasury yields slipped on the day according to the positioning note. News-feed commentary describing yields pushing toward 5 percent over the prior week is unconfirmed against any verified series captured in this run, and a precise 10-year yield level was not captured. None is asserted here. Nominal yields eased while the dollar firmed, so real yields sat roughly unchanged. That is the cleanest explanation for a metal that went nowhere with conviction.
A corridor 60.2 dollars wide, and nothing in it
Start with the stack, because it is broken and mixed. The 5-day average sits at 4,385.8, within 2 dollars of settlement. The 20-day at 4,477.3 is 93.4 dollars above and the 50-day at 4,347.0 is 36.9 dollars below. The 100-day at 4,407.2 is 23.3 dollars above, the 200-day at 4,648.7 a further 264.8 dollars above. Above one, beneath three. The ordering carries the sharper message. A 50-day above a 100-day is the bullish configuration, and here the 50-day sits underneath, which is the clearest single statement of the medium-term condition.
Pull the camera back and the drawdown swamps everything. The contract trades 24.2 percent below its 52-week high at 5,781.8. Measured from settlement, that high sits 31.89 percent above the market and the 52-week low at 3,885.1 sits 11.38 percent below. That places December in the lower half of its annual distribution. The 1-month high at 4,755.0 doubles as the 13-week high. The 1-month low at 4,273.3 sits 110.6 dollars beneath settlement, leaving price in the lower third of its own one-month range. December carries 314,578 contracts of open interest. The 5-day change is a gain of 32.0 dollars, or 0.74 percent, so the past week has been net constructive despite Monday's mild give-back.
Quarterly geometry puts the settlement almost exactly where the quarter began. Swing structure is framed by the 4,755.0 quarter high above and the 4,015.6 13-week low below. The 50 percent retracement between them sits at 4,385.3, within 1.4 dollars of Monday's close. The nearest Fibonacci grouping above is the 38.2 percent retracement from the 13-week high at 4,472.5 and the 38.2 percent retracement from the four-week low at 4,457.3. Contract identity checks out. The higher-timeframe layout was read at the daily interval with the header showing GC1! at 4,389.5, and the 30-minute layout with the header showing GC1! at 4,389.0. Both confirm December.
Momentum agrees with the absence of direction on every horizon captured. The 14-day relative strength measure reads 46.58, down 3.33 points, with the 9-day at 43.64 and the 20-day at 48.39. All three sit beneath the midpoint and none is near oversold. The 14-day raw stochastic is 38.78 percent, with stochastic %K at 40.81 percent and %D at 33.27 percent, a set in the lower third of its band. Then the trend measure, which is the one worth staring at. The 14-day directional index reads 15.43, with the positive directional indicator at 15.83 against the negative at 16.69. Barely a point. The marginal lead of the negative indicator buys a slight bearish tilt and no direction. The multi-indicator composite prints hold overall, with the current direction reading bearish. Its short-term group reads 20 percent sell, its medium-term group 75 percent buy and its long-term group 67 percent sell. That is what a range looks like when every horizon is polled separately.
The 14-day average true range is 105.6 dollars, or 2.41 percent of settlement. Volatility frames everything above, and volatility is falling. The 9-day reads 103.6 dollars at 2.36 percent and the 50-day 111.2 dollars at 2.54 percent. The 14-day average daily range is 108.0 dollars at 2.46 percent and the 20-day average daily range is 106.9 dollars. Historic volatility reads 19.15 percent on the 14-day window and 13.18 percent on the 9-day. That drop from the longer window to the shorter is the compression already visible in the price. One average true range projected from the 4,383.9 settlement gives 4,278.3 to 4,489.5 for Tuesday. Monday delivered 58 percent of normal.
The complex moved hard and gold stood still
Energy did the heavy lifting on Monday, and it cuts against this metal through the inflation-expectations channel. The expiring October crude contract settled at 95.78, down 4.51 percent, and the international crude benchmark settled at 100.34, down 3.4 percent. The front WTI contract for November settled at 92.37. Lower energy lowers headline inflation, which lowers demand for an inflation hedge. Pushing back on that, an oil-major chief executive noted at 10:57 AM ET that too much refining capacity is offline ahead of winter and refined products remain historically tight. So the disinflation implied by the crude print may be narrower than the headline suggests. Equities rallied hard. The broad index closed up 1.5 percent, and a strong risk session is a conventional drag on defensive allocations.
Diplomacy drained the geopolitical premium out of the whole complex. Iran's foreign minister arrived in New York for the United Nations General Assembly at 04:14 PM ET. Qatar stated at 03:02 PM ET that it was working to facilitate an agreement between Iran and the United States. Crude fell 4.51 percent on the front contract in response. Gold declined to follow. That refusal is informative. Either the metal was not carrying much war premium to begin with, or monetary demand is offsetting the release of it.
Policy is the dominant variable for this contract, and it is tightening. Investment-bank commentary in the news feed records a unanimous 25 basis point hike in September that lifted the target range to 3.75 to 4.00 percent. Projections published at 02:00 PM ET on September 16 show 12 of 18 officials expecting one more 25 basis point increase this year. Four expect two, and two expect none. A rising policy rate raises the opportunity cost of holding a non-yielding asset. That gold has held a 4,300 handle through a hiking cycle with the dollar firm is itself the notable fact.
Structural demand is a gap in this run, and it gets recorded as one. No central-bank purchase data and no fund-flow series was captured, so nothing here quantifies official-sector buying. The adjacent signal is a firmer Chinese currency noted in Monday's market commentary, described as limiting the dollar's gains. A stronger yuan lowers the local-currency cost of bullion for the largest physical market. A Chinese state visit to the United States is listed in the news-feed calendar as an all-day item on September 24, 2026, unconfirmed against the verified forward calendar. Trade and currency outcomes from it would matter more to gold than any scheduled release this week. Commitments-of-traders data and fund-holdings series went uncaptured too. Speculative length is therefore not quantified, and open interest in the December contract at 314,578 is the single quantified positioning figure this edition holds.
One positioning dataset did come through. It belongs to the bullion exchange-traded fund and not to the futures contract. The fund tracks bullion at roughly one eleventh of the metal's price, with a management-fee drag and no clean basis to December. It is read qualitatively here and never translated into futures prices. The captured row, stamped September 19, 2026, shows the fund at 398.24 against a previous close of 398.36 on volume of 7,581,577 shares. Its 52-week high is 509.70 and its 52-week low 333.81. Now the part that matters. Call gamma reads minus 317 million and put gamma reads plus 198 million. That sign pattern inverts the index complex captured in the same run, where the broad index shows positive call gamma and negative put gamma. It describes dealers positioned short call-side convexity and long put-side convexity in the metal. Mechanically that tends to amplify an upside move and dampen a downside one, the reverse of the stabilising effect a long-call-gamma book provides. Next-expiry gamma reads 23.50 percent and next-expiry delta 8.60 percent, both moderate. One caveat is recorded explicitly. The hub's low volatility point renders at 500 while its high volatility point renders at 410, the documented label inversion in which the two fields present the wrong way round. Both are treated as low-confidence and excluded from the level structure.
The trade map for Tuesday
Supply is dense and it is close. The primary setup is a short into 4,405 to 4,418. That window stacks the 100-day average at 4,407.2, Pivot R1 at 4,417.2 and the 1 standard deviation resistance band at 4,417.6 inside 11 dollars. It is the densest supply in the near structure. Risk sits above the band. The stop is 4,440, above the 2 standard deviation resistance band at 4,431.5 and beneath Pivot R2 at 4,450.6. The first target is 4,360, Monday's completed-session low at 4,360.4 and the first structural magnet. The second is 4,327, Pivot S2, with the 3 standard deviation support band at 4,325.6 alongside. The third is 4,294, Pivot S3, reachable only on a break of the 50-day average at 4,347.0.
Compression is the argument for range expansion, and the reopened session is making it louder. The new Globex session dated Tuesday, September 22 opened at 4,382.5, has traded between 4,382.0 and 4,390.4, and was last quoted near 4,389.0 on 935 contracts. That is an 8.4 dollar band. Call it 8 percent of a normal day's range, remarkably narrow against a 105.6 dollar average true range. Asian hours are where physical demand usually shows itself. A compressed reopen into that window raises the odds of an expansion. Expected Globex range is 4,360 to 4,410, with a mild downside skew while the market holds beneath the 4,388.8 Pivot Point. One item opens the new day. The captured calendar lists a European central-bank speaker at 04:30 AM ET, reported by the news-feed calendar and unconfirmed against the verified forward calendar.
London sets the physical benchmark, and it is where the dollar cross usually asserts itself. Expected range is 4,365 to 4,415, with the 100-day average at 4,407.2 as the ceiling reference. The captured calendar then carries a United Kingdom industrial orders survey at 06:00 AM ET, consensus minus 35 against a prior minus 25. Two further European central-bank speakers follow at 08:30 AM ET, and an international financial institution address at 09:00 AM ET. All of those are reported by the news-feed calendar and unconfirmed against the verified forward calendar. None of it is a gold-specific driver. The metal's London direction is more likely to come from the dollar than from any print.
The cash open at 09:30 AM ET sets the session's first directional test. The morning then carries the densest speaker block of the day. Expected first-hour range is 4,370 to 4,412. A European consumer confidence flash lands at 10:00 AM ET, consensus minus 16 against a prior minus 15.5. A United States central-bank speaker follows at 10:05 AM ET, both items reported by the news-feed calendar and unconfirmed against the verified forward calendar. Then a United States central-bank vice chair speaks at 10:20 AM ET on discount window modernisation and Treasury market functioning, which reconciles to the verified forward calendar. Policy expectations are this metal's dominant driver. So the speaker block matters more to gold than the data does.
One o'clock is the hinge. The afternoon's set-piece is a two-year note auction at 01:00 PM ET, prior high yield 4.204 percent and prior bid-to-cover 2.600. A further United States central-bank speaker lands at the same hour, and both items are reported by the news-feed calendar and unconfirmed against the verified forward calendar. The two-year sector prices the policy path that sets the opportunity cost of holding bullion. A tail there transmits to gold faster than a long-end result would. Expected range into the 04:00 PM ET equity close is 4,365 to 4,415, with settlement most likely inside 4,375 to 4,405. A European central-bank speaker follows at 03:30 PM ET, and Australian flash purchasing managers indices land at 07:00 PM ET, both news-feed items and unconfirmed.
Scenario ranges are analyst judgment and carry no derived frequency. The low-range case runs 4,370 to 4,410, the most likely case 4,350 to 4,425 and the high-range case 4,300 to 4,470. Three cases, one ladder. One average true range around the settlement spans 4,278.3 to 4,489.5. Residual bias into the 06:00 PM ET Globex reopen on Tuesday is neutral to mildly lower. That holds while December sits beneath the 4,388.8 Pivot Point and inside the 4,347.0 to 4,407.2 moving-average corridor. Attention then turns to the United States flash purchasing managers indices on September 23, 2026 at 09:45 AM ET. The news-feed calendar carries composite consensus 54.8 against a prior 56.0, unconfirmed against the verified forward calendar. Further out, the verified forward calendar carries new residential sales on September 24, 2026 at 10:00 AM ET and the advance durable goods report on September 25, 2026 at 08:30 AM ET.
The most probable Tuesday keeps the December contract inside the 4,347.0 to 4,407.2 corridor. It resolves the compression with a range expansion and no trend. The 4,407 to 4,418 area is where the 100-day average, Pivot R1 and the 1 standard deviation band overlap within 11 dollars. A failure there points back toward the 4,355 to 4,360 demand band. A settlement beneath 4,347.0 changes the medium-term read and opens Pivot S2 at 4,327.0. A reclaim of 4,417 on a sustained basis would put the 4,450.6 Pivot R2 and the 4,477.3 twenty-day average in play. That path needs policy to soften.
Sixty point two dollars of empty corridor, and a two-year note auction at 01:00 PM ET to decide which edge gives first.
The complete data picture
Every number behind Tuesday’s plan, charted first, then the full level map, then the complete numeric reference underneath.
Full numeric reference, every remaining figure from the session review
Carried below in the review's own order: the session summary from section 1, sections 2.1 to 2.6, the level notes behind sections 3.1 and 3.2, sections 4.1 to 4.6, the fund options-surface context from section 5, the session-by-session forecast from section 6, the Tuesday calendar from section 7 and the primary setup from section 8.
Level notes (3.1 Resistance and 3.2 Support)
4,388.8 is the Pivot Point, computed from Monday's completed session, and it is the first mechanical test; settlement 4.9 dollars beneath it leaves the immediate read marginally negative.
4,394.2 is the computed target price, a short-horizon projection sitting just above the pivot.
4,407.2 is the 100-day moving average, the most important single level above the market because it caps the corridor gold has been trapped in.
4,417.2 is Pivot R1, and the 1 standard deviation resistance band at 4,417.6 sits within half a dollar of it, making 4,417 the tightest confluence in the structure.
4,431.5 is the 2 standard deviation resistance band, calculated on the closing price over the past five sessions.
4,450.6 is Pivot R2, with the 3 standard deviation band at 4,442.2 just beneath it.
4,457.3 and 4,472.5 form the Fibonacci grouping above, the 38.2 percent retracements from the four-week low and the 13-week high respectively.
4,479.0 is Pivot R3, the extended upside projection from Monday's range, and the 20-day moving average at 4,477.3 sits directly on it, which makes that pairing the ceiling of any single-session advance.
4,385.3 is the 50 percent retracement from the 13-week high and low, effectively the settlement itself and the midpoint of the quarterly range.
4,382.0 is the low of the new Globex session dated Tuesday, the nearest reference the reopened market has set.
4,373.9 is the level at which the 3-day and 10-day moving average crossover stalls, a short-horizon shelf.
4,360.4 is Monday's completed-session low, derived from the pivot ladder, and it is the first structural level whose loss would matter.
4,355.4 is Pivot S1, sitting 5.0 dollars beneath the session low, so the 4,355 to 4,360 band is the first genuine demand area.
4,350.2 is the 1 standard deviation support band, reinforcing that same area.
4,347.0 is the 50-day moving average and the base of the corridor that has contained the market; a settlement beneath it changes the medium-term read.
4,327.0 is Pivot S2, with the 3 standard deviation support band at 4,325.6 immediately below.
4,293.6 is Pivot S3, and the 1-month low at 4,273.3 sits just beneath, the extended downside objective.
1. Executive summary
Gold spent Monday going nowhere with conviction. The December contract settled at 4,383.9 after a completed session that ran from 4,422.2 down to 4,360.4, a span of 61.8 dollars, and finished 4.9 dollars beneath its own Pivot Point at 4,388.8. The settlement sits 38 percent of the way up the day's range, which is the arithmetic of a market that spent the session distributing and not trending.
The day's cross-currents were unusually direct. The dollar index rose 0.20 percent on hawkish central-bank commentary, with two regional policymakers quoted through the afternoon saying policy may need to tighten further to restore price stability, and one adding at 02:20 PM ET that the commodity shock extends beyond oil into base metals such as copper. A firmer dollar and a higher expected policy path are both conventional headwinds for a non-yielding metal. Against that, the same official said at 02:20 PM ET that inflation stripped of supply factors is still too high at up to 3 percent, which is the argument for owning gold in the first place. Those two forces cancelled, and the day's price action reflects it.
The structural contradiction heading into Tuesday is that gold is caught between two long-horizon averages with nothing between them. The 50-day average sits at 4,347.0 beneath the market and the 100-day at 4,407.2 above it, a corridor 60.2 dollars wide that contains the settlement, the Pivot Point and the entire reopened Globex session so far. The 20-day average at 4,477.3 and the 200-day at 4,648.7 are both far above, and the contract trades 24.2 percent below its 52-week high at 5,781.8, a drawdown that dominates any single-session read.
Volatility expectations should be framed off a 14-day average true range of 105.6 dollars, which is 2.41 percent of settlement, and a 14-day average daily range of 108.0 dollars, which is 2.46 percent. Monday's 61.8 dollar span was therefore only 58 percent of a normal day, which is itself a signal: the metal compressed while the rest of the complex moved hard. The primary setup below is a short into the 4,405 to 4,418 area, where the 100-day average and Pivot R1 overlap, with the explicit acknowledgement that a compressed range in a wide-range instrument frequently resolves violently in whichever direction breaks first.
2.1 Intraday and Session Review
The completed December session is recovered from the published pivot ladder and not from an independently read bar. The outer pairs agree: the third-level resistance at 4,479.0 less the third-level support at 4,293.6, divided by three, gives 61.8, and the second-level pair of 4,450.6 and 4,327.0, divided by two, gives the same 61.8. Solving against a Pivot Point of 4,388.8 and a settlement of 4,383.9 returns a session high of 4,422.2 and a session low of 4,360.4, and those two values reproduce all seven published levels within the provider's one-decimal rounding. These are the completed-session inputs behind the published pivot ladder and not an independently read bar, and no intraday series was captured for this run, so the sequence of the session is not asserted here.
Computed from the unrounded reconstructed endpoints of 4,422.15 and 4,360.35 that sit behind the displayed 4,422.2 and 4,360.4, the closing-range position is 38.1 percent, where the displayed one-decimal endpoints give 38.0 percent, placing the settlement in the lower half of the range but well off the low. The new Globex session dated Tuesday, September 22 opened at 4,382.5, has traded between 4,382.0 and 4,390.4, and was last quoted near 4,389.0 on 935 contracts. That reopened range of 8.4 dollars is remarkably narrow against a 105.6 dollar average true range, and those figures belong to the new session and not to Monday's completed range.
2.2 Daily Structure
December carries 314,578 contracts of open interest. The 5-day change is a gain of 32.0 dollars, or 0.74 percent, so the past week has been net constructive despite Monday's mild give-back. The 52-week high at 5,781.8 sits 31.89 percent above the market and the 52-week low at 3,885.1 sits 11.38 percent below, which places the contract in the lower half of its annual distribution. The 1-month high at 4,755.0 doubles as the 13-week high, and the 1-month low at 4,273.3 sits 110.6 dollars beneath settlement. The current price is therefore in the lower third of its own one-month range.
2.3 4-Hour and Swing Structure
The higher-timeframe layout was read at the daily interval with the header showing GC1! at 4,389.5, and the 30-minute layout was read with the header showing GC1! at 4,389.0. Both confirm the December contract. Swing structure is framed by the 4,755.0 quarter high above and the 4,015.6 13-week low below. The 50 percent retracement from the 13-week high and low sits at 4,385.3, within 1.4 dollars of Monday's settlement, so the contract closed almost exactly at the midpoint of its quarterly range. The 38.2 percent retracement from the 13-week high at 4,472.5 and the 38.2 percent retracement from the four-week low at 4,457.3 form the nearest Fibonacci grouping above.
2.4 Moving Averages
The stack is broken and mixed, which is the technical signature of a market without a trend. The 5-day average sits at 4,385.8, within 2 dollars of settlement. The 20-day at 4,477.3 is 93.4 dollars above, the 50-day at 4,347.0 is 36.9 dollars below, the 100-day at 4,407.2 is 23.3 dollars above and the 200-day at 4,648.7 is 264.8 dollars above. Price is therefore above only the 50-day and below the 20-day, 100-day and 200-day. A 50-day average above a 100-day average would be the bullish configuration; here the 50-day sits beneath the 100-day, and that ordering is the clearest single statement of the medium-term condition.
2.5 Oscillator and Trend Readings
The 14-day relative strength measure reads 46.58, down 3.33 points, with the 9-day at 43.64 and the 20-day at 48.39. All three sit below the midpoint without approaching oversold territory. The 14-day raw stochastic is 38.78 percent with stochastic %K at 40.81 percent and %D at 33.27 percent, a set in the lower third of its band. The 14-day directional index reads 15.43 with the positive directional indicator at 15.83 against the negative at 16.69. A directional index at that level, with the two indicators within a point of each other, is the numerical definition of a market with no trend, and the marginal lead of the negative indicator gives the read a slight bearish tilt and not a direction.
The multi-indicator composite prints hold overall with the current direction reading bearish, the short-term group at 20 percent sell, the medium-term group at 75 percent buy and the long-term group at 67 percent sell. A hold composite with a bearish direction and disagreement across every horizon is what a range looks like when it is measured.
2.6 Volatility and Expected Range
The 14-day average true range is 105.6 dollars, which is 2.41 percent of settlement, the 9-day is 103.6 dollars at 2.36 percent and the 50-day is 111.2 dollars at 2.54 percent. The 14-day average daily range is 108.0 dollars at 2.46 percent and the 20-day average daily range is 106.9 dollars. Historic volatility is 19.15 percent on the 14-day window and 13.18 percent on the 9-day, and that fall from the longer window to the shorter is the compression already visible in the price. A one-average-true-range projection from the 4,383.9 settlement gives 4,278.3 to 4,489.5 for Tuesday. Monday's realised 61.8 dollar span was 58 percent of the 14-day average true range, so a mean-reverting range expansion is the base expectation for Tuesday even without a catalyst.
4.1 Dollar and Real Yields
The dollar index rose 0.20 percent on Monday, a direct headwind for dollar-denominated bullion. Market commentary noted that the dollar's advance was limited because the crude collapse eased inflation expectations, which softens the case for further policy tightening. Longer-dated Treasury yields slipped on the day according to the positioning note, while investment-bank commentary carried in the news feed described yields pushing toward 5 percent over the prior week, a characterisation that is unconfirmed against any verified series captured in this run. A precise 10-year yield level was not captured and is therefore not asserted here. The directional read is that nominal yields eased while the dollar firmed, a combination that leaves real yields roughly unchanged and explains gold's lack of direction.
4.2 Fed and Monetary Policy
Policy is the dominant variable and it is tightening. Investment-bank commentary in the news feed records a unanimous 25 basis point hike in September that lifted the target range to 3.75 to 4.00 percent. Projections published at 02:00 PM ET on September 16 show 12 of 18 officials expecting one more 25 basis point increase this year, four expecting two and two expecting none. On Monday afternoon a regional policymaker said at 02:19 PM ET that interest rates likely need to rise further to tame inflation that is both demand and supply driven, added at 02:20 PM ET that it is better for rate hikes to be earlier and incremental than later and larger, and said at 02:39 PM ET that core inflation may be running a full percentage point above target. A rising policy rate raises the opportunity cost of holding a non-yielding asset. That gold has held a 4,300 handle through a hiking cycle with the dollar firm is itself the notable fact.
4.3 Geopolitical Backdrop
The geopolitical premium drained out of the commodity complex on Monday. Iran's foreign minister arrived in New York for the United Nations General Assembly at 04:14 PM ET and Qatar stated at 03:02 PM ET that it was working to facilitate an agreement between Iran and the United States. Crude fell 4.51 percent on the front contract in response. Gold's refusal to fall in sympathy with that de-escalation is informative: either the metal was not carrying much war premium to begin with, or monetary demand is offsetting the release of it.
4.4 China and Structural Demand (Central Bank Buying, PBOC, ETF Flows)
No central-bank purchase data or fund-flow series was captured in this run, so structural demand is not quantified here. The available adjacent signal is a firmer Chinese currency noted in Monday's market commentary, which was described as limiting the dollar's gains. A stronger yuan lowers the local-currency cost of bullion for the largest physical market, a marginal support. A Chinese state visit to the United States is listed in the news-feed calendar as an all-day item on September 24, 2026, reported by the news feed and unconfirmed against the verified forward calendar; trade and currency outcomes from it would matter more to gold than any scheduled release this week.
4.5 Energy and Cross-Asset
The energy collapse is the cross-asset story of the day and it cuts against gold through the inflation-expectations channel. The expiring October crude contract settled at 95.78, down 4.51 percent, the international crude benchmark settled at 100.34, down 3.4 percent, and the front WTI contract for November settled at 92.37. Lower energy lowers headline inflation, which lowers the demand for an inflation hedge. Working the other way, an oil-major chief executive noted at 10:57 AM ET that too much refining capacity is offline ahead of winter and refined products remain historically tight, so the disinflation implied by the crude print may be narrower than the headline suggests. Equities rallied hard, with the broad index up 1.5 percent, and a strong risk session is a conventional drag on defensive allocations.
4.6 Institutional Positioning (COT, ETF Holdings, Speculator Length)
No commitments-of-traders data or fund-holdings series was captured in this run, so speculative length is not quantified here. The one positioning dataset captured is the bullion fund's options surface, covered below, and it is used qualitatively only. Open interest in the December contract at 314,578 is the single quantified positioning figure available for this edition.
5. Fund options-surface context (proxy)
This run uses the bullion exchange-traded fund as the positioning dataset available for gold, read from the positioning hub with a build stamp of September 19, 2026. The fund is not the futures contract: it tracks bullion at roughly one eleventh of the metal's price with a management-fee drag and no clean basis to the December contract, so its readings are used qualitatively and are never translated into futures prices anywhere in this outlook.
The captured row shows the fund at 398.24 against a previous close of 398.36 on volume of 7,581,577 shares, with a 52-week high of 509.70 and a 52-week low of 333.81. Call gamma reads minus 317 million and put gamma reads plus 198 million. That sign pattern is the opposite of the index complex captured in the same run, where the broad index shows positive call gamma and negative put gamma, and it describes dealers positioned short call-side convexity and long put-side convexity in the metal. Mechanically, that configuration tends to amplify an upside move and dampen a downside one, the reverse of the stabilising effect a long-call-gamma book provides. Next-expiry gamma reads 23.50 percent and next-expiry delta 8.60 percent, both moderate.
One caveat is recorded explicitly. The hub's low volatility point renders at 500 while its high volatility point renders at 410, which is the documented label inversion in which the two fields present the wrong way round. Both fields are therefore treated as low-confidence and are excluded from the level structure above. No dealer-positioning level from this dataset appears anywhere in this outlook.
6. Forecast, session by session
Night Session (06:00 PM ET Monday to 03:00 AM ET Tuesday, Globex and Asia). The reopened session has traded an 8.4 dollar band between 4,382.0 and 4,390.4, which is 8 percent of a normal day's range and describes a market waiting on something. Asian hours are where physical demand usually shows itself, and a compressed reopen into that window raises the odds of a range expansion and does not lower them. Expected Globex range is 4,360 to 4,410 with a mild downside skew while the market holds beneath the 4,388.8 Pivot Point. The captured calendar's first item of the new day is a European central-bank speaker at 04:30 AM ET, reported by the news-feed calendar and unconfirmed against the verified forward calendar.
London Session (03:00 AM to 08:00 AM ET Tuesday). London sets the physical benchmark and is where the dollar cross usually asserts itself. Expected range 4,365 to 4,415 with the 100-day moving average at 4,407.2 as the ceiling reference. The captured calendar carries a European central-bank speaker at 04:30 AM ET, a United Kingdom industrial orders survey at 06:00 AM ET with a consensus of minus 35 against a prior minus 25, and two further European central-bank speakers at 08:30 AM ET, all reported by the news-feed calendar and unconfirmed against the verified forward calendar. None is a gold-specific driver, so the metal's London direction is more likely to come from the dollar than from any print.
Morning Session (09:30 AM to 12:00 PM ET Tuesday, US Open). The cash open at 09:30 AM ET sets the session's first directional test, and the morning carries the densest speaker block of the day. Expected first-hour range 4,370 to 4,412. The captured calendar carries a European consumer confidence flash at 10:00 AM ET with a consensus of minus 16 against a prior minus 15.5 and a United States central-bank speaker at 10:05 AM ET, both reported by the news-feed calendar and unconfirmed against the verified forward calendar, and a United States central-bank vice chair speaking at 10:20 AM ET on discount window modernisation and Treasury market functioning, which reconciles to the verified forward calendar. Given that policy expectations are gold's dominant driver, the speaker block matters more to this instrument than the data does.
Afternoon Session (12:00 PM to 04:00 PM ET Tuesday). The afternoon's set-piece is a two-year note auction at 01:00 PM ET, prior high yield 4.204 percent and prior bid-to-cover 2.600, reported by the news-feed calendar and unconfirmed against the verified forward calendar, alongside a further United States central-bank speaker at the same hour, also unconfirmed. The two-year sector is the most policy-sensitive point on the curve, so a tail at that auction transmits to gold faster than a long-end result would. Expected range into the 04:00 PM ET equity close is 4,365 to 4,415, with settlement most likely inside 4,375 to 4,405.
Night Session Forward (06:00 PM ET Tuesday). Residual bias into the Globex reopen is neutral to mildly lower while the December contract holds beneath the 4,388.8 Pivot Point and inside the 4,347.0 to 4,407.2 moving-average corridor. Attention then turns to the United States flash purchasing managers indices on September 23, 2026 at 09:45 AM ET, reported by the news-feed calendar with composite consensus 54.8 against a prior 56.0 and unconfirmed against the verified forward calendar.
Expected Range (Tuesday full session). Low-range scenario 4,370 to 4,410. Mid-range scenario, the most likely, 4,350 to 4,425. High-range scenario 4,300 to 4,470.
Most Likely Path. The most probable Tuesday keeps the December contract inside the 4,347.0 to 4,407.2 moving-average corridor and resolves the compression with a range expansion and not a trend. A failure at the 4,407 to 4,418 area, where the 100-day average, Pivot R1 and the 1 standard deviation band overlap within 11 dollars, points back toward the 4,355 to 4,360 demand band. A settlement beneath 4,347.0 changes the medium-term read and opens Pivot S2 at 4,327.0. A reclaim of 4,417 on a sustained basis would put the 4,450.6 Pivot R2 and the 4,477.3 twenty-day average in play, and that is the path that would require the policy expectation to soften.
7. Tuesday economic calendar
The captured calendar for Tuesday contains European and United States policy speakers, a European consumer confidence flash and a two-year note auction, all reported by the news feed and unconfirmed against the verified forward calendar, and that speaker block is the more consequential half for this instrument. The captured calendar's overnight Asian block contains speaker items only.
European hours open with a central-bank speaker at 04:30 AM ET and a United Kingdom industrial orders survey at 06:00 AM ET with a consensus of minus 35 against a prior minus 25, then two further European central-bank speakers at 08:30 AM ET and an international financial institution address at 09:00 AM ET, all reported by the news-feed calendar and unconfirmed against the verified forward calendar. The United States morning carries a European consumer confidence flash at 10:00 AM ET with a consensus of minus 16 against a prior minus 15.5 and a central-bank speaker at 10:05 AM ET, both news-feed items and unconfirmed, followed by a central-bank vice chair at 10:20 AM ET speaking on discount window modernisation and Treasury market functioning, which reconciles to the verified forward calendar. The afternoon carries a two-year note auction at 01:00 PM ET with a prior high yield of 4.204 percent and a prior bid-to-cover of 2.600, plus a further central-bank speaker at the same hour, both news-feed items and unconfirmed. A European central-bank speaker follows at 03:30 PM ET and Australian flash purchasing managers indices land at 07:00 PM ET, both news-feed items and unconfirmed.
The single first-order event for gold on Tuesday is the two-year note auction at 01:00 PM ET, reported by the news feed and unconfirmed against the verified forward calendar, because the two-year sector prices the policy path that sets the opportunity cost of holding bullion. The speaker block from 10:05 AM ET through 01:00 PM ET is a close second. Looking further out, the verified forward calendar carries new residential sales on September 24, 2026 at 10:00 AM ET and the advance durable goods report on September 25, 2026 at 08:30 AM ET.
8. Primary trade setup
Direction: Short
Rationale: The December contract settled 4.9 dollars beneath its own Pivot Point inside a moving-average corridor it has not escaped, and the 4,405 to 4,418 area stacks the 100-day average, Pivot R1 and the 1 standard deviation band inside an 11 dollar window, which is the densest supply in the near structure.
Entry Zone: 4,405 to 4,418
Stop Loss: 4,440 (above the 2 standard deviation resistance band at 4,431.5 and beneath Pivot R2 at 4,450.6)
Target 1 (T1): 4,360 (Monday's completed-session low at 4,360.4, the first structural magnet)
Target 2 (T2): 4,327 (Pivot S2, with the 3 standard deviation support band at 4,325.6 alongside)
Target 3 (T3, extended): 4,294 (Pivot S3, reachable only on a break of the 50-day average at 4,347.0)
Risk-to-Reward: Approximately 1:1.8 to T1, 1:3.0 to T2, 1:4.1 to T3
Invalidation: A sustained session above 4,418 negates the short thesis and turns attention to Pivot R2 at 4,450.6 and the 20-day moving average at 4,477.3.
Macro override: A materially softer policy message from the 10:05 AM ET or 10:20 AM ET speakers, a strong two-year note auction at 01:00 PM ET that pulls the front-end yield lower, an event reported by the news feed and unconfirmed against the verified forward calendar, or a renewed geopolitical escalation would invert this setup in real time. A hawkish surprise and a firm auction result would accelerate it.
Sources and methodology
This outlook is built from our session review of the December COMEX gold contract, GCZ26, the December '26 contract, prepared after Monday's close on September 21, 2026. The completed session's high, low and settlement are recovered from the published pivot ladder, whose outer pairs agree at 61.8 dollars and reproduce all seven published levels within one-decimal rounding, and no intraday series was captured for this run, so no intraday path is asserted. The bullion exchange-traded fund is used as qualitative positioning context only and is never converted into futures prices; it tracks bullion at roughly one eleventh of the metal's price with a management-fee drag and no clean basis to the December contract, and its two inverted volatility-point fields are excluded from the level structure. Indicator readings are limited to the values preserved for this session.
Scenario ranges are analyst judgment; they carry no calibration. Contract months are kept separate throughout. Scheduled items marked unconfirmed come from the news-feed calendar captured for this run and were not verified against the verified forward calendar. Central-bank purchase data, fund-flow and fund-holdings series, commitments-of-traders component figures, a precise 10-year yield level and the session percentage change for the December contract were not captured in this run, and no figure is stated for any of them.
Monday’s outlook for this contract is here, and the same session's crude read is here. Outlooks for ES, NQ, GC and CL are collected on the market outlook page, and our forward trading record is on the performance statement.



