
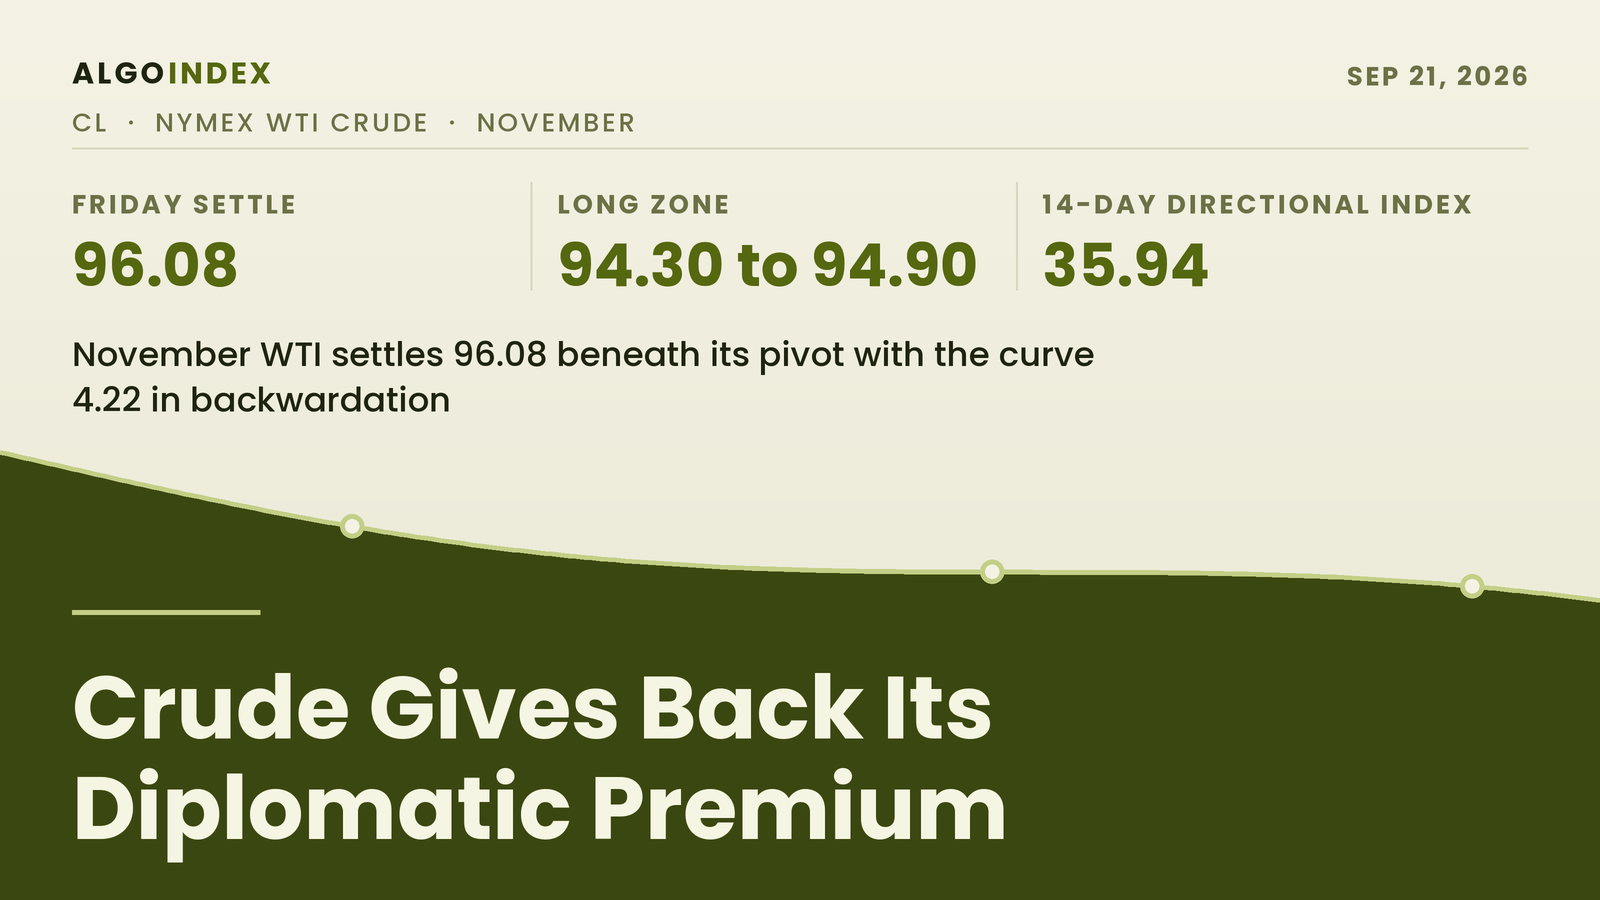
At 02:31 PM ET the November crude contract settled at 96.08, down 1.15 dollars or 1.18 percent from Thursday's 97.23 close. Two hours after that print, reports described an explosion heard in Jazan and Abha in Saudi Arabia. The settlement does not reflect it. Friday's bar opened at 96.48, reached 98.01 at its high and 94.83 at its low, and finished at 39.3 percent of that 3.18 dollar range measured from the low, 1.25 above the low and 1.93 beneath the high. The daily bar does not establish whether the high or the low printed first, and nothing here asserts an order. Volume printed 300,567 contracts against open interest of 304,429.
One piece of housekeeping changes every number below. The chart series and the volume leadership have both moved to the November contract, CLX26, which carries 300,567 contracts of session volume against the October contract's 84,103, and 304,429 of open interest against 79,712, roughly 3.6 times the volume and 3.8 times the open interest. Every level in this outlook is computed from November. October, in its final days of trading, settled at 100.30 the same afternoon, and the 4.22 dollar spread between the two is backwardation, the forward curve's way of saying the physical market is paying up for prompt barrels. Anyone comparing this against a headline settle should expect that difference and treat it as structure, not error.
November WTI settled at 96.08, down 1.18 percent, beneath its own pivot point at 96.31 and beneath the 5-day average at 97.74 on a de-escalation move in the geopolitical premium. The pivot is lost. Overhead the references run from the pivot at 96.31 through the 5-day average at 97.74 into the tightest overhead grouping on the map, the first pivot resistance at 97.78 with the one standard deviation resistance at 97.85, then Friday's high at 98.01. Dense supply. Support is the four-value grouping inside 0.58 dollars where the computed target price at 94.89, the session low at 94.83, the first pivot support at 94.60 and the one standard deviation support at 94.31 sit together. The trend architecture is strong, with a 14-day directional index of 35.94 and price above every average from the 20-day out to the 200-day, while the full week produced a gain of 0.15 percent. Strong trend, flat week. The primary setup is a long from 94.30 to 94.90, stop 92.95, targets 96.31, 97.78 and 99.49, into a Monday with no United States data on the captured calendar.
Where Friday's long finished
Thursday's outlook set a long from 95.17 to 96.48 with a stop at 94.25 and targets at 97.79, 98.54 and 99.85. Friday opened at 96.48. That is the top edge of that band, so the entry was live on the session's first print. The high at 98.01 carried through the first target at 97.79. The low at 94.83 stayed above the 94.25 stop and above the 94.42 invalidation level that outlook named. The second target at 98.54 was never reached, and the 96.08 settlement finished back inside the entry band. We record that as a fill that paid its first objective and handed the rest back. One caveat travels with it: the daily bar does not order its high and its low, and this run captured the completed bar and the published level ladder with no time-stamped intraday series, so nothing here asserts the sequence between the 98.01 print and the 94.83 print.
What moved the price was diplomacy. Press reports during the week described China privately asking Iran to use its influence to rein in Yemen's Houthis after a Saudi appeal to Beijing (07:58 AM ET, September 17), and Saudi Arabia seeking to return roughly half the capacity of its East-West pipeline within days following the drone-strike shutdown of the prior week (11:47 AM ET, September 16). Both point the same way. Regional flows the market had priced as impaired may recover faster than assumed, and crude handed back part of the risk premium accordingly, with no change in the physical balance behind it. The counterweight arrived late and arrived twice: a report at 03:23 PM ET that a senior Houthi figure said Saudi Arabia had requested Iranian mediation, and the 04:31 PM ET report of the explosion heard in Jazan and Abha. Both landed after the 02:31 PM ET settlement window. Whether any post-settlement Friday trading priced them was not captured in this run, and the captured record establishes only that the settlement excludes them. Other geopolitical items that ran during the session were NOT CAPTURED IN THIS RUN.
A powerful uptrend that has stopped making progress
Take the trend measures first, because they are emphatic. The 14-day directional index reads 35.94, above the conventional 25 threshold that denotes a trending market, with a positive directional component of 28.88 against a negative of 11.14, a factor of roughly 2.6. Readings on other horizons were not captured in this run. The multi-indicator composite reads 96 percent buy with strength rated good and direction rated average, and twelve of its thirteen component studies register buy. The single exception is a hold on the 10 and 8 day moving average high-low channel, the study most sensitive to exactly the sort of short-term stall the last five sessions produced. Grouped by horizon, the short-term studies average 80 percent buy, the medium-term 100 percent and the long-term 100 percent.
Now the other half. The session closed beneath its own pivot point of 96.31 and beneath the 5-day average of 97.74, the 14-day stochastic percent K reads 76.92 against a percent D of 83.38, and the entire week produced a net gain of 0.14 dollars, or 0.15 percent. Five sessions, fourteen cents. Set that against a settlement 6.95 percent above the 20-day average of 89.84 and 15.68 percent above the 50-day average of 83.06, and the picture resolves: the advance embedded in the average stack is large and the last week has been flat. The 14-day relative strength reads 64.64 against the neutral 50 midpoint and the raw stochastic reads 70.81, which places the settlement in the upper third of its 14-day range. Elevated, not extreme. Nothing in the captured readings is at an extreme that demands mean reversion, and the other stochastic and relative strength horizons, together with the session change in relative strength, were not captured in this run.
The average stack is fully constructive and fully extended. The 5-day sits at 97.74, the 20-day at 89.84, the 50-day at 83.06, the 100-day at 80.79, the 200-day at 73.30 and the year-to-date average at 75.16. Each longer average sits beneath each shorter one, the canonical sequence for an established uptrend, and the settlement clears every one of them except the 5-day. That exception is the whole short-term signal. Price 1.66 beneath the 5-day while sitting 6.24 above the 20-day, 13.02 above the 50-day, 15.29 above the 100-day and 22.78 above the 200-day describes a market that has run a long way and is pausing. The published moving-average crossing thresholds were not captured for this contract in this run, so the 5-day average at 97.74 is the only short-term trend line stated overhead. Period performance beyond the week was not captured either.
Two structural distances close the picture. The 52-week high is 101.69 and the settlement sits 5.52 percent beneath it, measured from the high; the 52-week low is 55.64, which the contract now stands 72.68 percent above. The 13-week and one-month high and low markers were not captured in this run, so no Fibonacci retracement grid is stated for crude in this outlook and the swing map rests on the pivot and standard deviation ladders together with the captured averages. Historic volatility on the 14-day horizon reads 38.87 percent, with other horizons uncaptured. Crude is trending, and trending fast.
The levels, top to bottom
Overhead the first reference is the one the session gave away. The pivot point at 96.31 is the mechanical midpoint of Monday's published ladder, computed from Friday's high, low and settlement, and a settlement 0.23 beneath it converts it from support into the first level a recovery has to reclaim. Above it the 5-day average at 97.74 is the only average the settlement sits under. Then the densest grouping on the upside map: the first pivot resistance at 97.78, with the one standard deviation resistance at 97.85 sitting 0.07 above it and the 5-day average 0.04 beneath it. Three independent computations inside eleven cents. Friday's high at 98.01 follows, the level a Monday recovery would need to reclaim to argue the pullback is finished, then the second standard deviation resistance at 98.58 which sits 2.50 above the settlement, the third standard deviation band at 99.14, the second pivot resistance at 99.49 roughly one average true range higher at 3.41 above the settlement, the third pivot resistance at 100.96 and the 52-week high at 101.69.
Beneath price the map is tighter and it is the reason this outlook is a long. The computed target price published alongside Monday's ladder sits at 94.89, just 0.06 above Friday's low of 94.83. The first pivot support is 94.60, 1.48 beneath the settlement, and the one standard deviation support is 94.31. Four independent reference values inside a 0.58 dollar window. That is the tightest confluence on the map and the basis for the entry zone below. Under it the second standard deviation support sits at 93.58, 2.50 beneath the settlement, then another tight pairing: the second pivot support at 93.13 with the third standard deviation support 0.11 beneath it at 93.02, which together define the lower edge of the mechanical structure and the basis for the stop. The third pivot support at 91.42 is the outermost rung of the ladder, and the next captured reference beneath it is the 20-day average at 89.84. Retracement levels and moving-average crossing thresholds were not captured for this contract in this run.
Volatility frames every one of those distances. The 14-day average true range is 3.57, or 3.72 percent of the settlement, and true-range readings on other horizons were not captured in this run. The 14-day average daily range is 3.78, or 3.93 percent of the settlement, and Friday's realised 3.18 came in beneath it, so this was a quieter session than typical by this contract's recent standards. A one average true range projection from the 96.08 settlement spans 92.51 to 99.65. An average day here moves more than three and a half dollars, and with a weekend of headline exposure ahead of the Sunday reopen the reopening gap can exceed that.
Positioning is mostly a gap in this run, and the gap is worth naming plainly. This workflow covers crude without a positioning dataset: there is no equivalent of the exchange-traded fund proxies used for the equity and metals instruments that gives a reliable read on crude dealer gamma, so this outlook makes no gamma, dealer-positioning or options-flow claim about crude at any point. The equity and metals outlooks in tonight's package carry a positioning layer that this one does not. The weekly commitments data for the week ending September 15 was published at 04:21 PM ET Friday, after the settlement, and this run captured the release without its component figures, so no claim is made about money manager net length, commercial hedger positioning or the direction of the week's change. What can be said comes from the curve and from the order book. Open interest in November stands at 304,429 against 79,712 in October, and November's session volume of 300,567 sits close to parity with its own open interest, which is the signature of an active roll and not fresh directional accumulation. The 4.22 dollar backwardation says the physical market is paying for prompt barrels, and that structure is a material check on any bearish reading of Friday's decline. The curve disagrees with the sellers.
The trade map for Monday
The primary setup is a long from 94.30 to 94.90, bidding the pullback into the grouping where the computed target price at 94.89, Friday's low at 94.83, the first pivot support at 94.60 and the one standard deviation support at 94.31 all sit within 0.58 dollars of one another. The case for buying it rests on the trend architecture: a directional index of 35.94, a positive component of 28.88 against 11.14, price above every average from the 20-day out to the 200-day, a 96 percent buy composite, and a session that closed beneath its own pivot on a diplomatic headline with no deterioration in the physical balance behind it. Risk sits beneath the pairing. The stop is 92.95, under both the second pivot support at 93.13 and the third standard deviation support at 93.02. The first objective is the pivot point at 96.31, the midpoint the session closed beneath. The second is the first pivot resistance at 97.78, where the one standard deviation resistance at 97.85 and the 5-day average at 97.74 also sit. The third is the second pivot resistance at 99.49.
From the 94.60 midpoint against the 92.95 stop the risk is 1.65, approximately 1:1.0 to the first target, 1:1.9 to the second and 1:3.0 to the third. That 1.65 is 46 percent of the 14-day average true range of 3.57, well inside a single average day of movement for this contract, and the weekend gap exposure adds to that mismatch between stop distance and volatility. Inside a single average day. The Sunday reopen at 06:00 PM ET carries two days of unpriced headline exposure and pricing is likely to be disorderly through the first hours of Globex trade. The United States pit session opening at 09:00 AM ET Monday gives the level map its first liquid test.
Gap levels run both ways. An upside gap through the pivot at 96.31 and on toward the 5-day average at 97.74 would mark the market re-pricing the Jazan and Abha reports as a genuine supply risk. A downside gap beneath 94.83, Friday's low, and into the 94.60 to 94.31 grouping would say the weekend produced further diplomatic progress. Either direction is live. The 14-day average true range of 3.57 means a reopen anywhere between roughly 92.51 and 99.65 is within one average day of Friday's settlement, and weekend gaps in crude routinely exceed that. Bias into the reopen is mildly constructive, because the settlement could not price the post-settlement escalation headlines.
One weekend item will already have passed by the time the contract reopens. The Chinese central bank publishes its one-year and five-year loan prime rates at 09:00 PM ET Saturday, with forecasts of 3 percent and 3.5 percent against previous values of 3.00 percent and 3.50 percent, per the news-feed calendar captured for this run, unconfirmed against the verified forward calendar, and it bears on Asian demand expectations more than on crude directly. Asia prices it first. European hours bring the first liquid pricing of whatever the weekend produced, with the European Central Bank's Kazimir at 04:30 AM ET the only European item on the calendar captured for Monday and a monetary rather than an energy event. If Asia has held above the pivot at 96.31, European hours typically extend toward the 5-day average at 97.74 and the first pivot resistance at 97.78. Diesel is the tight end. European refining demand remains the structural support under the product complex, with diesel near record levels, and any incremental pipeline-outage news would be priced there first.
Monday's United States slate is empty by the captured calendar. The Federal Reserve's Goolsbee speaks at 06:30 AM ET, ahead of the equity cash open, and the Bank of Canada's Macklem at 11:20 AM ET, with the Reserve Bank of Australia's Hunter at 03:00 PM ET after the pit close and Bullock at 11:10 PM ET, all per the news-feed calendar captured for this run, unconfirmed against the verified forward calendar. No data anchor. That absence leaves the pit session to trade structure and headlines, which is why the mechanical levels carry more weight than usual. A session that opens inside 94.60 to 96.31 and holds it is consolidating; a decisive resolution of either edge sets Monday's direction. Two edges, one decision. The pit close falls at 02:30 PM ET with the settlement window immediately before it, and Tuesday's ladder is recomputed from Monday's high, low and settlement together, so its direction cannot be inferred from Monday's close alone.
The week's one first-order catalyst for crude is not on Monday at all. It is the weekly government inventory report on Wednesday, September 23 at 10:30 AM ET, carried on the verified forward calendar at that time, with the previous crude print a draw of 0.640 million barrels and no published forecast at the time of capture. Wednesday is the date that matters. A draw of that size is modest, and the sequence of builds and draws matters more than the single number while the market argues about whether Middle East supply disruption is real or resolving. The trade-association preview that conventionally precedes the government report by one session would fall on the Tuesday; it does not appear on the forward calendar captured for this run, so no time is assigned to it. The captured calendar carries no producer-group set-piece before that report either. The verified forward calendar lists the producer group's seven-country monthly meeting and the 68th joint ministerial monitoring committee meeting on October 4, 2026, with no time published.
Scenario ranges here are analyst judgment and carry no derived frequency. The low-range case runs from Friday's low at 94.83 to the first pivot resistance at 97.78, a width of 2.95, or 0.78 times the 14-day average daily range of 3.78. The most likely case runs from the one standard deviation support at 94.31 to Friday's high at 98.01, 3.70 wide, essentially one average daily range. Call that the base case. The high-range case runs from the second pivot support at 93.13 to the second pivot resistance at 99.49, 6.36 wide, or 1.68 times the average daily range. Three cases, one ladder.
The most likely path holds the settlement beneath the pivot at 96.31 through Asian and European hours, works down into the 94.89 to 94.31 grouping during the United States morning, and finds buyers there given the directional index at 35.94 and the composite at 96 percent buy. From that grouping it recovers toward the pivot and, on a firm session, the 5-day average at 97.74. The alternative path gaps above 96.31 at the Sunday reopen on renewed supply-disruption pricing and never offers the pullback entry at all. The weekend headline exposure makes that outcome materially possible. The monetary backdrop argues for restraint on the upside in any case. The Federal Reserve projections published at 02:00 PM ET on Wednesday, September 16 show twelve of eighteen officials expecting one further 25 basis point increase this year, four expecting two and two expecting none, and the captured market wrap headline described ten-year Treasury yields rising during Friday's session, with no yield level or quote time captured. A central bank projecting further tightening into a rising long end is a demand headwind on any horizon beyond the immediate geopolitical trade, and it is the main reason a 96 percent buy composite should not be read as a one-way signal. Policy is the other side.
Crude goes into Monday beneath its own midpoint, carrying a trend measure that says the advance is intact and a week that moved it fourteen cents.
The complete data picture
Every number behind Monday’s plan, charted first, then the full level map, then the complete numeric reference underneath.
Full numeric reference, every remaining figure from the session review
Carried below in the review's own order: the session summary from section 1, sections 2.1 to 2.6, the level notes behind sections 3.1 and 3.2, sections 4.1 to 4.6, the positioning note from section 5, the session-by-session forecast from section 6, the Monday calendar from section 7 and the primary setup from section 8.
Level notes (3.1 Resistance and 3.2 Support)
96.31 is the Pivot Point, the mechanical midpoint of Monday's published ladder, computed from Friday's high, low and settlement. The contract settled 0.23 beneath it, which converts it from support into the first overhead reference and makes it the first Primary Setup target.
97.74 is the 5-day moving average, the only average the settlement sits beneath, 1.66 above it and the first trend reference overhead.
97.78 is Pivot R1, the first pivot resistance of Monday's ladder and a level with genuine confluence, sitting 0.07 beneath the 1 standard deviation resistance at 97.85. Two independent computations grouping inside eight cents, with the 5-day average 0.04 beneath the pivot resistance, is the most concentrated confluence on the upside map, and 97.78 is the second Primary Setup target.
98.01 is Friday's session high, the highest print of the completed session and the level a Monday recovery would need to reclaim to argue the pullback is over.
98.58 is the 2 standard deviations resistance, the second standard deviation band, 2.50 above the settlement.
99.14 is the 3 standard deviations resistance, the outer statistical band of the five-period standard deviation calculation.
99.49 is Pivot R2, the second pivot resistance, 3.41 above the settlement, roughly one 14-day average true range higher, and the third Primary Setup target.
100.96 is Pivot R3, the third and outermost pivot resistance of Monday's ladder.
101.69 is the 52-week high, the single most important structural level on the chart. The 13-week and one-month highs were not captured in this run, so when within the year the high was set is not stated. A settlement above it would be a fresh yearly high.
94.89 is the computed target price, the projected target value published alongside Monday's ladder, sitting just 0.06 above Friday's low and forming the upper edge of the primary entry confluence.
94.83 is Friday's session low, the lowest print of the completed session.
94.60 is Pivot S1, the first pivot support of Monday's ladder, 1.48 beneath the settlement, and the midpoint of the Primary Setup entry zone.
94.31 is the 1 standard deviation support, the first standard deviation band. The grouping of the target price at 94.89, the session low at 94.83, the first pivot support at 94.60 and this level places four independent reference values inside a 0.58 dollar window, the tightest support confluence on the map and the basis for the Primary Setup entry.
93.58 is the 2 standard deviations support, the second standard deviation band, 2.50 beneath the settlement.
93.13 is Pivot S2, the second pivot support, sitting 0.11 above the 3 standard deviations support at 93.02, another tight pairing and the structural basis for the Primary Setup stop.
93.02 is the 3 standard deviations support, the outer statistical band on the downside and the settlement-basis invalidation level.
91.42 is Pivot S3, the third and outermost pivot support of Monday's ladder. Beneath it, the next captured reference is the 20-day moving average at 89.84; retracement levels and moving-average crossing thresholds were not captured for this contract in this run.
1. Session summary
November WTI crude settled at 96.08, down 1.15 on the session, a decline of 1.18 percent from Thursday's 97.23 close. The session opened at 96.48; the high was 98.01, the low 94.83 and the settlement 96.08, which sits at 39.3 percent of the range measured from the low. The daily bar does not establish whether the high or the low printed first, and this outlook does not assert an order. The 3.18 dollar range represents 3.31 percent of the settlement price, beneath the 14-day average daily range of 3.78; average-range readings on other horizons were not captured in this run. Volume printed 300,567 contracts against open interest of 304,429.
A note on contract identity, because it materially changes every level here. The chart series and the volume leadership have both moved to November. The October contract, which is the one quoted in the settlement headlines carried by the wire services this week at 100.30, is in its final days of trading and now carries 84,103 contracts of volume against November's 300,567, and 79,712 of open interest against November's 304,429. November is the contract with roughly 3.6 times the volume and 3.8 times the open interest, and it is the contract every level in this outlook is computed from. The 4.22 dollar spread between the two settlements is a backwardation structure, which is what a physically tight crude market looks like in the forward curve, and readers comparing this outlook against a headline settle should expect that difference and not treat it as an error.
The dominant driver of the session was a de-escalation bid in the geopolitical premium, with no change in the physical balance behind it. Press reports during the week indicated that China privately asked Iran to use its influence to restrain Yemen's Houthis following a Saudi appeal, and that Saudi Arabia is seeking to return about half the capacity of its East-West pipeline within days after the drone-strike shutdown of the prior week. Both items point the same direction: regional flows that the market had priced as impaired may recover faster than assumed. Crude gave back part of the risk premium accordingly. The counterweight arrived after the settlement, with reports of an explosion heard in Jazan and Abha in Saudi Arabia at 04:31 PM ET, roughly two hours after the 02:31 PM ET settlement print, which means the settlement does not reflect it. Whether any post-settlement Friday trading priced it was not captured in this run; the captured record establishes only that the settlement excludes it.
The structural contradiction heading into Monday is unusually sharp. The trend architecture is emphatically constructive: the 14-day directional index sits at 35.94 with the positive directional component at 28.88 against a negative component of 11.14, price is 6.95 percent above the 20-day average of 89.84 and 15.68 percent above the 50-day average of 83.06, and the multi-indicator composite reads 96 percent buy with good strength. Against that, the session closed below its own pivot point of 96.31 and below the 5-day average of 97.74, the 14-day stochastic percent K reads 76.92 compared with a percent D of 83.38, and the entire week produced a net gain of only 0.14 dollars, or 0.15 percent. The market is in a powerful uptrend that has stopped making progress. The Primary Setup therefore works the pullback and not the breakout: a long from the 94.30 to 94.90 confluence where the first pivot support, the one standard deviation support and the session low all group together, with initial objectives back at the pivot and the first pivot resistance.
Volatility deserves an explicit note, because crude is the most kinetic of the four instruments this desk covers. The 14-day average true range is 3.57, or 3.72 percent of spot; true-range readings on other horizons were not captured in this run. A single average day in this contract moves more than three and a half dollars, and with a weekend of headline exposure ahead of the Sunday reopen, the reopening gap can exceed that.
2.1 Intraday and Session Review
The November contract opened the session at 96.48, 0.75 below Thursday's 97.23 settlement, establishing a lower open that framed the day's character from the outset. The high of 98.01 and the low of 94.83 bracket a 3.18 dollar range. The 96.08 settlement sits 1.25 above the session low and 1.93 below the session high, placing the close at 39.3 percent of the session range measured from the low. That is a lower-half close, which is consistent with sellers holding the advantage into the settlement, though it is well off the extreme and does not describe a rout.
Session character is worth separating carefully from the headline flow, and this outlook will not claim more than the data supports. This run captured the completed daily bar and the published level ladder, with no time-stamped intraday series, so the precise sequencing of the move within the session is not something this outlook can assert. What can be stated is the relationship between the headline times and the settlement: the de-escalation items that pressured crude were carried during and before the session, while the Jazan and Abha explosion report at 04:31 PM ET and the report at 03:23 PM ET that a senior Houthi figure said Saudi Arabia had requested Iranian mediation both landed after the 02:31 PM ET settlement window. Those two items coincided with the post-settlement period and are carried into the weekend unpriced by the settlement.
The close below the pivot point of 96.31 is the single most consequential mechanical fact of the session. That value is the reference the Monday ladder is built around, and a settlement 0.23 beneath it means the contract enters the new week on the weaker side of its own mechanical midpoint. Prior-session ladders and closes were not captured in this run, so no comparison with earlier sessions is made.
2.2 Daily Structure
The 52-week high is 101.69 and the settlement sits 5.52 percent below it, measured from the high. The 52-week low is 55.64, a level the contract is now 72.68 percent above. The 13-week and one-month high and low markers were not captured in this run, so the position of the settlement inside those shorter windows is not stated.
The forward curve is in backwardation, with October at 100.30 and November at 96.08, a 4.22 dollar premium for prompt delivery. Backwardation in crude is the curve's expression of physical tightness: buyers are paying up for barrels now and not for barrels later. That structure is a material check on any bearish interpretation of Friday's decline, because it says the spot market remains tight even while the front contract sells off on diplomatic headlines.
Position within the daily range is elevated on the horizon captured. The 14-day raw stochastic reads 70.81 percent compared with the 50 percent midpoint of that range, placing the settlement in the upper third of the 14-day range. Raw stochastic readings on other horizons were not captured in this run.
2.3 4-Hour and Swing Structure
The swing structure can only be described from the 52-week high of 101.69 tonight. The one-month and 13-week highs and lows that would anchor a retracement grid were not captured in this run, so no Fibonacci retracement levels are stated for crude in this outlook, and the swing map relies on the pivot and standard deviation ladders together with the captured moving averages.
The oscillator reading captured is the 14-day stochastic percent K at 76.92 compared with percent D at 83.38, with the raw reading at 70.81. Earlier K and D values were not captured, so this outlook states only that K sits beneath D on that horizon and does not assert when the two lines crossed. The 14-day relative strength reads 64.64 compared with the neutral 50 midpoint; the other stochastic and relative strength horizons and the session change in relative strength were not captured in this run. Nothing in the captured readings is at an extreme that demands mean reversion.
2.4 Moving Averages
The average stack is fully constructive and fully extended. The 5-day average sits at 97.74, the 20-day at 89.84, the 50-day at 83.06, the 100-day at 80.79, the 200-day at 73.30, and the year-to-date average at 75.16. Each longer average sits below each shorter average, the canonical sequence for an established uptrend, and the settlement at 96.08 sits above every one of them except the 5-day.
That single exception is the short-term signal. Price 1.66 below the 5-day average while sitting 6.24 above the 20-day, 13.02 above the 50-day, 15.29 above the 100-day and 22.78 above the 200-day is a market that has run a long way and is pausing, and not one that has turned. The published moving-average crossing thresholds were not captured for this contract in this run, so the 5-day average at 97.74 is the only short-term trend line stated overhead.
Period performance beyond the week was not captured in this run. The captured five-session change is a gain of 0.14 dollars, or 0.15 percent, against a settlement 6.95 percent above the 20-day average and 15.68 percent above the 50-day: the advance embedded in the average stack is large and the last week has been flat.
2.5 Oscillator and Trend Readings
The directional index framework carries the clearest trend signal in this outlook. The 14-day directional index reads 35.94 with a positive directional component of 28.88 against a negative of 11.14. A reading above 25 on the directional index conventionally denotes a trending market; the 14-day reading qualifies, and the positive component exceeds the negative by a factor of roughly 2.6. Directional index readings on other horizons were not captured in this run.
Historic volatility on the 14-day horizon reads 38.87 percent; other horizons were not captured in this run. Crude is not merely trending, it is trending at high volatility, which is the condition under which the distance between entry and stop matters most relative to an average day's movement.
The multi-indicator composite reads 96 percent buy with strength rated good and direction rated average. Twelve of the thirteen component studies register buy, with the sole exception a hold on the 10 and 8 day moving average high-low channel, the study most sensitive to exactly the kind of short-term stall the last five sessions have produced. Grouped by horizon, the short-term studies average 80 percent buy, the medium-term 100 percent buy and the long-term 100 percent buy.
2.6 Volatility and Expected Range
The 14-day average true range is 3.57, or 3.72 percent of the settlement. True-range readings on other horizons were not captured in this run, so no statement is made here about whether volatility has expanded or contracted over the quarter.
The 14-day average daily range is 3.78, or 3.93 percent of the settlement; other horizons were not captured in this run. Today's realised range of 3.18 came in below the 14-day average, so Friday was a quieter than typical session by this contract's recent standards.
A one average true range projection from the 96.08 settlement spans 92.51 to 99.65 using the 14-day value of 3.57. The practical implication for stop placement is direct: a stop placed less than roughly 3.50 from entry is inside a single average day of movement for this contract.
4.1 Supply Policy (Quotas, Compliance, Producer Signals)
The supply story this session was about restoration and not about policy. Press reports carried during the week indicated Saudi Arabia is seeking to return roughly half the capacity of its East-West pipeline within days, following the shutdown caused by drone strikes in the prior week, per the report captured at 11:47 AM ET on September 16. A pipeline that returns to half capacity within days is a materially different supply picture from one out of service for an extended period, and the recovery of that expectation is sufficient on its own to explain a 1.18 percent decline without any change in quota policy.
The captured calendar for this run lists no producer-group set-piece between now and the middle of next week. The verified forward calendar lists the producer group's seven-country monthly meeting and the 68th joint ministerial monitoring committee meeting on October 4, 2026, with no time published. The news-feed calendar captured for this run, unconfirmed against the verified forward calendar, lists the producer-group monthly report on October 13, the international agency's monthly oil report on October 14 and the short-term energy outlook winter edition on October 6. The captured calendar therefore carries no supply-policy release before Wednesday's inventory report, which leaves the contract more exposed to unscheduled headlines than to data through Monday.
4.2 Inventory Data (Crude Stocks, Gasoline, Distillates, Cushing, Strategic Reserve)
The weekly government inventory report is the single first-order scheduled catalyst for this contract in the coming week, and it lands on Wednesday, September 23 at 10:30 AM ET. The forward calendar captured for this run shows the previous crude inventory print at a draw of 0.640 million barrels and carries no published forecast at the time of capture. A draw of that size is modest, and the sequence of builds or draws matters more than the single number at a moment when the market is arguing about whether Middle East supply disruption is real or resolving.
The trade-association preview that conventionally precedes the government report by one session would fall on the Tuesday. It does not appear on the forward calendar captured for this run, so this outlook does not assign it a time.
4.3 Geopolitical Backdrop (Middle East, Iran, Russia and Ukraine, Venezuela)
This is the dominant driver and it cuts both ways inside a single session. On the de-escalation side, the two items captured in this run: the report at 07:58 AM ET on September 17 that China privately asked Iran to use its influence to rein in Yemen's Houthis after a Saudi appeal to Beijing, and the Saudi pipeline restoration reporting above. On the escalation side, and arriving after the settlement: the report at 04:31 PM ET of an explosion heard in Jazan and Abha in Saudi Arabia, and the report at 03:23 PM ET that a senior Houthi figure said Saudi Arabia had requested Iranian mediation. Other geopolitical items that ran during the session were NOT CAPTURED IN THIS RUN and are not described here.
The market's willingness to discount diplomatic progress is bounded by how quickly physical capacity actually returns, and the two post-settlement reports cut against the de-escalation reading that set Friday's price. That tension is the central unresolved question into Monday.
4.4 Demand and Refining (Refinery Utilisation, Crack Spreads, Seasonal Pattern)
The refined-product settlements published after the close were captured as levels only: October diesel settled at 5.0578 dollars per gallon, October gasoline at 3.5276 dollars per gallon and October natural gas at 2.9120 dollars per million British thermal units. The session changes for the products were NOT CAPTURED IN THIS RUN, so this outlook makes no claim about the direction of crack spreads on the session. Refinery utilisation, crack-spread levels and seasonal demand readings were likewise not captured.
4.5 Dollar and Cross-Asset (Dollar Index, Commodities Complex, Equity Risk Appetite)
The dollar index level and its session change were NOT CAPTURED IN THIS RUN, so this outlook makes no statement about the dollar's move on Friday. The shared sentiment summary captured at 04:11 PM ET carried the headline that the Bank of Japan delivered a split rate increase; no further detail on that decision was captured.
The monetary backdrop is the important cross-asset fact and it is restrictive. The Federal Reserve projections published at 02:00 PM ET on Wednesday, September 16 show twelve of eighteen officials expecting one further 25 basis point increase this year, four expecting two, and two expecting none. The rate decision itself was not captured in this run and is not characterised here. The captured market wrap headline described ten-year Treasury yields rising during Friday's session; no yield level or quote time was captured in this run, so no level is stated here. A central bank projecting further tightening into rising long-end yields is a demand headwind for crude on any horizon beyond the immediate geopolitical trade, and it is the main reason a 96 percent buy composite should not be read as a one-way signal.
Equities finished mostly higher with the broad index up 0.17 percent and the technology index up 0.67 percent, per the quote-provider commentary captured for the equity instruments in tonight's package, and the shared sentiment summary carried the headline that technology led as oil eased. The cross-asset relationship is currently running with crude weakness as an equity positive, which is the inflation-channel linkage and not the growth-channel one.
The one United States activity release captured for the session, per the shared calendar capture in the ES package, was industrial production at 09:15 AM ET, which printed 0.0 percent month over month against a 0.3 percent forecast, with capacity utilisation at 76.3 percent against a 76.4 percent forecast. Other activity data released during the session were not captured in this run.
4.6 Institutional Positioning (Commitments Data, Money Manager against Commercial Hedger, Speculator Length)
The weekly commitments data for the week ending September 15 was published at 04:21 PM ET Friday, after the settlement. This run captured the existence of that release but did not capture its component figures, so this outlook makes no claim about money manager net length, commercial hedger positioning or the direction of the week's change. That detail is a gap in this run's coverage and is recorded as such and not estimated.
What can be said about positioning comes from the curve and from open interest. Open interest in the November contract stands at 304,429 against 79,712 in October, and November's session volume of 300,567 is close to parity with its own open interest, which is the signature of an active roll and not of fresh directional accumulation. The 4.22 dollar backwardation to October says the physical market is paying for prompt barrels.
5. No liquid options proxy
This workflow covers crude without a positioning dataset. There is no equivalent of the exchange-traded fund proxies used for the equity and metals instruments that serves as a reliable read on crude dealer gamma positioning, and this outlook therefore makes no gamma, dealer-positioning or options-flow claims about crude at any point. Every level above is derived from price, from the published pivot and standard deviation ladders, and from the physical-market macro stack. The asymmetry is worth stating explicitly: the equity and metals outlooks in tonight's package carry a positioning layer that this one does not.
Positioning signal for crude comes instead from the weekly commitments report, published Fridays after the settlement (this run captured its publication at 04:21 PM ET; the scheduled release time itself was not captured), for money manager net length against commercial hedger net short; from the weekly government inventory report, Wednesdays at 10:30 AM ET, for crude stocks, gasoline, distillates, Cushing and strategic reserve movements; from the trade-association preview that conventionally precedes it by one session; from producer-group signals through the meeting calendar, Saudi and Russian media commentary, and quota compliance data; and from the front-month against second-month spread, where backwardation denotes physical tightness and contango denotes oversupply. That spread currently stands at 4.22 dollars in backwardation.
Night Session (06:00 PM ET Sunday to 03:00 AM ET Monday, Globex and Asia)
This is a Friday close, and the forecast addresses the Sunday reopen and the Monday session. Two full days of headline exposure separate Friday's 96.08 settlement from the first Monday print, and in a contract whose price is currently set by Middle East diplomacy that exposure is the single largest risk here. Gap levels in both directions are given below.
The contract reopens at 06:00 PM ET Sunday. By then one item on the weekend calendar will already have passed: the Chinese central bank's one-year and five-year loan prime rates at 09:00 PM ET Saturday, carried on the news-feed calendar captured for this run with forecasts of 3 percent and 3.5 percent against previous values of 3.00 percent and 3.50 percent respectively, unconfirmed against the verified forward calendar, and bearing on Asian demand expectations more than on crude directly. Bias into the reopen is mildly constructive given the post-settlement escalation headlines that Friday's settlement could not price.
Gap levels both ways. An upside gap through 96.31, the pivot point, and on toward the 5-day average at 97.74 would indicate the market re-pricing the Jazan and Abha reports as a genuine supply risk. A downside gap beneath 94.83, Friday's low, and into the 94.60 to 94.31 support grouping would indicate the weekend produced further diplomatic progress. The 14-day average true range of 3.57 means a reopen anywhere between roughly 92.51 and 99.65 is within one average day of Friday's settlement, and weekend gaps in crude routinely exceed that.
London Session (03:00 AM to 08:00 AM ET Monday)
European hours bring the first liquid pricing of whatever the weekend produced. The European Central Bank's Kazimir speaks at 04:30 AM ET (per the news-feed calendar captured for this run, unconfirmed against the verified forward calendar), the only European item on the calendar captured for Monday, and it is a monetary rather than an energy event. Bias through this window follows the reopen: if Asia has held above the pivot at 96.31, European hours typically extend toward the 5-day average at 97.74 and the first pivot resistance at 97.78. European refining demand remains the structural support under the product complex, with diesel near record levels, and any incremental pipeline-outage news would be priced here first.
Morning Session (09:00 AM to 12:00 PM ET Monday, United States Open and Pit Session)
The calendar captured for Monday contains no United States economic data release. The Federal Reserve's Goolsbee speaks at 06:30 AM ET, ahead of the equity cash open, and the Bank of Canada's Macklem speaks at 11:20 AM ET, per the news-feed calendar captured for this run, unconfirmed against the verified forward calendar. Neither is an energy set-piece, and the absence of scheduled data leaves the pit session to trade structure and headlines.
The level map for this window is the cleanest part of Monday's setup. The pivot point at 96.31 and the 5-day average at 97.74 sit immediately overhead; the first pivot support at 94.60 and the one standard deviation support at 94.31 sit immediately beneath, with Friday's low at 94.83 and the computed target price at 94.89 between the settlement and that grouping. A session that opens inside 94.60 to 96.31 and holds it is consolidating; a decisive resolution of either edge sets Monday's direction.
Afternoon Session (12:00 PM to 02:30 PM ET Monday, Pit Close)
The pit close falls at 02:30 PM ET and the settlement window immediately precedes it. The Reserve Bank of Australia's Hunter speaks at 03:00 PM ET, after that close, per the news-feed calendar captured for this run, unconfirmed against the verified forward calendar. Bias into the settlement depends on the morning resolution; the practical note is that Tuesday's pivot ladder is recomputed from Monday's high, low and settlement together, so its direction cannot be inferred from Monday's close alone; the references that carry into that computation are the pivot point at 96.31 and Friday's low at 94.83.
Night Session Forward (06:00 PM ET Monday)
Residual bias into the Monday evening reopen carries toward the weekly petroleum status report on Wednesday, September 23 at 10:30 AM ET, the week's first-order scheduled catalyst for this contract. The Reserve Bank of Australia's Bullock speaks at 11:10 PM ET, per the news-feed calendar captured for this run, unconfirmed against the verified forward calendar. Overnight Middle East headline risk remains the dominant unscheduled exposure and has been the dominant driver of every recent session.
Expected Range (Monday Full Session)
Low-range scenario: 94.83 to 97.78, a width of 2.95, or 0.78 times the 14-day average daily range of 3.78
Mid-range scenario (most likely): 94.31 to 98.01, a width of 3.70, essentially one 14-day average daily range
High-range scenario: the second pivot support at 93.13 to the second pivot resistance at 99.49, a width of 6.36, or 1.68 times the 14-day average daily range
Most Likely Path
The most likely path holds the settlement beneath the pivot point at 96.31 through the Asian and European sessions, works down into the 94.89 to 94.31 support grouping during the United States morning where the computed target price, Friday's low, the first pivot support and the one standard deviation support all sit within 0.58 dollars of one another, and finds buyers there given the directional index reading of 35.94 and the composite at 96 percent buy. From that grouping the path recovers toward the pivot at 96.31 and, on a firm session, the 5-day average at 97.74. The alternative path, which the weekend headline exposure makes materially possible, gaps above 96.31 at the Sunday reopen on renewed supply-disruption pricing and never offers the pullback entry at all. Scenario weightings in this outlook are analyst judgment and not derived frequencies.
Monday Economic Calendar
The week opens quiet by design. The forward calendar captured for this run shows no United States economic data release scheduled for Monday, September 21, which is consistent with the weekly commentary published at 04:11 PM ET Friday describing the week ahead as a quiet calendar against fragile sentiment. Readers should treat the absence of listed United States data as what this run's calendar capture shows and not as an exhaustive claim about every possible release.
Working through the day: Asian hours carry the residue of the Chinese central bank's one-year and five-year loan prime rate decisions from 09:00 PM ET Saturday, with calendar forecasts of 3 percent and 3.5 percent, per the news-feed calendar captured for this run, unconfirmed against the verified forward calendar. European morning brings the European Central Bank's Kazimir at 04:30 AM ET, per the news-feed calendar captured for this run, unconfirmed against the verified forward calendar. The United States morning has the Federal Reserve's Goolsbee at 06:30 AM ET ahead of the cash open, then the Bank of Canada's Macklem at 11:20 AM ET, per the news-feed calendar captured for this run, unconfirmed against the verified forward calendar. The afternoon carries no United States auction or data set-piece on the captured calendar; the Reserve Bank of Australia's Hunter speaks at 03:00 PM ET and Bullock at 11:10 PM ET, per the news-feed calendar captured for this run, unconfirmed against the verified forward calendar.
The single first-order event for crude is not on Monday at all. It is the weekly government crude inventory report on Wednesday, September 23 at 10:30 AM ET, with a previous print of a 0.640 million barrel draw. That report is also on the verified forward calendar at the same time. The crude calendar captured for this run stops there for the week; the following items come from the shared calendar captures in the GC, NQ and ES packages and not from crude's own capture. The same Wednesday carries the United States flash purchasing managers indices at 09:45 AM ET, which speak to demand, per the news-feed calendar captured for this run, unconfirmed against the verified forward calendar. Thursday, September 24 carries the Chinese state visit to the United States as an all-day calendar item, initial jobless claims at 08:30 AM ET with a forecast of 206.5 thousand (previous 196 thousand per the NQ capture), and a seven-year note auction whose time was not captured in this run, per the news-feed calendar captured for this run, unconfirmed against the verified forward calendar. Further out, the verified forward calendar lists the producer group's seven-country monthly meeting and the 68th joint ministerial monitoring committee meeting on October 4, 2026, with no time published. The news-feed calendar captured for this run, unconfirmed against the verified forward calendar, lists the short-term energy outlook winter edition for October 6, the producer-group monthly report for October 13, the international agency monthly oil report for October 14, and the next Federal Open Market Committee rate statement for October 28 at 02:00 PM ET.
The practical implication for Monday is that with no United States data release on the captured calendar, price is set by weekend headlines and by structure, and the mechanical levels carry more weight than usual.
Primary Trade Setup
Direction: Long
Rationale: The trend architecture is strongly constructive, with a 14-day directional index of 35.94, a positive directional component of 28.88 against a negative of 11.14, price above every moving average from the 20-day out to the 200-day, and a 96 percent buy multi-indicator composite. The session closed beneath its own pivot point on a de-escalation headline and not on any deterioration in the physical balance, and the forward curve remains 4.22 dollars in backwardation. That combination argues for buying the pullback into structural support and not for chasing the decline.
Entry Zone: 94.30 to 94.90
Stop Loss: 92.95 (beneath both the second pivot support at 93.13 and the third standard deviation support at 93.02, the pairing that defines the lower edge of the mechanical structure)
Target 1 (T1): 96.31 (the pivot point, the mechanical midpoint the session closed beneath)
Target 2 (T2): 97.78 (the first pivot resistance, confluent with the one standard deviation resistance at 97.85 and the 5-day moving average at 97.74)
Target 3 (T3, extended): 99.49 (the second pivot resistance, reached only if momentum extends through T2 on expanding volume)
Risk-to-Reward: Measured from the 94.60 midpoint of the entry zone against the 92.95 stop, risk is 1.65. Approximately 1:1.0 to T1, 1:1.9 to T2 and 1:3.0 to T3. T1 is the nearer objective and T2 the structural objective.
Invalidation: A settlement beneath 93.02, the third standard deviation support, breaks the pullback structure and converts the move from a retracement into a trend change. On an intraday basis, acceptance beneath 93.13 without immediate recovery is the working invalidation.
Stop distance versus volatility: The 14-day average true range of 3.57 is 3.72 percent of spot. The entry-to-stop distance of 1.65 is 46 percent of that range, well inside a single average day of movement for this contract, and the weekend gap exposure described above adds to that distance-to-volatility mismatch.
Macro override: Any of the following invalidates the setup in real time regardless of price: a coordinated emergency stock release announcement; confirmation that the Saudi East-West pipeline has returned to full rather than half capacity; a formal diplomatic settlement in the Iran conflict; or, in the opposite direction, confirmed damage to an export-critical node that would gap the contract through the upside levels and remove the entry entirely.
Session-timing condition: The Sunday reopen at 06:00 PM ET carries two days of unpriced headline exposure and pricing is likely to be disorderly through the first hours of Globex trade. The United States pit session opening at 09:00 AM ET Monday provides the first liquid test of the level map above.
Sources and methodology
This outlook is built from our session review of the November NYMEX WTI crude contract, CLX26, the November ’26 contract, prepared after Friday's close on September 18, 2026. Every level is computed from November, which leads the expiring October contract on both session volume and open interest; October settled at 100.30 on the same session and is carried for context only. Computed pivot levels come from Friday's session high, low and settlement as read from the daily bar, which the chart series reproduces on all five fields, and the daily bar does not time the low or the high, so no intraday path is asserted. This workflow carries no positioning dataset for crude, so no gamma, dealer-positioning or options-flow claim is made at any point.
Scenario ranges are analyst judgment; they carry no calibration. Contract months are kept separate throughout. Scheduled items marked unconfirmed come from the news-feed calendar captured for this run and were not verified against the verified forward calendar. The dollar index level and its session change, the ten-year yield level, the weekly commitments component figures, the session changes for the refined products, refinery utilisation and crack-spread readings, the 13-week and one-month range markers, the published moving-average crossing thresholds, period performance beyond the week, and the other-horizon true-range, daily-range, volatility, directional and stochastic readings were not captured in this run, and no figure is stated for any of them.
Thursday’s outlook for this contract is here, and Friday’s gold outlook, which shares this session's Middle East source pass, is here. Outlooks for ES, NQ, GC and CL are collected on the market outlook page, and our forward trading record is on the performance statement.



