
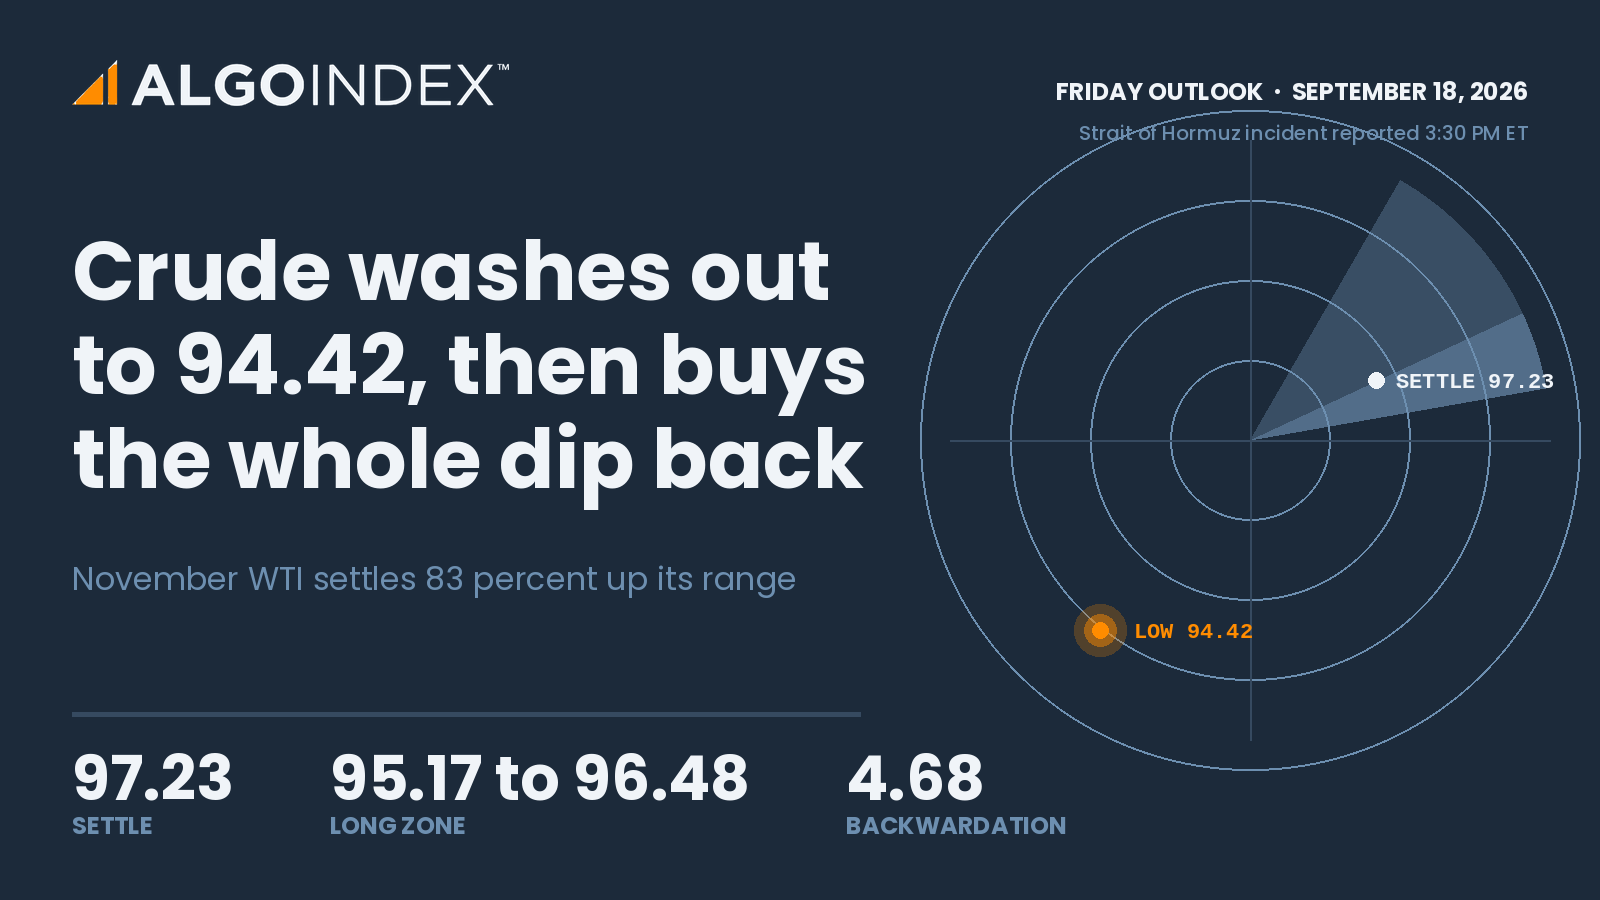
At 7:58 AM ET on Thursday, reports crossed that China had privately asked Iran to help rein in Yemen's Houthis after a Saudi appeal to Beijing. US officials were confirmed to have met the Houthis in Oman over the weekend. At 2:37 PM ET the State Department cleared Iran's core delegation to attend the UN General Assembly, and the Saudis had already signalled intent to resume half of the damaged pipeline within days. November WTI opened at 97.50 against a prior settlement of 97.75. It printed a session low of 94.42, 3.41 percent below that settlement.
It settled at 97.23, down 52 cents or 0.53 percent, 2.81 dollars above the low and 56 cents beneath the 97.79 session high. That is 83.4 percent of the way up a 3.37 dollar range. The daily bar does not time the low, so this outlook does not say when it printed or how many times it was tested. It does say the sellers got their move and could not hold it. The reopened session opened at 96.48, printed 96.35 at its low and was last read at 96.65, 58 cents beneath the settlement.
November WTI fell 3.41 percent intraday to 94.42 and settled at 97.23, 83 percent up its range, as de-escalation headlines released risk premium, a 3.4 percent washout, and the afternoon brought a Hormuz security incident and a call from Israel's prime minister to topple the Iranian government. Resistance is 97.71 to 97.79, the 5-day average beneath the session high, then the first pivot resistance at 98.54 and the second at 99.85. Support is the 96.48 pivot point, the first pivot support at 95.17 and the 94.42 session low. The primary setup is a long from 95.17 to 96.48, stop 94.25, targets 97.79, 98.54 and 99.85, alive only while 94.42 holds.
The contract changed under Thursday's outlook
Thursday's outlook was written on the October contract, which settled Thursday at 101.91 and expires. This outlook is on November, which settled 4.68 dollars beneath it at 97.23. Anyone reading the continuous chart saw a Wednesday close of 101.15 against a Thursday close of 97.23, a 3.9 percent decline that no actual contract experienced; the 101.15 reconciles with neither contract and is an artefact of the splice. Every figure here is on November alone.
That 4.68 dollar premium for nearer delivery is the most informative number in the session. Steep backwardation is a physical signal: barrels are wanted now, which fits a Saudi pipeline expected to need three to five weeks of repair according to officials cited in press reports. The structure held through Thursday's decline, which argues the selling was risk-premium compression. Brent settled at 104.82, 7.59 dollars above November, and was described on the news feed as down more than 2 percent before settling down 0.95 percent, a description taken from the feed itself. October diesel settled at 5.1139 dollars per gallon and October gasoline at 3.5073. Diesel above five dollars against gasoline near three and a half points to distillate as the binding constraint.
Pinned bullish, and extended
Every mechanical trend measure is pinned bullish. The multi-indicator composite reads 100 percent buy at strong conviction with all thirteen components agreeing, the most one-sided reading in the four-instrument set. The 14-day directional index is 35.29, with positive direction at 30.25 against negative at 11.90, better than two and a half to one. The 14-day relative strength index is 67.75, in the upper band beneath 70. Historic volatility runs 37.88 percent on the 14-day.
The stack is fully bullish and unusually wide. The 5-day average at 97.71 sits 48 cents above the settlement, the first time the shortest average has crossed above price in this advance and the earliest available signal of momentum fatigue. The 20-day at 89.28 is 8.18 percent beneath the settlement, the 50-day at 82.56 is 15.09 percent beneath it, and the 200-day at 73.11 is 24.81 percent beneath. Measured the other way, the settlement stands 8.90, 17.77 and 32.99 percent above those three averages. The year-to-date average is 75.05 and the year-to-date price change is 70.82 percent. A settlement 32.99 percent above its 200-day average is a trend that is intact and a trend with an extraordinary amount of empty space beneath it. Between the settlement and 89.28 there is very little except pivot mathematics.
The 52-week high, the 13-week high and the one-month high all sit at 101.69, 4.39 percent above the settlement, and the third pivot resistance computes to 101.91, which is also where October settled. Two methods inside 22 cents make that the most important resistance on the board. The one-month low is 78.54. Thursday's candle carried a 2.81 dollar lower shadow, a 27 cent body and a 29 cent upper shadow, a demand signature whose low becomes the reference the market trades against. November open interest is 295,173 contracts against 128,801 in October; the roll is complete.
Headlines, both ways
The afternoon reversed the morning's tone. A maritime authority reported a security incident in the Strait of Hormuz at 3:30 PM ET, 16 nautical miles northeast of Khasab, Oman. Twenty minutes later came the speech. Israel's prime minister said at a campaign launch at 3:51 PM ET that the mission must be completed and the Iranian government toppled. The US sanctioned a cryptocurrency exchange at 1:30 PM ET for enabling that government, and Iranian state media denied reports of an explosion near Kharg Island at 4:00 PM ET. Whether those headlines coincided with the recovery cannot be read from the daily bar. What can be read is the asymmetry: the de-escalation flow moved the contract 3.41 percent lower, and the settlement still finished 2.81 dollars above the low.
Crude was the independent variable on Thursday. Falling oil eased the inflation path, and that is why the broad index closed up 1.11 percent at 7,635.65 and the technology index up 1.70 percent at 29,436.60 one day after the Federal Reserve's first increase since July 2023. The ten-year yield sat near 4.950. The volatility index fell 12.81 percent to close near 15.45. The dollar index held near 100.238 in evening trade, down 0.10 percent, and a November settlement of 97.23 against a dollar near 100 is a point for the underlying bid. Russian seaborne product exports rose 16.4 percent in August against July as refineries returned from maintenance, still down roughly 50 percent from a year earlier, a mild bearish input at the margin. No refinery utilisation figure was preserved for this session, and no positioning report was either.
The trade map for Friday
The primary setup is a long from 95.17 to 96.48, the band between the first pivot support and the pivot point, with the stop at 94.25, a 17 cent buffer beneath the session low. The first target is 97.79, the session high with the 5-day average at 97.71 directly beneath it; the second is the first pivot resistance at 98.54; the third is the second pivot resistance at 99.85, only on momentum through the second with expanding volume.
From the 95.825 midpoint the risk is 1.575 dollars. The first target returns 1.965 dollars, 1.25 times that risk, the second 2.715 dollars or 1.72 times, and the third 4.025 dollars or 2.56 times. The top of the zone is worse. Filled there, the first target pays 1.31 dollars against 2.23 of risk, a ratio of 0.59, and the second 0.92, so an entry near 96.48 does not clear one unit of risk on either of the first two objectives. The 14-day average true range is 3.60 dollars, 3.70 percent of the settlement, with an average daily range of 3.65; Thursday's 3.37 dollar range sat just under it despite containing a 3.41 percent drawdown and a full recovery. A one-ATR day spans 93.63 to 100.83. Position sizing in this contract should run at one half to two thirds of the equivalent equity-index risk, and a stop beneath 75 to 100 cents is not defensible.
Friday's slate has no energy release. The verified calendar carries industrial production and capacity utilisation at 9:15 AM ET, expected at 0.3 percent against 0.2 percent and 76.4 percent against 76.3, the closest thing to a distillate demand read. Two speakers follow. Federal Reserve commentary from Bowman at 9:30 AM ET and Schmid at 11:45 AM ET is carried on the news calendar only and unconfirmed against a primary source, and its relevance runs through the dollar. Overnight, Japanese inflation at 7:30 PM ET and a Bank of Japan decision at 11:30 PM ET, expected to lift the rate to 1.25 percent from 1.00 percent, are likewise unconfirmed. The pit opens at 9:00 AM ET and closes at 2:30 PM ET. The next inventory report is Wednesday, September 23 at 10:30 AM ET, against a prior 0.640 million barrel draw, and the next producer-group meetings fall on Sunday, October 4. The first-order risk on Friday is an unscheduled headline. Friday is also, per the options positioning data rather than a verified calendar and unconfirmed, a quarterly equity expiration of exceptional size, and equity-driven dollar moves between 12:00 PM ET and 4:00 PM ET are noise for this contract unless the product complex confirms them.
Scenario ranges are analyst judgment. The low-range case runs 96.10 to 98.30, the most likely case 95.20 to 99.10 and the high-range case 93.60 to 100.90. The most likely path opens near 96.60, tests the 96.48 pivot early in European hours, holds the 95.17 to 96.48 band on the first attempt, and works back toward 97.71 to 97.79 into the pit open, attempting 98.54 on any dollar softness after the 9:15 AM ET data. The 99.85 objective requires a headline. Roughly one time in three, 95.17 gives way in European hours and 94.42 becomes the decision point for the whole structure, with 93.11 the second pivot support beneath it, 91.80 the third and 89.28 the first genuine base. Then the weekend. Trade closes Friday at 5:00 PM ET and reopens Sunday at 6:00 PM ET, roughly 49 hours of exposure to an active maritime incident and explicit government-change language.
Crude gaps on geopolitics more readily than any other contract we cover, and the weekend, not Friday, is where the risk lives.
The complete data picture
Every number behind Friday’s plan, charted first, then the full level map, then the complete numeric reference underneath.
Full numeric reference, every remaining figure from the session review
Level notes
97.71 to 97.79 is the immediate ceiling, where the 5-day moving average at 97.71 sits directly beneath the session high at 97.79. This is a narrow and well-defined band, and reclaiming it is the minimum requirement for any continuation case. The 5-day average crossing above price is the first momentum caution of this advance, so the band carries more weight than a single-day high normally would.
98.54 is the first pivot resistance, computed from Thursday's verified session bar. It sits 1.31 dollars above the settlement and represents the first mechanical objective on any Friday strength. There is no other structure at this price, which tends to make pivot levels cleaner rather than weaker.
99.85 is the second pivot resistance and the primary upside objective for the session. A move to this level would represent a 2.70 percent advance from the settlement, which is inside a single average-true-range day and therefore entirely reachable without an outsized catalyst.
101.69 to 101.91 is the confluence that defines the entire structure. The 52-week high, the 13-week high and the 1-month high all sit at 101.69, and the third pivot resistance computes to 101.91, which is also precisely where the expiring October contract settled. Two methods converging inside 22 cents, the structural high and the pivot mathematics, make this the most important resistance on the board. Sustained trade above it would confirm the geopolitical risk premium is rebuilding rather than unwinding.
104.82 is the Brent settlement and marks where the international grade is already trading, 7.59 dollars above WTI November. It is not a direct WTI resistance level, but it frames the spread and would come into view only on a genuine supply shock.
96.48 is the pivot point from Thursday's verified bar and the first line of defence, sitting 75 cents below the settlement. The current overnight session has already traded down to 96.35, marginally through it, which means Friday opens with this level in play rather than comfortably above it.
95.17 is the first pivot support and the lower edge of the 95.17 to 96.48 zone from which the primary setup is drawn. A 2.06 dollar decline from the settlement reaches it, well inside a normal session.
94.42 is the session low and the single most important support in this outlook. It is also the invalidation reference for the primary setup. A decisive break below it would mean the buyers who defended it on Thursday have stepped away, and there is very little structure between that price and the 20-day average.
93.11 is the second pivot support. Below the session low, this becomes the first mechanical objective for a continuation lower and would represent a 4.24 percent decline from the settlement.
91.80 is the third pivot support and the deepest level with any mechanical basis for Friday. Reaching it would require roughly 1.5 average-true-range units in a single session.
89.28 is the 20-day moving average, 8.18 percent below the settlement, and the first genuine structural support base beneath the pivot mathematics. It is not a realistic Friday objective, but it is where a trend failure would be adjudicated.
2.1 Intraday and Session Review
The November contract opened the Thursday session at 97.50, essentially unchanged against the prior settlement of 97.75, and printed a session low of 94.42, 3.41 percent below the prior settlement. That low is the single most important number in this outlook.
Whatever the path, the settlement at 97.23 landed 2.81 dollars above the low and just 56 cents below the session high of 97.79. A close 83.4 percent of the way up the range, on a day that opened near the highs and broke hard, is a rejection pattern rather than a distribution pattern. The sellers got their move and could not hold it.
The close quality deserves emphasis because it directly contradicts the headline percentage. The contract did not decline 0.53 percent in any meaningful sense. It declined 3.41 percent, found buyers, and recovered 2.98 percent off the low into the settlement. The residual half-percent is what was left over.
Post-settlement, the new Globex session that opened at 6:00 PM ET printed 96.48 at the open, 96.35 at its low and 96.65 at the last preserved read, roughly 58 cents below the Thursday settlement. That is early and thin and carries no directional information, but it does mean the contract enters Friday slightly below its settlement rather than above it.
2.2 Daily Structure
The daily structure is a strong uptrend at an extended point. The 1-month high at 101.69 is also the 13-week high and the 52-week high, meaning the highest print this contract has made in a year occurred within the last month. The settlement at 97.23 sits 4.39 percent below that high. The 1-month low is 78.54.
The forward curve is the most informative structural read available, and it is unambiguous. The expiring October contract settled at 101.91 while November settled at 97.23, a 4.68 dollar premium for the nearer delivery. Steep backwardation of that magnitude is a physical-market signal: it says barrels are wanted now, not later, which is consistent with a damaged Saudi pipeline expected to require three to five weeks of repair. Backwardation is structurally supportive of price, and it is the strongest argument against reading Thursday's washout as the beginning of a trend reversal.
One technical caution applies to anyone reading this contract on a continuous chart. The continuous series shows a discontinuity at the Wednesday to Thursday boundary: the Wednesday bar closes at 101.15 while the Thursday bar closes at 97.23 on November. The 101.15 reconciles with neither contract's implied Wednesday settlement, so it is recorded here as an unreconciled artefact of the splice rather than attributed to a contract. Day-over-day arithmetic spanning that boundary produces a roughly 3.9 percent decline that no actual contract experienced. Every figure in this outlook is computed on the November contract alone.
2.3 4-Hour and Swing Structure
The swing sequence remains higher-high and higher-low on the daily scale, and Thursday did not damage it. The 94.42 low sits well above the 1-month low of 78.54 and above every meaningful structural support from the last six weeks. What Thursday did produce is a long lower shadow on the daily candle, with a 2.81 dollar lower shadow beneath the 97.23 settlement, a 27 cent body between the 97.50 open and the settlement, and a 29 cent upper shadow above the 97.50 open. That shape is a demand signature, and its low becomes the reference point the market will trade against.
On the shorter swing scale the contract has been consolidating beneath the 101.69 high for roughly a month while the 20-day average has risen sharply from well below. The result is a compression between a fixed ceiling and a rising average, and compressions of that kind resolve with force in the direction of the prevailing trend more often than against it. The 5-day average at 97.71 now sits just above the settlement. A shortest-horizon average above price is the earliest available signal of momentum fatigue, and it is worth respecting without over-reading a single reading.
2.4 Moving Averages
The stack is fully bullish and unusually wide. The 5-day average sits at 97.71, 48 cents above the settlement. The 20-day sits at 89.28, which is 8.18 percent below the settlement. The 50-day sits at 82.56, 15.09 percent below. Measured the other way, the settlement stands 8.90, 17.77 and 32.99 percent above the 20-day, 50-day and 200-day averages. The year-to-date average is 75.05. The contract's year-to-date price change is 70.82 percent, which measures the move across the period rather than the distance from that average.
The interpretation cuts both ways. A stack in perfect ascending order with the settlement above every average except the 5-day, which sits 48 cents overhead, is the definition of an intact trend, and nothing in Thursday's session altered that. But a settlement 32.99 percent above the 200-day average is not a sustainable steady state, and it means any genuine trend failure has an extraordinary amount of unoccupied space beneath it. The 20-day at 89.28 is the first average that would function as real support, and it sits 8.18 percent below the settlement. Between the settlement and that average there is very little except pivot mathematics.
2.5 Oscillator and Trend Readings
The directional system is the strongest single reading in the package. The 14-day average directional index at 35.29 confirms a genuine trend rather than a drift. Positive direction at 30.25 against negative direction at 11.90 gives a ratio better than two and a half to one. Historic volatility runs 37.88 percent on the 14-day, elevated and consistent with a market pricing genuine headline risk.
The multi-indicator composite reads 100 percent buy with strength classified as strong and direction classified as average. All thirteen constituent indicators register buy signals across short, medium and long horizons. This is the most one-sided composite reading in tonight's four-instrument package by a wide margin.
2.6 Volatility and Expected Range
The 14-day average true range is 3.60 dollars, equal to 3.70 percent of the settlement. The 14-day average daily range is 3.65 dollars or 3.75 percent.
For risk framing this is the number that governs everything. A one average-true-range day from the 97.23 settlement spans 93.63 to 100.83. Thursday's actual range of 3.37 dollars was slightly below the 14-day average, which is remarkable given it contained a 3.41 percent drawdown and a full recovery. Position sizing in this contract should run at one half to two thirds of the equivalent risk taken in the equity index contracts, and stop placement below 75 to 100 cents is not defensible against a 3.60 dollar average range.
4.1 OPEC and Supply Policy (Quotas, Compliance, Saudi/Russia Signals)
The controlling supply fact is physical rather than political. A Saudi pipeline struck in recent attacks remains mostly out of service, with repairs estimated at three to five weeks according to officials cited in press reports. On Wednesday the Saudis signalled an intent to resume roughly half of the line's capacity within days, and that partial-restoration signal is the most plausible single explanation for the willingness of sellers to press the contract on Thursday morning. Its next producer-group entries are the seven participating countries' monthly meeting and the 68th joint ministerial monitoring committee, both dated Sunday, October 4 with no published time.
The steep backwardation, with October holding a 4.68 dollar premium to November, is the market's own verdict on supply policy: the physical market is tight now and expected to loosen later. That structure has persisted through Thursday's decline, which argues the selling was risk-premium compression rather than a reassessment of physical balances.
4.2 EIA and API Inventory (Crude Stocks, Gasoline, Distillates, Cushing, SPR)
The verified calendar carries no inventory entry for Thursday or Friday; its next inventory entry is the weekly petroleum status report on Wednesday, September 23 at 10:30 AM ET, against a prior print of a 0.640 million barrel draw quoted from the news calendar.
Product pricing offers an indirect read on the refining balance. October diesel settled at 5.1139 dollars per gallon and October gasoline at 3.5073 dollars per gallon. Diesel at better than five dollars against gasoline at three and a half is an unusually wide product relationship and points to distillate tightness as the binding constraint in the refined complex rather than motor fuel.
4.3 Geopolitical Backdrop (Middle East, Iran, Russia/Ukraine, Venezuela)
This is the dominant driver and the reason the contract carries a 70.8 percent year-to-date gain.
On the de-escalation side: reports at 7:58 AM ET that China had privately asked Iran to use its influence to rein in Yemen's Houthis following a Saudi appeal to Beijing; confirmation that US officials met the Houthis in Oman over the weekend; and a State Department position at 2:37 PM ET permitting Iran's core delegation to attend the UN General Assembly.
On the escalation side, and arriving later: a maritime authority report at 3:30 PM ET of a security incident in the Strait of Hormuz 16 nautical miles northeast of Khasab, Oman; a statement from Israel's prime minister at 3:51 PM ET at a campaign launch that the mission must be completed to the end and the Iranian government toppled; and US sanctions at 1:30 PM ET on a cryptocurrency exchange accused of enabling the Iranian government. Reports of an explosion near Kharg Island were denied by Iranian state media at 4:00 PM ET.
The asymmetry is the point. The de-escalation headlines moved the contract 3.41 percent lower.
4.4 Demand and Refining (Refinery Utilization, Crack Spreads, Seasonal Pattern)
The available demand read is indirect and comes from the product complex and from consumer-facing commentary noting that fuel is expensive in the US without any physical shortage of gasoline, which is consistent with margin expansion at the refiner rather than a retail supply problem. Russian seaborne oil product exports rose 16.4 percent in August against July as refineries returned from maintenance, though they remain down roughly 50 percent against last year. Incremental Russian product supply is mildly bearish at the margin and works against the tightness the backwardation implies.
Seasonally, mid-September sits in the transition between summer driving demand and winter distillate building. The unusually wide diesel-to-gasoline relationship suggests the market is already positioning for the heating season, and a winter fuels outlook report that the news feed places on October 6, a date absent from the verified calendar and therefore unconfirmed, is the next item that speaks directly to it.
4.5 Dollar and Cross-Asset (DXY, Commodities Complex, Equity Risk-On/Off)
The dollar index was last near 100.238 in evening trade after the 4:00 PM ET equity close, down 0.102 or 0.10 percent, having held most of the gains it took on Wednesday's rate decision. A firm dollar is a headwind for dollar-denominated crude, and the fact that November held a 97.23 settlement against a dollar near 100 is a point in favour of the underlying bid.
Falling crude was the proximate cause of the equity and bond rally, not a consequence of it. Equities advanced because cheaper oil eased the inflation path, with the broad index closing at 7,635.65 for a 1.11 percent gain and the technology index at 29,436.60 for 1.70 percent. The ten-year yield sat near 4.950, down 0.003. Down 12.81 percent on the day, the volatility index closed near 15.45. Crude is currently the independent variable in the macro system, and the equity market's direction on Friday is partly a function of where this contract trades.
4.6 Institutional Positioning (COT, Money Manager vs Commercial Hedger, Speculator Length)
It falls after the pit close and therefore cannot influence the Friday pit session, but it can shape the Globex reopen.
November open interest stands at 295,173 contracts against 128,801 in the expiring October contract, confirming the roll is complete and liquidity has migrated. The 4.68 dollar backwardation is the cleanest available proxy for commercial positioning and points to physical tightness. Absent a current report, any claim about speculative length would be invention, and none is made here.
Options positioning context
No dealer-positioning level, flip threshold or hedging boundary appears in this outlook or in the published post, because none was sourced.
Commitments of traders (a standing weekly release, Friday 3:30 PM ET timing unconfirmed for this week and absent from the verified calendar) for money manager net length against commercial hedger net short.
Weekly petroleum status inventory (Wednesday 10:30 AM ET) for crude stocks, gasoline, distillates, Cushing and reserve releases. Next print Wednesday, September 23.
Front-month to second-month spread, which is the most responsive of the available measures and currently reads a 4.68 dollar backwardation, signalling tight physical supply.
Open interest, currently 295,173 on the November contract.
Producer-group signals, with the verified calendar's next entries being the participating countries' monthly meeting and the joint ministerial monitoring committee on Sunday, October 4.
Night Session (6:00 PM ET Thursday to 3:00 AM ET Friday, Globex/Asia)
Mildly negative drift with genuine two-way headline risk. The reopened session opened at 96.48, printed 96.35 at its low and was last read at 96.65, so its low sat beneath the 96.48 pivot. The dominant scheduled catalyst is monetary rather than energy: the Bank of Japan decision is carried on the news calendar at 11:30 PM ET with a tentative statement time, and it is absent from the verified calendar, so both the date and the clock are unconfirmed; the feed's consensus is a 1.25 percent rate against 1.00 percent previously, an outright hike that would firm the yen and carries a second-order dollar effect. Japanese inflation data is carried on the same news calendar at 7:30 PM ET, likewise unconfirmed against the verified calendar, with headline expected at 2.0 percent and core at 1.8 percent. Neither speaks to crude directly, but a materially stronger yen against a softer dollar would be mildly supportive. Expected Globex range 95.90 to 97.60, skewed lower, with the caveat that any Hormuz or Iranian headline overrides the entire distribution.
London Session (3:00 AM to 8:00 AM ET Friday)
European hours carry the greatest concentration of Middle East headline flow. Scheduled European data is second-tier: the news calendar carries UK retail sales and German producer prices at 2:00 AM ET, just before the window opens, and euro-area inflation expectations at 4:00 AM ET; none of the three appears in the verified calendar, so the times are unconfirmed, and none of these is a crude catalyst. The risk in this session is entirely headline-driven, and the level that matters is 95.17. Holding it through European hours is the precondition for the primary setup.
Morning Session (9:00 AM to 12:00 PM ET Friday, US Open / Pit Session)
The pit opens at 9:00 AM ET into a light but not empty data slate. US industrial production and capacity utilisation print at 9:15 AM ET, with production expected at 0.3 percent against 0.2 percent prior and utilisation at 76.4 percent against 76.3 percent. Industrial production is a direct if lagging demand read for distillate. The news calendar carries Federal Reserve Governor Bowman at 9:30 AM ET, which would be the first official commentary since Wednesday's hike, and Schmid at 11:45 AM ET; neither appears in the verified calendar, so both times are unconfirmed. Hawkish commentary that firms the dollar is mildly negative for crude. The level map for this window is 96.48 as the pivot, 97.71 to 97.79 as the ceiling, and 95.17 as the line that defines the session's character.
Afternoon Session (12:00 PM to 2:30 PM ET Friday, NYMEX Pit Close)
The pit closes at 2:30 PM ET. The complicating factor is that Friday is, per the options positioning data rather than a verified calendar and unconfirmed, a quarterly equity index expiration of exceptional size, and the associated positioning flows can move the dollar and the broad risk environment in ways that spill into crude without any energy-specific cause. Equity-driven dollar moves between 12:00 PM ET and the 4:00 PM ET equity close are noise rather than signal for this contract unless the product complex confirms them.
Night Session Forward (Sunday 6:00 PM ET reopen)
Trade closes Friday at 5:00 PM ET and does not reopen until Sunday at 6:00 PM ET, which carries the week's highest gap risk. The commitments-of-traders report is a standing weekly release whose 3:30 PM ET Friday timing is unconfirmed for this week and absent from the verified calendar, and the weekend introduces roughly 49 hours of unhedged exposure to a Middle East situation with an active maritime incident in the Strait of Hormuz and explicit government-change language from Israel's prime minister. Positions carried across the weekend should be sized on that basis rather than on Friday's realised volatility.
Expected Range (Friday Full Session)
Low-range scenario: 96.10 to 98.30
Mid-range scenario (most likely): 95.20 to 99.10
High-range scenario: 93.60 to 100.90
Most Likely Path
The most probable Friday path opens near 96.60, tests the 96.48 pivot early in European hours, and holds the 95.17 to 96.48 band on the first attempt. From there Thursday's close-off-the-low shape repeats on a smaller scale, with the contract working back toward 97.71 to 97.79 into the US pit open and attempting 98.54 on any dollar softness following the 9:15 AM ET production data. The 99.85 objective requires a headline. The alternative path, roughly a third as likely, sees 95.17 give way during European hours, at which point 94.42 becomes the decision point for the entire structure and a failure there opens 93.11 quickly. What makes the upside path the base case is not momentum but the settlement's position 83 percent up Thursday's range, the unbroken backwardation, and a composite reading that has not registered a single component sell signal.
Friday Economic Calendar
The session's catalysts begin overnight, and every overnight item below comes from the news calendar, is absent from the verified calendar, and is therefore unconfirmed. Japanese inflation is carried at 7:30 PM ET Thursday with headline expected at 2.0 percent and core at 1.8 percent, and Australia's central bank governor is carried at the same hour. The Bank of Japan decision is the most consequential item in the overnight window: the feed's consensus expects a hike to 1.25 percent from 1.00 percent, and the yen reaction carries into the dollar and therefore into crude. It is carried at 11:30 PM ET with a tentative statement time, so the release may not land on that clock. European hours bring UK retail sales and German producer prices at 2:00 AM ET and euro-area inflation expectations at 4:00 AM ET on the same unconfirmed basis, none of which is a direct crude input.
The US morning is where the identifiable risk sits. Industrial production and capacity utilisation arrive at 9:15 AM ET, the one Friday entry in the verified calendar, expected at 0.3 percent and 76.4 percent respectively on the news-feed consensus, and industrial production is the closest thing on the slate to a demand signal for distillate. The news calendar carries Federal Reserve Governor Bowman at 9:30 AM ET and Schmid at 11:45 AM ET, which would be the first official comments since Wednesday's rate decision; neither appears in the verified calendar, so both times are unconfirmed. Their relevance to crude runs through the dollar.
The single first-order event for crude on Friday is none of the above. The verified calendar's next energy entries are the weekly petroleum status report on Wednesday, September 23 at 10:30 AM ET against a prior 0.640 million barrel draw, and the producer-group meetings on Sunday, October 4.
Primary Trade Setup
Direction: Long
Rationale: Thursday's 3.41 percent washout to 94.42 was bought back to a settlement 83 percent of the way up the session range, while the forward curve held a 4.68 dollar backwardation and the multi-indicator composite registered 100 percent buy with no dissenting component. The structure favours continuation until the session low fails.
Entry Zone: 95.17 to 96.48
Stop Loss: 94.25, set beneath the 94.42 session low
Target 1 (T1): 97.79 (the session high, with the 5-day moving average at 97.71 immediately beneath it)
Target 2 (T2): 98.54 (the first pivot resistance from the verified session bar)
Target 3 (T3, extended): 99.85 (the second pivot resistance, only on momentum extension through T2 with expanding volume)
Risk-to-Reward: Approximately 1:1.25 to T1, 1:1.72 to T2, 1:2.56 to T3 from the midpoint of the entry zone. Filled at the top of the zone the ratio to T1 falls to 0.59 and to T2 to 0.92, so an entry near 96.48 does not clear one unit of risk on either of the first two objectives. The stop sits a 17 cent buffer under the session low, which respects the minimum stop discipline a 3.60 dollar average true range requires.
Invalidation: A decisive session close below 94.42 negates the thesis. That level was established in Thursday's washout and the daily bar closed 2.81 dollars above it, so a break through it means the demand that defined Thursday has withdrawn, and the next mechanical support is 93.11 with little structure until the 20-day average at 89.28.
Macro override: A confirmed escalation in the Strait of Hormuz, a strike on Iranian export infrastructure, or an announcement that the damaged Saudi pipeline will remain offline beyond the five-week estimate would gap this contract higher and render the entry zone unreachable. In the opposite direction, a credible US-Iran negotiation announcement or a faster-than-expected pipeline restoration would break the risk premium and carry price through the 94.42 invalidation without the setup ever activating. Both are live, and the Sunday 6:00 PM ET reopen that follows the Friday 5:00 PM ET close is where either would express itself.
Sources and methodology
This outlook is built from our session review of the November NYMEX WTI crude contract, prepared after Thursday's close on September 17, 2026. The session high and low come from a direct read of the daily bar, which does not time the low or the high; the pivot ladder is computed from that bar and can differ from published ladders by up to 45 cents. Evening prices come from the reopened session read. Moving-average distances are our own arithmetic against the settlement. No options-positioning dataset is used for crude, so no dealer-positioning claim appears in this outlook.
Scenario ranges are analyst judgment; they are not statistically derived and carry no calibration. Contract months are kept separate throughout. Scheduled items marked unconfirmed come from a news calendar and were not verified against a primary source.
Thursday’s outlook for this contract is here. Outlooks for ES, NQ, GC and CL are collected on the market outlook page, and our forward trading record is on the performance statement.



