
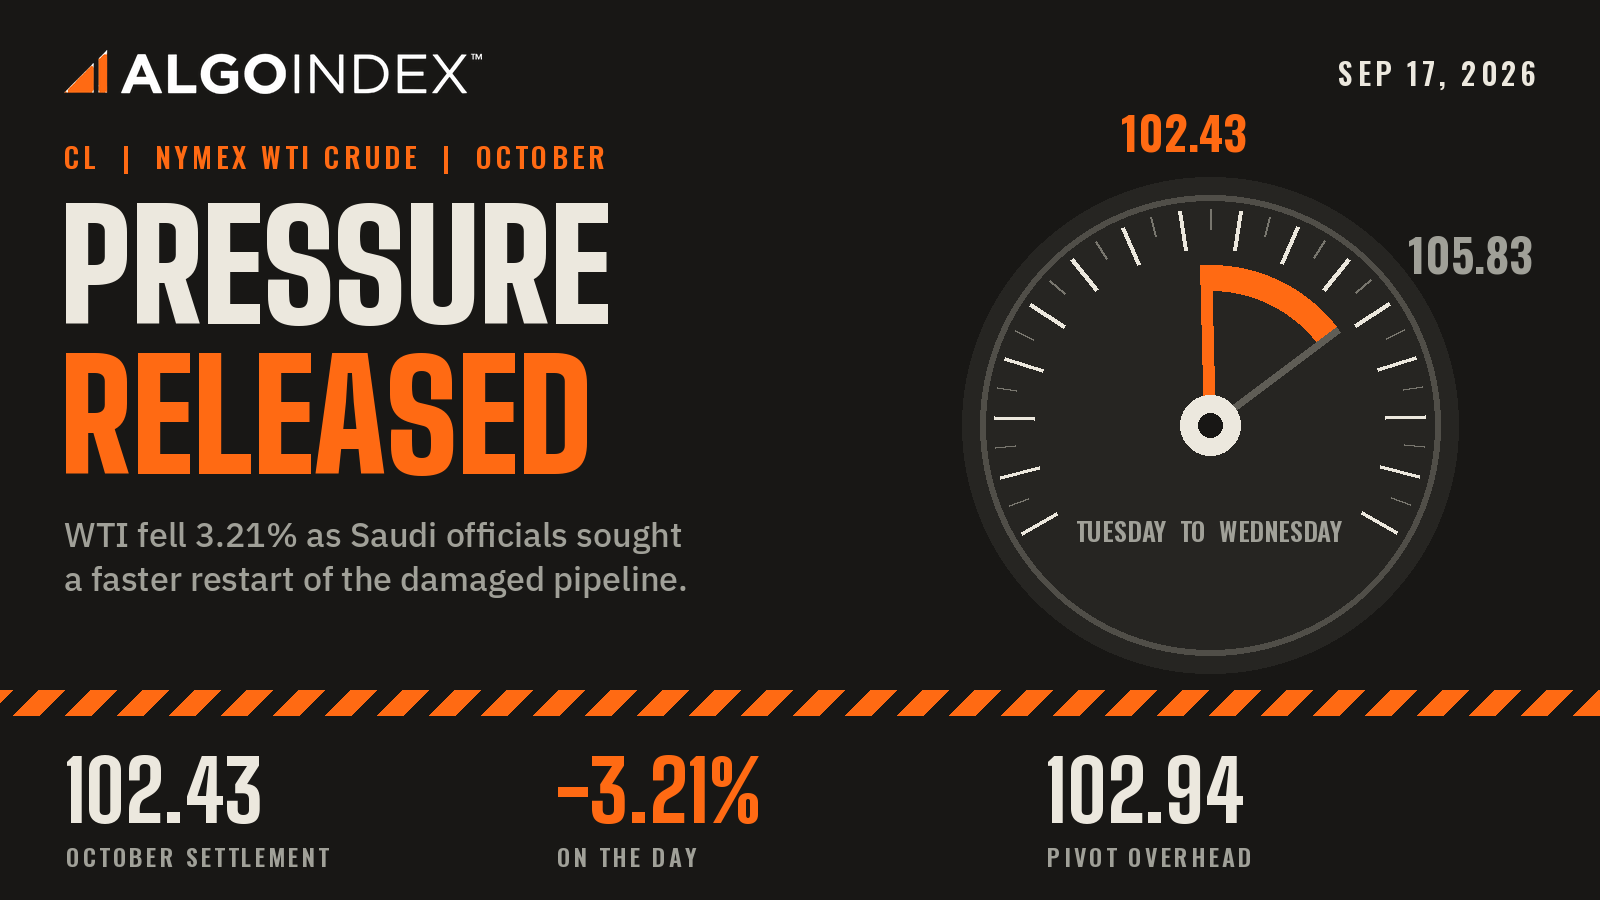
At 10:30 AM ET on Wednesday the weekly government inventory report showed a crude draw of 0.640 million barrels against a forecast draw of 1.5 million. At 11:47 AM ET press reports carried Saudi officials seeking to resume half of the pipeline capacity struck on September 10 within days, against a working estimate of three to five weeks of repairs. Two bearish headlines, 77 minutes apart. October WTI settled at 102.43, down 3.40 or 3.21 percent from Tuesday's 105.83.
A market holding a large geopolitical premium does not need that premium removed to fall. It only needs it to stop growing. The international benchmark settled at 105.83 at 2:49 PM ET, down 2.92 or 2.69 percent, leaving a 3.40 spread over October WTI. After the 6:00 PM ET reopen, crude opened at 102.18, touched 102.24, slid to 101.07 and recovered to 102.16 by 9:31 PM ET, still below Wednesday's settle.
October WTI crude settled at 102.43, down 3.21 percent, after a smaller inventory draw and faster Saudi pipeline repair plans, then traded 101.07 to 102.24 in the evening. Resistance sits at the 102.94 pivot, the 103.08 target price and the 103.32 stochastic stall. Support starts at the 102.39 relative strength threshold, then about 100.75 and the 100.24 to 100.26 confluence. The primary setup is a short from 102.40 to 102.95, stop 103.85, targets about 100.75, 100.24 and 98.67.
Wednesday's long, stopped
Our Wednesday outlook bought 103.40 to 104.60 with a 102.30 stop and a first target at 106.75. Crude opened beneath Tuesday's settle, traded down through the entry and cut through the stop on its way to about 100.75. The high of about 105.63 never came near 106.75. That trade was a loss.
The pivot reconstruction puts the session between about 105.63 and about 100.75, rounded to the 0.01 tick. The 4.88 range measured 1.20 times the 4.06 average daily range and 1.23 times the 3.98 average true range. The settle came in about 34 percent of the way up it, 1.68 above the low, and 0.51 beneath the 102.94 pivot that governs Thursday. It was the worst day of the move.
A violent day inside an intact trend
The trend architecture barely noticed. The 9-day directional index reads 53.23, with positive direction at 31.90 against 5.52 negative. The 14-day reads 36.74 with 32.30 against 8.11. The multi-indicator composite sits at 100 percent buy with strong signal strength, all 13 of its studies pointing the same way. The settle stays 11.16 percent above the 20-day average at 92.15 and 37.69 percent above the 200-day at 74.39. Crude is up 20.39 percent over 20 sessions and 75.08 percent over 200, and 83.29 percent above its 55.52 52-week low. A market that far above its 20-day average has little mean-reversion cushion beneath it.
Momentum sits on a boundary. The 14-day relative strength index crosses 70 at 102.39, four cents beneath the settle, and it read 68.12 later in the evening. On the 9-day window the stochastic percent K, at 80.79, has slipped under percent D at 83.19, a near-term warning inside the bullish structure. The 52-week, 13-week and one-month highs all sit at 106.75, 4.32 above the settle. One number caps every lookback window.
Supply relief meets a firmer dollar
The supply story ran through infrastructure. Faster pipeline restoration compresses the outage the market had been pricing, and it arrived while crude was already offered. After the settle, press reports at 4:56 PM ET and 4:57 PM ET carried a major producer close to a preliminary deal to re-enter Venezuela, on fields cited at 50 billion barrels, a multi-year consideration with no near-term barrel impact.
The premium is still there. Tanker day rates were reported above one million dollars for the first time on record. A 6:59 AM ET report on Wednesday said US officials had met Houthi representatives in Oman after an Iran-backed group seized a strategic stretch of coast. Crude gaps on geopolitical headlines more readily than the index contracts, and overnight sessions carry that exposure with no scheduled release to anchor them.
Cross-asset pressure joined in. The Fed's increase to 4.00 percent came with a median path above forecast at every horizon, and the dollar climbed while the 10-year yield hovered near 5 percent. Both hurt crude. A firmer dollar is a headwind for a dollar-priced commodity, and higher real yields raise the cost of carrying inventory. Retail sales rose 1.2 percent against a 0.8 percent forecast, a strong consumer that supports product demand and also helped justify the increase. Reports of crude above 100 pushing US fuel prices to records suggest demand destruction has started to operate. Gold felt the same dollar move after its settlement.
Participation has broadened during the advance. Open interest stands at 145,252 contracts, and five-session average volume of 293,118 runs 2.18 times the 100-day average of 134,604.
The trade map for Thursday
The primary setup is a short from 102.40 to 102.95 on a retest of the overhead band, where the 102.39 relative strength threshold, the 102.94 pivot and the 103.08 target price sit within 69 cents. The stop at 103.85 sits above the 103.32 stochastic stall, a 90-cent buffer from the top of the zone. Targets are about 100.75, the reconstructed session low, then 100.24, the first pivot support with one standard deviation support two cents above at 100.26, and 98.67, three standard deviations support.
Risk to reward runs about 1:1.6 to the first target, 1:2.1 to the second and 1:3.4 to the third. From the less favorable 102.40 edge the first target still pays more than the risk, 1.65 against 1.45. A decisive reclaim of 102.94 followed by acceptance above 103.32 negates the short and brings 104.60 and the approximate 105.12 to 105.63 zone back into play. A re-escalation headline from the Gulf or the Red Sea, or reporting that pushes the pipeline repair estimate back toward three to five weeks, cancels the setup regardless of price. A materially stronger dollar after a poor 1:00 PM ET auction would add to the short. October expires on or about Tuesday, September 22, with four sessions left, and liquidity in that contract thins as expiry approaches.
Above the shelf, resistance runs through 104.60, 105.12, 105.50, 106.19 and 106.75, with 107.12, 107.82 and 110.00 beyond. Below, 101.07 is the evening low, then about 100.75, the 100.24 to 100.26 confluence, 99.36, 99.09, 98.92, 98.67 and 98.06. The 38.2 percent retracement of the four-week high sits at 96.39, with 95.68 and 95.36 under it, and the 20-day average at 92.15 is the first structural support, 10.28 beneath the settle.
Nothing crude-specific is scheduled on Thursday. Eurozone inflation lands at 5:00 AM ET, an ECB official speaks at 6:00 AM ET and the Bank of England decides at 7:00 AM ET. No oil report follows. Claims, building permits, housing starts and Canadian producer prices arrive at 8:30 AM ET, pending home sales at 10:00 AM ET and the 10-year inflation-protected auction at 1:00 PM ET, the first-order scheduled event for crude through the dollar and real yields. The evening brings New Zealand trade data at 6:45 PM ET, Japanese inflation at 7:30 PM ET forecast at 2.0 percent headline and 1.8 percent core, a Reserve Bank of Australia official at 7:30 PM ET and the Bank of Japan at 11:30 PM ET, forecast at 1.25 percent against 1.00 percent.
Scenario ranges are analyst judgment. The low-range case runs 100.24 to 102.94. The most likely case runs 99.36 to 103.32, a 3.96 span of 0.99 average true ranges, and the high-range case spans 98.06 to 105.12. Session bands run 100.75 to 102.40 overnight, 100.24 to 102.94 through London, 100.24 to 103.32 in the morning and 100.24 to 103.08 into the 2:30 PM ET pit close. Wide bands, all of them. The most likely path works down into the 100.24 to 100.26 confluence, then attempts a recovery into 102.39 to 103.08, where the short is expressed. A decisive break instead opens 99.36 and the 98.67 to 98.92 shelf.
A 14-day average true range of 3.98 is worth roughly 3,980 dollars per contract, and Thursday's first arithmetic test sits four cents beneath the settle.
The complete data picture
Every number behind Thursday’s plan, charted first, then the full level map, then the complete numeric reference underneath.
Full numeric reference, every remaining figure from the session review
Level notes
102.94, pivot point. The governing level for Thursday and the first thing the market must reclaim. Wednesday settled 0.51 beneath it, which puts crude on the bearish side of its own next-session pivot arithmetic.
103.08, target price. The data source's computed objective sits 14 cents above the pivot, tightening the two into a single narrow shelf at 102.94 to 103.08 that is the natural first rejection area.
103.32, 14-day stochastic stall. The level at which the fast stochastic loses momentum, 24 cents above the target price and completing an overhead grouping that spans 102.94 to 103.32.
104.60, one standard deviation resistance. The first genuinely separated ceiling above the pivot shelf, computed from the trailing five-session close distribution. A move through here would signal the pullback has been rejected rather than paused.
105.12, pivot first resistance. Sits just above the one standard deviation band and 0.51 below Wednesday's completed high, making the 105.12 to 105.63 area the decisive reclaim zone for the bull case.
105.50, two standard deviations resistance. Reinforces the same shelf and sits inside Wednesday's high, so this band and the completed high act as one obstacle rather than two.
106.19, three standard deviations resistance. The outer edge of the statistical envelope, 56 cents beneath the structural ceiling.
106.75, 52-week, 13-week and one-month high. The single most important number above the market. All three lookback windows resolve to the same price, so this is the whole structure's ceiling; a decisive settle above it would leave crude in open air with the next published references at 107.12 and 107.82.
107.82, pivot second resistance, and 110.00, pivot third resistance. The extended pivot targets, relevant only on a supply-shock re-escalation. The 107.12 moving-average crossover stall sits between the structural high and the second pivot.
102.39, 14-day relative strength 70 threshold. Four cents beneath the settle. Not a price-structure level but the momentum boundary, and the first arithmetic line Thursday crosses.
100.75, Wednesday's completed session low. Back-solved from the published pivot ladder and verified against all seven rungs. The last defended price of the completed session and the first objective of any continuation lower.
100.24 to 100.26, pivot first support and one standard deviation support. The highest-value confluence on the board: the pivot first support at 100.24 and the one standard deviation support at 100.26 sit two cents apart. Two independently computed methods landing on the same price is the strongest support evidence available in this level set, and it is the objective that pays for Thursday's risk.
99.36, two standard deviations support. The next statistical band, 88 cents below the confluence, and the level that would confirm the pullback has become a trend event rather than a retracement.
99.09, price crosses the 9-day moving average. Sits 27 cents beneath the two standard deviation band, pairing with it into a second grouping at 99.09 to 99.36.
98.92, 14-3 day raw stochastic 70 percent, and 98.67, three standard deviations support. The outer edge of the statistical envelope together with the point at which the raw stochastic leaves overbought, a 25 cent shelf.
98.06, pivot second support. The extended pivot objective, 61 cents below the three standard deviation band, and the deepest level that Thursday's arithmetic can reach inside one average range.
96.39, 38.2 percent retracement of the four-week high, then 95.68 at the moving-average convergence stall and 95.36 at pivot third support. This grouping is beyond one average session from the settle and becomes relevant only on a supply-relief acceleration.
92.15, 20-day moving average. The first support that is structural rather than computed, 10.28 beneath the settle. Nothing in Wednesday's decline has engaged it.
2.1 Intraday and Session Review
The completed Wednesday session settled at 102.43. Its pivot reconstruction implies a high near 105.63 and a low near 100.75 after rounding to the contract's 0.01 tick. Neither extreme was read directly from a bar. The data data source had already rolled its quote date forward to Thursday, September 17 by the time this outlook was assembled, so the displayed day high, day low and open belong to the new Globex session rather than to Wednesday. The unrounded reconstruction was verified against all seven published pivot rungs, but the rounded values are approximate completed-session references rather than independently observed prints.
The shape of the session was a persistent one-way grind rather than a single shock. Crude opened beneath Tuesday's 105.83 settle and spent the entire session failing to reclaim it, with the 105.63 high arriving 0.20 short. The low of 100.75 was set after the two late-morning supply catalysts had been digested, and the 102.43 settle represents a recovery of 1.68 off that low into the settlement. That close quality is the one constructive detail in an otherwise poor session: the market did not settle on the low, and it clawed back roughly a third of the day's range in the afternoon. The settle nonetheless sits below Thursday's 102.94 pivot, which is the reading that matters for positioning.
2.2 Daily Structure
The entire upper structure of this market resolves to one number. The 52-week high, the 13-week high and the one-month high are all 106.75, which sits 4.32 or 4.22 percent above Wednesday's settle. Wednesday's 105.63 high came 1.12 below that shared ceiling. On the downside the one-month low is 79.62, the 13-week low is 67.12 and the 52-week low is 55.52, which frames how far and how fast this advance has travelled: the contract is 83.29 percent above its own 52-week low on the published figure.
Wednesday's daily bar is a wide-range down candle that opened below the prior settle, never traded above it, and closed about 34 percent of the way up its reconstructed range, in the lower-middle rather than the upper half. Against the 20-day moving average at 92.15 the settle remains 10.28 higher, so no part of this decline has yet engaged the medium-term trend structure. The 5-day moving average at 102.26 is the only average in immediate contact: the settle is 0.17 above it, which means the short-term mean has caught up to price entirely and the first genuine test of trend support is now live rather than distant.
2.3 4-Hour and Swing Structure
The swing sequence through Wednesday is a lower high against Tuesday followed by a decisive break of the prior session's low, which is the first change of character in the advance since the September 10 supply shock. The 9-day raw stochastic at 71.44 percent sits meaningfully below the 20-day at 81.02 percent and the 50-day at 85.80 percent, which is the signature of a short-term rollover inside an intact longer-term uptrend rather than a structural top: the fast oscillator is cooling while the slow ones remain pinned near their highs.
The published turning-point map gives the swing structure its overhead reference points. The 14-day percent-K stochastic stalls at 103.32, the 3-10 day moving-average crossover stalls at 107.12, and the target price sits at 103.08. Below the market, the price crosses its 9-day moving average at 99.09, the 14-3 day raw stochastic reaches 70 percent at 98.92, and the 38.2 percent retracement of the four-week high is 96.39. Those three form the next lower shelf if the 100.24 area gives way.
2.4 Moving Averages
The stack is in full bullish order with price above every average, and the separation is extreme. Using Wednesday's 102.43 settle, our arithmetic gives the following distances: the 5-day at 102.26 is 0.17 or 0.17 percent below price, the 20-day at 92.15 is 10.28 or 11.16 percent below, the 50-day at 84.72 is 17.71 or 20.90 percent below, the 100-day at 82.54 is 19.89 or 24.10 percent below, the 200-day at 74.39 is 28.04 or 37.69 percent below, and the year-to-date average at 76.48 is 25.95 or 33.93 percent below. Those percentages are this outlook's own arithmetic against the published averages and are labelled as derived.
Separately, and not to be confused with the above, the published figures show period price changes measured from the live quote: down 0.86 percent over five sessions, up 20.39 percent over twenty, up 39.64 percent over fifty, up 26.37 percent over one hundred, up 75.08 percent over two hundred, and up 78.40 percent year to date. Average volume runs 293,118 over five sessions, 287,406 over twenty, 210,220 over fifty and 134,604 over one hundred, so participation has roughly doubled against the 100-day baseline as the move has extended.
The operative point is that a market 11 percent above its 20-day average and 38 percent above its 200-day has no mean-reversion cushion beneath it. The first support that is structural rather than arithmetic does not begin until the low 90s, which is why the pivot and standard-deviation grid carries the entire near-term level map.
2.5 Oscillator and Trend Readings
Relative strength reads 67.73 on the 9-day, 68.12 on the 14-day, 66.58 on the 20-day, 60.72 on the 50-day and 58.01 on the 100-day. The 14-day figure at 68.12 is just under the 70 boundary, and the published cross point for 70 is 102.39 against a 102.43 settle, so the oscillator is effectively sitting on the line.
Stochastics remain elevated across every window and are the clearest overbought evidence in the set. The 9-day reads 71.44 percent raw with percent-K at 80.79 and percent-D at 83.19; the 14-day reads 78.98 percent raw with percent-K at 86.35 and percent-D at 87.76; the 20-day reads 81.02 percent raw; the 50-day reads 85.80 percent; the 100-day reads 87.00 percent. Every percent-K sits above its raw reading, while the 9-day percent-K now sits below percent-D, a near-term momentum warning inside the still-bullish larger structure.
The directional index is the strongest argument against reading Wednesday as a top. The 9-day directional index is 53.23 with positive directional movement at 31.90 against negative at 5.52, a spread of 26.38 in favour of the uptrend even after a 3.21 percent down day. The 14-day reads 36.74 with positive at 32.30 against negative at 8.11. The 20-day reads 26.86, the 50-day 14.78 and the 100-day 11.48, so trend strength is concentrated in the short window and decays as the lookback lengthens, exactly what a recent news-driven impulse produces. Historic volatility is 46.19 percent on the 9-day, 41.33 percent on the 14-day, 41.08 percent on the 20-day, 46.33 percent on the 50-day and 44.06 percent on the 100-day.
The multi-indicator composite is at 100 percent buy with strong signal strength and average signal direction, with all thirteen constituent studies reading buy across the short, medium and long-term blocks. That reading is a trend-following measurement and it lags a one-day reversal by construction, which is precisely why it should not be treated as a forward opinion on Thursday. It is recorded here as evidence that nothing in the trend architecture has broken yet.
2.6 Volatility and Expected Range
Average true range is 4.16 on the 9-day, 3.98 on the 14-day, 3.84 on the 20-day, 3.51 on the 50-day and 2.99 on the 100-day. Average daily range is 4.54 on the 9-day, 4.06 on the 14-day, 3.85 on the 20-day, 3.48 on the 50-day and 3.38 on the 100-day. Against the 102.43 settlement, the 14-day true range is 3.89 percent and the 14-day daily range is 3.96 percent, so crude is running near the top of a 2 to 4 percent recent range envelope and the shorter windows are wider still.
Applied to the 102.43 settle, one 14-day true range projects 98.45 to 106.41. In dollar terms a single average session represents roughly 3.98 per barrel, or 3,980 dollars per 1,000-barrel contract, while Wednesday's reconstructed 4.88 range represents roughly 4,880 dollars per contract. Those figures describe the contract's risk scale; the setup's stop remains anchored to the identified structure rather than to a generic cross-asset template.
4.1 OPEC and Supply Policy (Quotas, Compliance, Saudi/Russia Signals)
The supply story on Wednesday was infrastructure rather than policy. The pipeline capacity struck on September 10 had been carrying a three to five week repair estimate, and press reports at 11:47 AM ET carried Saudi officials seeking to resume half of that capacity within days. That is a material compression of the outage assumption the market had been trading, and it arrived while crude was already offered.
Longer-dated supply news cut the same way. Press reports at 4:56 and 4:57 PM ET carried a major producer close to a preliminary agreement to re-enter Venezuela, on fields cited at 50 billion barrels. That is a multi-year supply consideration with no near-term barrel impact, but it adds to a bearish supply narrative at the margin and it landed after the settle, so its effect belongs to Thursday rather than Wednesday.
4.2 EIA and API Inventory (Crude Stocks, Gasoline, Distillates, Cushing, SPR)
Weekly inventories at 10:30 AM ET showed a crude draw of 0.640 million barrels against a forecast draw of 1.5 million, with the prior week at a draw of 0.391 million. A draw is a withdrawal and is directionally supportive in isolation, but against consensus this was a miss of roughly 0.86 million barrels in the bearish direction, and the market traded it as such. The next weekly crude inventory print falls in the following week, so Thursday has no scheduled inventory catalyst.
4.3 Geopolitical Backdrop (Middle East, Iran, Russia/Ukraine, Venezuela)
The geopolitical stack remains the reason this contract trades above 100 at all, and it has not gone away, it has merely stopped intensifying. Strait-of-Hormuz risk has extended to Saudi export routing. Freight economics have moved to a genuine extreme, with tanker day rates reported above one million dollars for the first time on record, which is a physical-market stress signal independent of the futures price. In the Red Sea, a 6:59 AM ET report on September 16 said US officials had met Houthi representatives in Oman after an Iran-backed group seized a strategic stretch of coast, a de-escalation attempt whose outcome is unknown. Commentary carried on the energy wires through the afternoon argued for a structurally higher support base for crude on the basis that the Hormuz problem has now spread to Saudi export routes.
The asymmetry this creates for Thursday is the single most important risk in the outlook. A market holding a large risk premium that is fading gives back price steadily; the same market gaps violently on any re-escalation headline.
4.4 Demand and Refining (Refinery Utilization, Crack Spreads, Seasonal Pattern)
What is available is the downstream price signal: reporting on Wednesday described crude above 100 pushing US fuel prices to new records, which is the demand-destruction channel beginning to operate.
On the macro demand side, the US consumer print on Wednesday was unambiguously strong. Retail sales rose 1.2 percent against a 0.8 percent forecast. A strong consumer is supportive of refined-product demand, and it is also precisely what allowed the central bank to raise rates, which cuts the other way for crude through the dollar.
4.5 Dollar and Cross-Asset (DXY, Commodities Complex, Equity Risk-On/Off)
The cross-asset picture turned against crude on Wednesday. The central bank raised its policy rate by 25 basis points to 4.00 percent at 2:00 PM ET, its first increase in three years, and the accompanying projections came in above forecast at every horizon: the current-year median at 4.125 percent, next year at 4.125 against a 3.875 forecast, two years at 3.875 against 3.625, three years at 3.625 against 3.375, and the long-run rate at 3.25 against 3.125. Twelve of eighteen officials see one further increase this year, four see two, and two see none. Wednesday's vote was unanimous.
The dollar climbed on that combination while the ten-year hovered around 5 percent. A firmer dollar is a direct headwind for a dollar-denominated commodity, and higher real yields raise the carrying cost of inventory. Equities also fell on the same catalyst, so the risk-appetite channel was negative for crude. Gold moved lower on the dollar move, confirming the cross-asset direction rather than contradicting it.
Against the October WTI settle of 102.43 that puts the inter-grade spread at 3.40 on our arithmetic, and the international grade fell less than the domestic one on the day, which is consistent with the supply-relief headline being routed through Atlantic-basin physical rather than through US demand.
4.6 Institutional Positioning (COT, Money Manager vs Commercial Hedger, Speculator Length)
Money-manager net length against commercial hedger net short, and the week-over-week change in speculative positioning, are recorded as gaps.
What can be said without that report is that open interest stands at 145,252 contracts and average volume has roughly doubled against its 100-day baseline as the advance extended, so participation has broadened materially during the move.
Options positioning context
There is no exchange-traded fund whose options surface serves as a reliable gamma-positioning read for WTI: the principal oil fund is too thin for the purpose and is structurally eroded by roll costs. This is stated affirmatively rather than left implicit, so that a reader comparing the four instruments understands the difference is by design and not an omission.
Positioning signal for crude comes from the commitment-of-traders report, weekly inventory data, the producer-group signal set and the front-month against second-month spread.
One third-party options observation was available and is reported as flow colour only, not as a crude positioning surface: commentary covering Wednesday described bearish flow in the principal oil fund, with November 165 calls sold to open and January 2028 200 puts bought to open, while the fund itself fell 4 percent on the day. That is a directional expression by someone else in a vehicle we do not use as a proxy. It corroborates the day's direction and nothing more.
Night Session (6:00 PM ET Wednesday to 3:00 AM ET Thursday, Globex/Asia)
Bias is lower with a wide tolerance. The next scheduled print is the 5:00 AM ET eurozone inflation final, outside this window. That absence is the risk rather than the comfort, because an unanchored overnight session in a market carrying a geopolitical premium is exactly where headline gaps occur. Expected range 100.75 to 102.40, with the skew lower and a violent upside tail on any re-escalation headline out of the Gulf or the Red Sea.
London Session (3:00 AM to 8:00 AM ET Thursday)
Bias is lower into the European morning, contingent on the dollar. Three scheduled items matter, all of them routed through currency rather than through barrels: the eurozone inflation final at 5:00 AM ET, an ECB official speaking at 6:00 AM ET, and the Bank of England decision at 7:00 AM ET. A hawkish surprise from either central bank strengthens their currency against the dollar, which is mildly supportive for crude; a dovish surprise does the reverse. Expected range 100.24 to 102.94, with the 100.24 to 100.26 confluence the level that decides whether the European session becomes a trend leg.
Morning Session (9:00 AM to 12:00 PM ET Thursday, US Open / Pit Session)
Bias is two-sided with the decision made before the pit opens. The US data block at 8:30 AM ET carries initial jobless claims, continuing claims, building permits and housing starts. Pending home sales follow at 10:00 AM ET. For crude these matter through the dollar and through the growth read rather than directly. The cash open at 9:30 AM ET and the pit open at 9:00 AM ET set the session's first directional test against the 102.39 to 103.08 overhead shelf. Expected range 100.24 to 103.32.
Afternoon Session (12:00 PM to 2:30 PM ET Thursday, NYMEX Pit Close)
Bias is lower with the auction as the pivot point of the afternoon. The ten-year inflation-protected auction at 1:00 PM ET matters more than a routine auction would, because the ten-year nominal yield is hovering around 5 percent and a poor reception would push real yields higher still, strengthening the dollar and pressuring crude. There is no inventory print on a Thursday and no producer-group event scheduled, so the pit close into 2:30 PM ET should be positioning-driven rather than news-driven. Expected range 100.24 to 103.08, with the 102.94 pivot the level that separates a failed retest from a genuine reclaim.
Night Session Forward (6:00 PM ET Thursday)
Residual bias is lower with a substantial event risk that belongs to Asia rather than to crude. New Zealand trade data lands at 6:45 PM ET, Japanese inflation at 7:30 PM ET with the headline forecast at 2.0 percent and core at 1.8 percent, and the Bank of Japan decision at 11:30 PM ET with the policy rate forecast at 1.25 percent against a current 1.00 percent. A Japanese increase would move the yen and, through carry, US duration, which reaches crude through the dollar. Overnight geopolitical headline risk from the Gulf and the Red Sea remains the dominant unscheduled exposure and does not diminish. Expected range 99.36 to 102.94.
Expected Range (Thursday Full Session)
Low-range scenario: 100.24 to 102.94
Mid-range scenario (most likely): 99.36 to 103.32
High-range scenario: 98.06 to 105.12
The mid-range scenario spans 3.96, which is 0.99 times the 14-day average true range of 3.98 and 0.98 times the 14-day average daily range of 4.06. The low-range scenario spans 2.70, or 0.68 of one average range, and describes a session that holds inside the pivot grid without a catalyst. The high-range scenario spans 7.06, or 1.77 average ranges, and describes a geopolitical or auction-driven event day. Every bound in all three scenarios is a published level rather than a derived figure.
Most Likely Path
The most probable Thursday opens soft, having already failed Wednesday's settle overnight, and works down into the 100.24 to 100.26 confluence during the European morning or the first hour of US trade. That confluence is where the session is decided, because pivot first support and the one standard deviation band sit two cents apart there and a market that respects computed support will show it at that price. A hold produces a recovery attempt back into the 102.39 to 103.08 overhead shelf, where the relative strength boundary, the pivot and the target price sit within 69 cents of each other, and that retest is where the Primary Setup below is expressed. A decisive break instead opens 99.36, then the 98.67 to 98.92 shelf, with pivot second support at 98.06 the deepest objective reachable inside one average range. The path that invalidates all of this is a reclaim of 102.94 and acceptance above 103.32, which would mean Wednesday was a single-session washout inside an intact advance and would put the 105.12 to 105.63 zone back in play.
Thursday Economic Calendar
Thursday's calendar is dense but contains nothing scheduled that is crude-specific, which is itself the defining feature of the session. The overnight Asian window into 3:00 AM ET is empty of scheduled releases. The European morning brings the eurozone inflation final at 5:00 AM ET, an ECB official speaking at 6:00 AM ET and the Bank of England decision at 7:00 AM ET. The central-bank response is a live source of currency volatility even without a forecast figure carried into this outlook.
The US morning delivers its data in one block at 8:30 AM ET: initial and continuing jobless claims, building permits, housing starts and Canadian producer prices. Pending home sales follow at 10:00 AM ET. The US afternoon carries the ten-year inflation-protected reopening at 1:00 PM ET.
The Asian evening then carries the week's largest scheduled event for the dollar complex: New Zealand trade data at 6:45 PM ET, Japanese inflation at 7:30 PM ET forecast at 2.0 percent headline and 1.8 percent core, a Reserve Bank of Australia official at 7:30 PM ET, and the Bank of Japan decision at 11:30 PM ET forecast at 1.25 percent against 1.00 percent current.
The single first-order scheduled event for crude on Thursday is the 1:00 PM ET ten-year inflation-protected auction, on the reasoning that with the ten-year nominal around 5 percent the dollar and real-yield channel is currently the most reliable transmission path into a dollar-denominated commodity, and no oil-specific release is scheduled. That conclusion carries an explicit caveat: the true first-order risk for crude on Thursday is unscheduled. Pipeline-restoration progress, Gulf export routing and Red Sea developments can each move this contract further in a headline than the entire scheduled calendar can, and none of them has a clock time. Structurally, Wednesday was both a volatility-index expiration and the policy decision, and Friday September 18 is quarterly expiration, so Thursday sits in the one clear session between two structural dates.
Primary Trade Setup
Direction: Short
Rationale: Crude settled 0.51 below its own next-session pivot, never reclaimed Tuesday's settle at any point in a 4.88 range day, and has already failed Wednesday's settle in the new Globex session, while the two bearish supply catalysts that caused it remain in force. The trade is a fade of a retest into overhead confluence, not a trend-reversal call, and it is sized for a market whose trend architecture is still intact.
Entry Zone: 102.40 to 102.95 on a retest into the 102.39 to 103.08 overhead band
Stop Loss: 103.85 (above the 103.32 fourteen-day stochastic stall and clear of the 103.08 target price, a 90 cent buffer from the top of the entry zone)
Target 1 (T1): 100.75 approximately (Wednesday's session low, rounded from the pivot reconstruction)
Target 2 (T2): 100.24 (pivot first support, with the one standard deviation support band at 100.26 two cents above it, the highest-value confluence on the board)
Target 3 (T3, extended): 98.67 (three standard deviations support, with the 14-3 day raw stochastic 70 percent level at 98.92 just above and pivot second support at 98.06 below; only if momentum extends through T2 on expanding volume)
Risk-to-Reward: Approximately 1:1.6 to T1, 1:2.1 to T2, 1:3.4 to T3
Invalidation: A decisive reclaim of the 102.94 pivot followed by acceptance above the 103.32 stochastic stall negates the short thesis. That sequence would mark Wednesday as a single-session washout inside an intact advance and would put 104.60, then the 105.12 to 105.63 zone, back in play.
Macro override: Any re-escalation headline from the Gulf or the Red Sea, or a reversal of the pipeline-restoration reporting back toward the original three to five week outage estimate, invalidates this setup in real time regardless of price location. In the other direction, a materially stronger dollar on a poor 1:00 PM ET auction reception would accelerate the short rather than invalidate it.
Sources and methodology
This outlook is built from our session review of the October NYMEX WTI crude contract, prepared after Wednesday's close on September 16, 2026. The session high and low are recovered from the published pivot ladder, rounded to the 0.01 tick and labelled approximate; they are not observed bar prints. Evening prices come from a single chart read that ended at 9:31 PM ET. Moving-average distances are our own arithmetic against the settlement, and period changes are the published figures. No options-positioning dataset is used for crude, so no dealer-positioning claim appears in this outlook.
Scenario ranges are analyst judgment; they are not statistically derived and carry no calibration. Contract months are kept separate throughout, and approximate references are labelled wherever they appear.
Wednesday’s outlook for this contract is here. Outlooks for ES, NQ, GC and CL are collected on the market outlook page, and our forward trading record is on the performance statement.



