
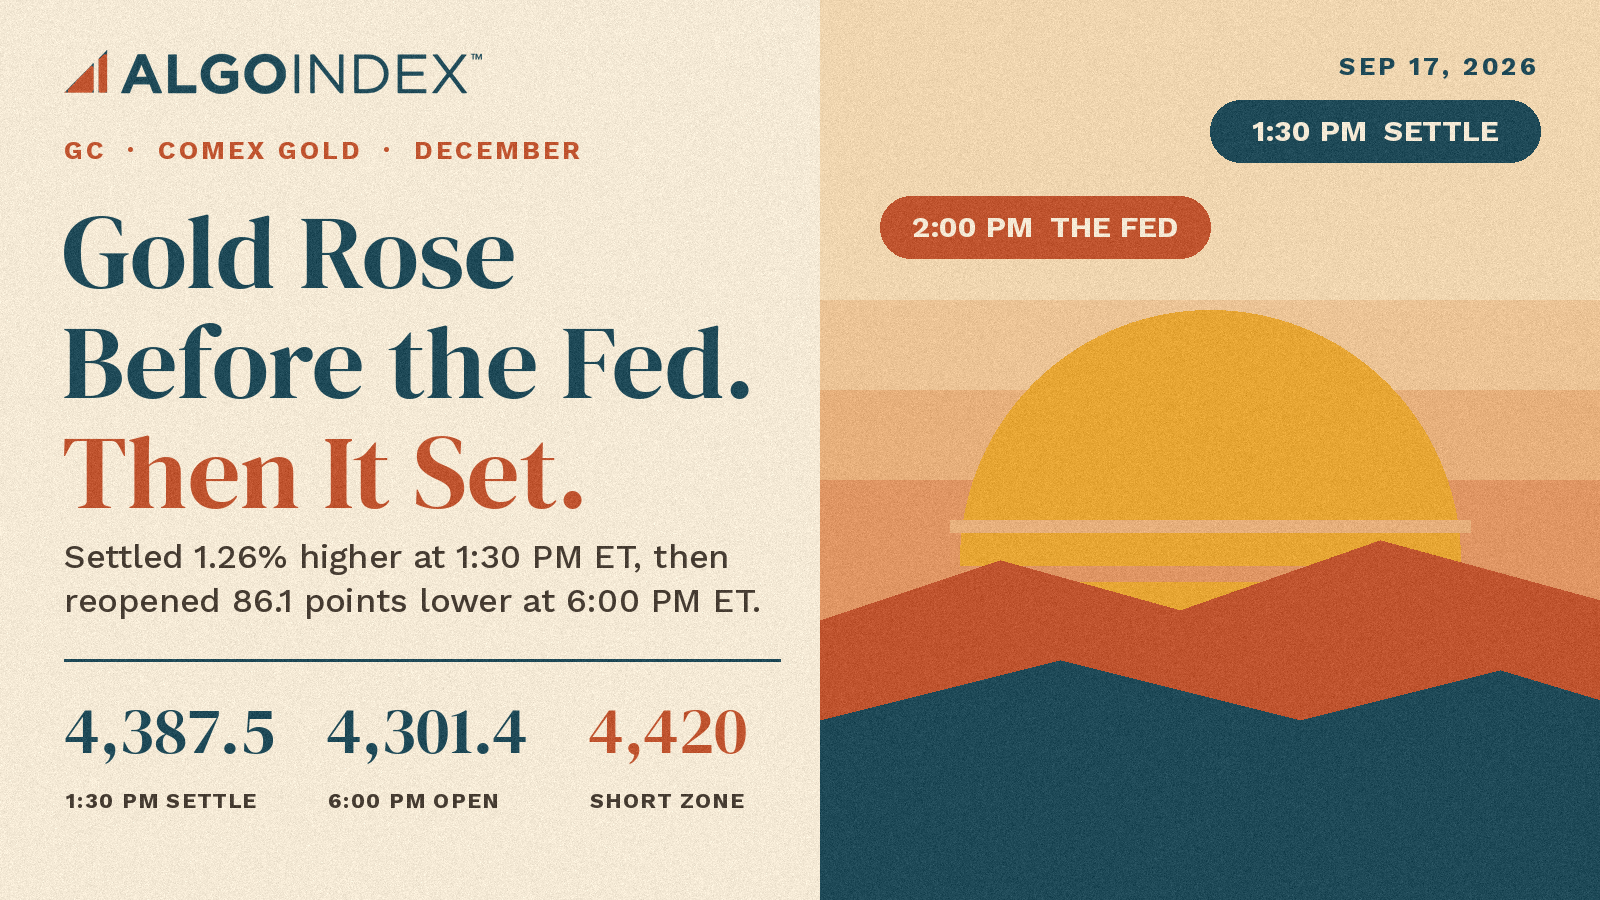
Gold's official price for Wednesday was fixed at 1:30 PM ET. December futures settled at 4,387.5, up 1.26 percent. Thirty minutes later the Federal Reserve raised its policy rate 25 basis points to 4.00 percent and published a rate path above forecast at every horizon. The dollar strengthened. When the next session opened at 6:00 PM ET, the contract traded at 4,301.4, 86.1 points beneath the settlement that feeds Thursday's pivot math.
That gain is a pre-decision number. The pivot reconstruction puts Wednesday's range at about 4,273.4 to about 4,413.2, rounded to the contract's 0.10 tick, and the settlement sat 81.7 percent of the way up it, which would normally read as a strong close. The selling after 1:30 PM ET happened in post-settlement trade. Evening buyers then lifted the contract from a 4,294.5 low to 4,350.9, a 56.4-point first range that recovered the 4,336.8 50-day average and stalled beneath the 4,358.0 pivot.
December gold settled at 4,387.5 before the rate decision, reopened at 4,301.4 and recovered to 4,350.9 in evening trade. Resistance starts at the 4,358.0 pivot and builds through 4,387.5, the 4,395 to 4,420 equilibrium, the 4,413.5 100-day average and the 4,442.6 first pivot resistance. Support sits at the 4,336.8 50-day average, the 4,328 to 4,338 chart band and the 4,302.8 first pivot support. The primary setup is a short from 4,420 to 4,442, stop 4,460, targets 4,358, 4,303 and 4,264.
Wednesday's short, unscored
Our Wednesday outlook sold 4,360 to 4,373 with a 4,392 stop and targets at 4,331, 4,304 and 4,293. The reconstructed range reached the stop and all three targets. A daily bar does not show the order. We leave the trade unscored.
The reconstructed range measured about 139.8 points, 1.28 times the 109.3-point average true range and 1.26 times the 111.1-point average daily range. The settlement sat about 114.2 points above the reconstructed low. Those figures describe the market at 1:30 PM ET, and the evening session opened into a different one.
A pivot built on a pre-decision close
Pivot math starts from the settlement. Every computed level for Thursday rests on a close that predates the decision, which places the 4,358.0 pivot higher than a post-decision close would have. The evening chart is the check. The 4-hour chart shows lower highs from the 4,540 region through 4,480 and 4,410, and the policy reaction pushed the contract back beneath the latest shelf. On the 15-minute chart a sharp liquidation from near 4,400 ran into 4,305 before a steady recovery.
Resistance stacks up fast. The pivot sits just above the 4,350.9 evening high. The 4,387.5 settlement is the next reaction level, followed by the 4,395 to 4,420 equilibrium band, the 100-day average at 4,413.5 and the approximate 4,413.2 session high, 0.3 point apart. The first pivot resistance at 4,442.6 caps the entry zone and 4,460 marks the invalidation. Above that, the second pivot resistance at 4,497.8 sits 2.2 points above the 20-day average at 4,495.6, almost exactly one average true range above the settlement. The third is 4,582.4.
Support starts at the 50-day average inside the 4,328 to 4,338 chart band. The first pivot support at 4,302.8 and the 4,301.4 evening open sit 1.4 points apart, the most important downside decision area on the map. Below them come the 4,294.5 evening low, the 4,278.2 lower edge of a one-ATR envelope, a 4-hour extension at 4,264, then 4,218.2 and 4,163.0.
Against the settlement, the moving averages split. Price sat 26.4 points above the 5-day average at 4,361.1 and 50.7 points above the 50-day, but 26.0 points below the 100-day, 108.1 points below the 20-day and 260.7 points below the 200-day average at 4,648.2. The evening open slipped beneath the two shorter averages and recovered only the 50-day.
Rates beat the haven bid
Gold pays no coupon. When real yields climb, holding it costs more, and a stronger dollar raises the price for buyers outside the United States. Wednesday delivered both. The 10-year yield held near 5 percent, and most officials now see at least one more increase this year. Existing geopolitical and energy-supply risk stayed supportive at the margin without stopping the drop after the decision. The rate and currency channel won that round.
Crude settled at 102.43, down 3.21 percent, easing one inflation input, while the policy path stayed restrictive and broad equities weakened. The gold fund proxy was quoted at 390.80 against a previous close of 394.14, a decline of about 0.85 percent, with a negative options-impact reading of 386 million. That confirms a weak tone after the decision. It stays qualitative, since tracking basis, fees and contract timing prevent a clean conversion into futures prices. No fresh central-bank purchase or China demand figure arrived.
The trade map for Thursday
The primary setup is a short from 4,420 to 4,442 on a failed attempt to hold above the 4-hour equilibrium and the 100-day average. The stop sits at 4,460, above the first pivot resistance and the latest lower-high region. The first target is the 4,358 pivot, the second the 4,303 first pivot support area and the third the 4,264 extension.
From the 4,431 midpoint the risk is 29 points. The first target offers 73 points, about 2.5 times the risk. The second offers 128 points, about 4.4 times, and the third 167 points, about 5.8 times. From the less favorable 4,420 edge, the first target pays 62 points against 40 points of risk. Trade above 4,443 weakens the setup. Four-hour acceptance above 4,460 invalidates it and shifts focus to 4,497.8. A sharp decline in the dollar and real yields through the stop cancels it, and a strong inflation-protected auction that pulls real yields lower is the clearest scheduled route there. The alternate is a long only after four-hour acceptance above 4,460 and a retest of 4,443 to 4,460 that holds, aiming at the 20-day average and 4,497.8.
The oscillators counsel patience. The 14-day stochastic reads 16.10, stretched enough to support a rebound, and the 14-day relative strength index is 42.46. The directional index is 17.82, with negative direction at 17.79 barely ahead of positive at 15.91. The multi-indicator composite is a 40 percent sell with weak directional strength. Historic volatility is 21.86, well above the equity index readings. Selling into resistance fits that profile; selling near 4,303 does not.
Timing matters more for gold than for the index contracts. The 1:00 PM ET inflation-protected securities auction lands thirty minutes before the 1:30 PM ET settlement, so a weak auction can shape Thursday's settlement directly. That timing is unusual. Earlier, eurozone inflation at 5:00 AM ET and the Bank of England at 7:00 AM ET, with the rate expected at 3.75 percent, set the first dollar test. At 8:30 AM ET initial jobless claims are expected at 206.5 thousand against 206 thousand, continued claims at 1.7795 million, building permits at 1.41 million and housing starts at 1.319 million against 1.239 million. Pending home sales follow at 10:00 AM ET, forecast at negative 0.1 percent.
Scenario ranges are analyst judgment. The low-range case runs 4,303 to 4,388, an 85-point band of about 0.78 of an average true range. The most likely case runs 4,303 to 4,420, 117 points or about 1.07 of that range, and the tail case spans 4,218.2 to 4,497.8. Session bands run 4,294 to 4,388 overnight and 4,305 to 4,420 through London. The most likely path lifts toward 4,387.5 early, meets resistance inside 4,395 to 4,420 and returns toward 4,302.8. A push through 4,420 toward 4,442.6 is the less likely extension that reaches the setup zone. A loss of 4,294.5 turns the path toward 4,278 and 4,264.
Thursday's settlement lands after its biggest scheduled catalyst, the 1:00 PM ET auction, so this time the print will carry the reaction.
The complete data picture
Every number behind Thursday’s plan, charted first, then the full level map, then the complete numeric reference underneath.
Full numeric reference, every remaining figure from the session review
Level notes
4,582.4, the third pivot resistance. The outer computed extension, relevant only if the policy reaction fully reverses.
4,497.8, the second pivot resistance and 20-day average area. The pivot lies only 2.2 points above the 20-day average at 4,495.6 and almost exactly one 14-day ATR above settlement.
4,460, four-hour invalidation. Not a published pivot; this is the chart level above which the lower-high thesis is considered broken.
4,442.6, the first pivot resistance. The primary recovery ceiling and the upper edge of the entry band.
4,420, upper edge of the 4-hour equilibrium area. The lower edge of the preferred short-entry zone.
4,413.5 and about 4,413.2, 100-day average and approximate completed-session high. Two different methods converge within 0.3 point, but the high remains an algebraic reconstruction rather than an observed print.
4,395, lower edge of the 4-hour equilibrium area. The first chart shelf above the pre-decision settlement.
4,387.5, completed-session settlement. A reaction level with an important caveat: it predates the policy decision.
4,358.0, the pivot. The first formal test above the developing-session high, also derived from the pre-decision settlement input.
Once cleared, it turns into the first support on a continued rebound.
4,336.8, 50-day average. The immediate balance marker, sitting inside the chart support band.
4,328 to 4,338, short-term chart support. The area that held during the recovery and contains the 50-day average.
4,302.8 and 4,301.4, the first pivot support and developing-session open. Two references within 1.4 points form the highest-value downside decision area.
4,294.5, developing-session low. Loss of this level would end the recovery sequence and reopen the lower extension.
4,278.2, lower one-ATR boundary. A volatility reference rather than a structural level.
4,264, 4-hour chart extension. The third target of the primary setup and the next visible shelf below the developing low.
4,218.2, the second pivot support.
4,163.0, the third pivot support. The outer computed extension, reserved for a renewed dollar or real-yield shock.
2.1 Intraday and Session Review
Wednesday's unrounded solved extremes reproduce the full pivot ladder. Rounded to the contract's 0.10 tick, the completed-session references are approximately 4,413.2 high and 4,273.4 low. They are algebraic inputs recovered from the seven-level ladder, not independently observed prints, so the outlook labels them as approximate everywhere they appear.
The reconstructed 139.8-point range is larger than both the 109.3-point 14-day average true range and the 111.1-point 14-day average daily range. The 4,387.5 settlement occurred before the policy decision and sat about 114.2 points above the reconstructed low, or 81.7 percent of the way up the range. That upper-range finish describes the market at 1:30 PM ET, not the later policy reaction.
The developing session began at 4,301.4, reached 4,294.5 and rebounded to 4,350.9, a 56.4-point first range. The 15-minute chart shows a sharp liquidation from near 4,400 into 4,305 followed by a steady recovery. The 1-minute chart held a rising sequence into 4,348 before forming a tight balance.
2.2 Daily Structure
Against the 4,387.5 settlement, price is 26.4 points above the 5-day average at 4,361.1 and 50.7 points above the 50-day average at 4,336.8, but 26.0 points below the 100-day average at 4,413.5, 108.1 points below the 20-day average at 4,495.6 and 260.7 points below the 200-day average at 4,648.2.
That mixed stack describes a broad correction rather than a clean one-direction trend. The pre-decision settlement held the short averages, but the developing session opened beneath both of them and only recovered the 50-day average. The 100-day average almost coincides with the approximate reconstructed high, making the 4,413 to 4,420 area the first structural test of any continued recovery.
2.3 4-Hour and Swing Structure
The 4-hour chart shows lower highs from the 4,540 region through 4,480 and 4,410. Each recovery has failed at a lower level, and the policy reaction pushed the developing session back beneath the latest swing shelf. A visible equilibrium area spans 4,395 to 4,420, while support is grouped around 4,305 to 4,330 with a deeper extension near 4,264.
The latest rebound repairs short-term momentum but does not break the lower-high sequence while price remains below 4,443. Trade above the first pivot resistance would weaken the thesis, but four-hour acceptance above 4,460 is required to clear the latest swing structure rather than merely overshoot a computed level.
2.4 Moving Averages
The moving-average stack against the 4,387.5 settlement is:
5-day average 4,361.1: settlement 26.4 points above, but the developing session opened beneath it
50-day average 4,336.8: settlement 50.7 points above; recovered during the evening bounce and now the immediate balance marker
100-day average 4,413.5: settlement 26.0 points below; aligned with the approximate reconstructed high and the lower edge of the preferred entry zone
20-day average 4,495.6: settlement 108.1 points below; aligned closely with the second pivot resistance at 4,497.8
200-day average 4,648.2: settlement 260.7 points below; evidence that the longer corrective phase remains unresolved
The stack is not bullish simply because the settlement held the 5-day and 50-day averages. The developing session's opening repricing moved beneath both, and the recovery still faces the 100-day average. The most useful confluence is 4,413.5 to 4,442.6, where the 100-day average, chart equilibrium and the first pivot resistance at 4,442.6 overlap.
2.5 Oscillator and Trend Readings
The 14-day relative strength index is 42.46, below neutral but not at an oversold extreme. The 14-day stochastic reading is 16.10, which is stretched enough to support the developing-session rebound. The two together warn against chasing a short near the 4,303 support area even though the larger structure is corrective.
The 14-day directional index is 17.82, with positive directional movement at 15.91 and negative directional movement at 17.79. Negative direction leads, but only narrowly, and the directional-index reading remains below the level normally associated with a strong trend. Historic volatility is 21.86, materially higher than the equity-index readings and consistent with the wide stop and reduced size required for gold.
The multi-indicator composite is a 40 percent sell with weak directional strength. That aligns with a range-bound market carrying a bearish higher-timeframe tilt. It supports selling a failed rally into the resistance band, not initiating a new short at the lower edge of the developing range.
2.6 Volatility and Expected Range
The 14-day average true range is 109.3 points and the 14-day average daily range is 111.1 points. A one-ATR envelope around the 4,387.5 settlement spans 4,278.2 to 4,496.8, placing the second pivot resistance at 4,497.8 almost exactly on the upper boundary. the first pivot support at 4,302.8 remains inside the lower boundary, while the developing-session low at 4,294.5 sits only 16.3 points above it.
The reconstructed completed-session range used about 1.28 ATR. The developing session then opened 86.1 points below settlement and printed a 56.4-point first range, showing that the policy event redistributed volatility across the settlement boundary. The wide envelope argues for patient entries, smaller size and no assumption that a pivot printed from a pre-decision close represents post-decision fair value.
4.1 Dollar and Real Yields
The dollar strengthened after the policy decision and the 10-year yield held near 5 percent. Gold produces no coupon, so a higher real yield raises the opportunity cost of holding it, while a stronger dollar mechanically raises the price for non-dollar buyers. Continued strength in either input raises resistance against gold rallies; strength in both explains why the post-settlement market opened so far below the pre-decision reference.
4.2 Fed and Monetary Policy
The policy rate increased 25 basis points to 4.00 percent in the first increase in three years, and the vote was unanimous. The updated projection path moved above expectations across its horizons, with most officials indicating at least one more increase this year. The next gold test is whether Thursday's labor and housing data reinforce that path or soften it, followed by the 1:00 PM ET inflation-protected securities auction as the direct real-yield check.
4.3 Geopolitical Backdrop
Existing geopolitical and energy-supply risk remains supportive at the margin, but it did not prevent the developing-session gap lower. That non-response is useful: in this session, the rate and currency channel overpowered the haven channel.
4.5 Energy and Cross-Asset
Crude settled at 102.43 after a 3.21 percent decline, broad equities weakened and the dollar firmed. That mix is not uniformly defensive: lower crude removes some inflation pressure, while the stronger dollar and near-5-percent 10-year yield weigh directly on gold. The metal therefore trades the interaction between lower energy inflation and a still-restrictive policy path rather than a simple risk-off signal.
4.6 Institutional Positioning (COT, ETF Holdings, Speculator Length)
The fund proxy was quoted at 390.80 after a previous close of 394.14, a decline of about 0.85 percent, and the options-impact reading was negative 386 million. Those values confirm weak post-decision tone in the proxy, but they remain qualitative context only and are not translated into futures prices.
Options positioning context
The fund proxy shows a negative options-impact reading and weak price quality relative to its previous close. It is supplementary evidence because tracking basis, fees, bullion holdings and contract timing prevent direct conversion into GC levels. The futures chart, dollar and rates remain the primary inputs.
No fund price is mapped into a futures price and no proxy-derived level appears in the entry, stop or targets. This is the same evidence discipline used for the reconstructed futures extremes: uncertain fields are labelled or omitted, not silently promoted.
Night Session (6:00 PM ET September 16 to 3:00 AM ET September 17, Globex/Asia)
Bias is a corrective rebound beneath resistance. Holding 4,303 supports a recovery toward 4,358 and the pre-decision 4,387.5 settlement; losing 4,294.5 exposes 4,278 and 4,264. Expected working band is 4,294 to 4,388.
London Session (3:00 AM to 8:00 AM ET September 17)
Eurozone CPI at 5:00 AM ET and the Bank of England decision at 7:00 AM ET create the first dollar and rate tests. A firm inflation or hawkish-rate response would reinforce resistance at 4,388 to 4,420. A softer response can carry the recovery through the pre-decision settlement, but 4,413 to 4,443 remains the higher-quality resistance band. Expected working band is 4,305 to 4,420.
Morning Session (9:30 AM to 12:00 PM ET September 17, US Open)
US claims and housing data arrive at 8:30 AM ET. The rates reaction matters more than the headline direction: data that lift the long end are negative for gold even if they are growth-positive. The 9:30 AM ET cash-session handoff should determine whether the rebound can hold above the pivot at 4,358 and challenge the pre-decision settlement.
Afternoon Session (12:00 PM to 1:30 PM ET September 17, Settlement)
The 10-year inflation-protected securities auction is scheduled at 1:00 PM ET, thirty minutes before the 1:30 PM ET gold settlement. A weak auction and higher real-yield response would favor renewed selling into settlement; a strong auction can support a squeeze through the 4,395 to 4,420 band. Any movement after 1:30 PM ET belongs to post-settlement trade and must not be described as part of Thursday's settlement outcome.
Night Session Forward (6:00 PM ET September 17)
At the 6:00 PM ET reopen, sustained trade above 4,443 would weaken the short thesis and shift focus toward the 20-day average and the second pivot resistance near 4,498. Four-hour acceptance above 4,460 is the actual invalidation because it clears the latest lower-high region. Continued rejection below 4,388 keeps 4,303 and 4,264 active.
Expected Range (September 17 Full Session)
Low-range scenario: 4,303 to 4,388, an 85-point band equal to about 0.78 times the 14-day average true range
Mid-range scenario (most likely): 4,303 to 4,420, a 117-point band equal to about 1.07 times the 14-day average true range
High-range scenario: the second pivot support at 4,218.2 to the second pivot resistance at 4,497.8, a 280-point tail band reserved for a large dollar or real-yield move
The scenario widths are analyst judgment, not calibrated probabilities. The mid-range case deliberately brackets the developing-session open, the pivot, the pre-decision settlement and the 4-hour equilibrium band without assuming another event-sized gap.
Most Likely Path
Analyst judgment favors an early recovery toward the pre-decision settlement at 4,387.5, followed by resistance inside 4,395 to 4,420 and a return toward the first pivot support at 4,302.8. That path stays inside the most-likely 4,303 to 4,420 range. A push through 4,420 toward the first pivot resistance at 4,442.6 is the less-likely extension that reaches the setup zone, not part of the base path.
If 4,303 holds on a retest, Thursday can remain a broad recovery session inside the post-decision range. A loss of 4,294.5 changes the path to 4,278 and 4,264. Acceptance above 4,443 weakens the short, while four-hour acceptance above 4,460 shifts the path toward the second pivot resistance and the 20-day average near 4,498.
Thursday Economic Calendar
Eurozone CPI is scheduled at 5:00 AM ET and supplies the first inflation impulse for the dollar and global yields. The Bank of England decision follows at 7:00 AM ET, with the rate expected to remain at 3.75 percent and the vote split carrying more information than the unchanged headline.
The US block arrives at 8:30 AM ET: initial jobless claims are expected at 206.5 thousand against 206 thousand prior, continued claims at 1.7795 million, building permits at 1.41 million and housing starts at 1.319 million against 1.239 million prior. Pending home sales follow at 10:00 AM ET with a negative 0.1 percent forecast.
The 10-year inflation-protected securities auction is scheduled at 1:00 PM ET, only thirty minutes before the gold settlement. The 8:30 AM ET data group is the first-order scheduled event because it can reset the post-decision rate path; the auction is the confirmation through real yields and can directly shape the settlement.
Primary Trade Setup
Direction: Short
Rationale: The 4-hour lower-high sequence remains intact below the first pivot resistance at 4,442.6. The entry band contains the 4-hour equilibrium, the 100-day average and the upper edge of the approximate reconstructed high area, while the dollar and long-end yields remain firm. The stretched stochastic reading argues for waiting for resistance rather than selling near support.
Entry Zone: 4,420 to 4,442, on a failed attempt to hold above the 4-hour equilibrium and the 100-day average
Stop Loss: 4,460 (above the entry band, the first pivot resistance at 4,442.6 and the latest 4-hour lower-high region)
Target 1 (T1): 4,358 (the pivot)
Target 2 (T2): 4,303 (the first pivot support area)
Target 3 (T3, extended): 4,264 (4-hour extension)
Risk-to-Reward: From the 4,431 midpoint, risk to 4,460 is 29 points. T1 offers 73 points, approximately 1:2.5; T2 offers 128 points, approximately 1:4.4; T3 offers 167 points, approximately 1:5.8. From the less favorable 4,420 edge, T1 still offers 62 points against 40 points of risk.
Invalidation: Trade above 4,443 weakens the setup, but four-hour acceptance above 4,460 invalidates the lower-high thesis and shifts focus toward 4,497.8.
Macro override: A sharp dollar and real-yield decline that carries price through 4,460 cancels the short. A strong inflation-protected securities auction that forces the real-yield curve lower is the clearest scheduled route to that outcome.
Alternate setup: Long only after four-hour acceptance above 4,460 and a successful retest of 4,443 to 4,460 as support. The first objective is the 20-day average and the second pivot resistance near 4,498. This is the lower-conviction expression because it begins against the broader lower-high sequence.
Sources and methodology
This outlook is built from our session review of the December COMEX gold contract, prepared after Wednesday's close on September 16, 2026. Gold settles at 1:30 PM ET, before the 2:00 PM ET rate decision, so the settlement and the pivot levels computed from it are pre-decision inputs. The session high and low are recovered from the published pivot ladder, rounded to the 0.10 tick and labelled approximate; they are not observed bar prints. The gold fund proxy is used as qualitative context only and is never converted into futures prices.
Scenario ranges are analyst judgment; they are not statistically derived and carry no calibration. Contract months are kept separate throughout, and approximate references are labelled wherever they appear.
Wednesday’s outlook for this contract is here. Outlooks for ES, NQ, GC and CL are collected on the market outlook page, and our forward trading record is on the performance statement.



