
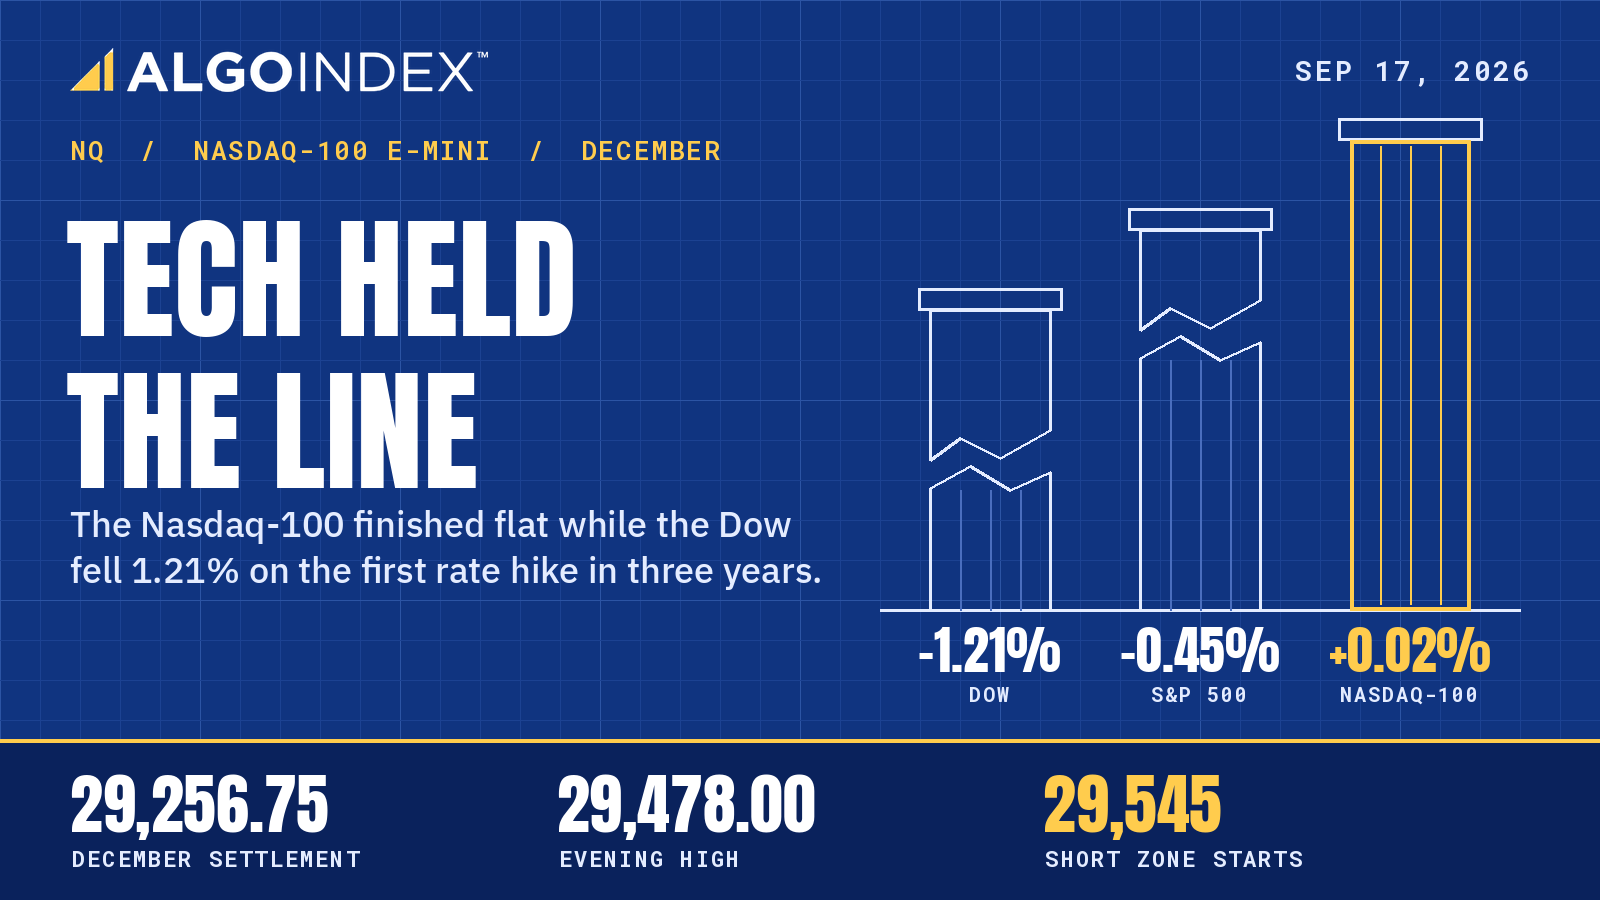
Three stock indexes took the same rate decision on Wednesday and finished in three different places. The Dow fell 1.21 percent. The S&P 500 lost 0.45 percent. The Nasdaq-100 closed at 28,945.06, up 0.02 percent, after the Federal Reserve raised its policy rate 25 basis points to 4.00 percent, its first increase in three years.
December Nasdaq-100 futures settled at 29,256.75, up 0.03 percent, inside a 496.75-point range from 29,549.75 down to 29,053.00. That range ran 1.16 times the 426.90-point average true range. The settlement landed 41.0 percent of the way up it. After the reopen the contract opened at 29,271.00, 15.50 points under the 29,286.50 pivot, dipped to 29,247.75 and then rallied 230.25 points to 29,478.00. It reclaimed the pivot and the 29,419.05 5-day average, and it traded 29,448.75 later in the evening.
December Nasdaq-100 futures settled at 29,256.75 and rallied to 29,478.00 in evening trade as technology outperformed after the rate increase. Resistance sits between the 29,520.00 first pivot resistance and the 29,603.20 20-day average, with Wednesday's 29,549.75 high and the 29,570.95 50-day average inside that band. Support starts at the 29,419.05 5-day average and the 29,286.50 pivot. The primary setup is a short from 29,545 to 29,568, stop 29,785, targets 29,286.50, 29,023.25 and 28,789.75.
A range that reached both sides
Our Wednesday outlook sold 29,421 to 29,473 with a 29,545 stop and targets at 29,316, 29,207 and 29,138. Wednesday's range covered the stop by 4.75 points and all three targets. A daily bar cannot show which came first. That trade stays unscored.
The shape of the session still says something. A 496.75-point day that settles 203.75 points off the low reads as two-way trade around a policy event, and the evening recovery used about 0.54 of an average true range before it paused. On the 15-minute chart price climbed from near 29,120 into 29,480, and the 1-minute chart then held a narrow balance between 29,440 and 29,450.
Four references in 83 points
The first pivot resistance sits at 29,520.00. Wednesday's high at 29,549.75 comes next, then the 50-day average at 29,570.95, only 21.20 points higher, and the 20-day average at 29,603.20. The two averages are 32.25 points apart. That band spans 83 points and carries four separate references, which is why the new entry starts at the high and leaves the pivot below it. The 4-hour chart shows repeated defense of 29,100 to 29,250 with resistance near 29,500, 29,600 and 29,700.
Higher up, the 100-day average at 29,737.33 is the last moving-average barrier and the second pivot resistance at 29,783.25 marks the formal invalidation area. The third pivot resistance is 30,016.75. The settlement sits 162.30 points below the 5-day average, 314.20 points below the 50-day, 346.45 points below the 20-day and 480.58 points below the 100-day. The 200-day average at 27,839.79 sits 1,416.96 points beneath it, so the long-horizon advance holds.
Support starts with the 5-day average, reclaimed in the evening. The pivot at 29,286.50 is the first target. The settlement at 29,256.75 sits only 9 points above the 29,247.75 evening low, and a 4-hour extension waits at 29,096. Wednesday's low at 29,053.00 comes before the first pivot support at 29,023.25, then 28,789.75 and 28,526.50.
Rates still weigh on technology
Technology absorbed the decision better than the rest of the market. The rate path moved anyway. Projections came in above forecast at every horizon, most officials see at least one more increase this year and the 10-year yield held near 5 percent. Higher long-end yields shrink the present value of distant cash flows, and the Nasdaq-100 is the most duration-sensitive of the four contracts we cover. That keeps the case for selling strength into resistance intact.
No large-cap technology earnings report or semiconductor catalyst arrived after the close. Breadth is the signal to watch. A rebound confined to a few mega-cap names carries less weight than one confirmed across semiconductors and software. The volatility index closed at 17.71 after reaching about 19, and the dollar firmed. S&P 500 futures face the same rate test with narrower participation behind them.
The technology fund proxy sits among several nearby options concentrations: a 704 reference, a 710 modeled threshold, a central concentration and lower boundary at 700, a 713 transition marker and a 720 upper boundary. Hedging behavior can shift quickly as the fund moves through 700 to 713. Those levels live in the fund's own price domain, and none of them anchors the futures entry, stop or targets.
The trade map for Thursday
The primary setup is a short from 29,545 to 29,568 after a rejection of the band that holds Wednesday's high and the 50-day average. The stop sits at 29,785, above the 29,783.25 second pivot resistance, so a stop-out requires clearing the 100-day average and the entire immediate pivot structure. Targets are the 29,286.50 pivot, the 29,023.25 first pivot support and the 28,789.75 second pivot support.
From the 29,556.50 midpoint the risk is 228.50 points. The first target offers 270 points, about 1.2 times the risk. The second offers 533.25 points, about 2.3 times, and the third 766.75 points, about 3.4 times. From the less favorable 29,545 edge, the first target pays 258.50 points against 240 points of risk. Four-hour acceptance above 29,785 invalidates the thesis and opens 30,016.75. A sustained fall in real yields with broad technology strength through the stop cancels it too, as does soft 8:30 AM ET data confirmed by semiconductor breadth at the cash open. The alternate is a long only after acceptance above 29,785 and a retest of 29,737 to 29,783 that holds, aiming at 30,016.75.
Momentum sits below neutral. The 14-day relative strength index is 47.15 and the 14-day stochastic 23.86, low enough to explain the recovery from 29,100 to 29,250. The directional index reads 15.38, with negative direction at 23.02 against positive at 13.43. The multi-indicator composite is a 56 percent sell with minimum strength and weak direction. Historic volatility is 11.17. A one-ATR envelope around the settlement spans 28,829.85 to 29,683.65, so a move into 29,545 to 29,603 fits an ordinary session while a sustained move through 29,785 would change the structure.
The calendar opens with eurozone inflation at 5:00 AM ET and the Bank of England at 7:00 AM ET, rate expected at 3.75 percent. At 8:30 AM ET initial jobless claims are expected at 206.5 thousand against 206 thousand, continued claims at 1.7795 million, building permits at 1.41 million and housing starts at 1.319 million against 1.239 million. Pending home sales follow at 10:00 AM ET, forecast at negative 0.1 percent. The 10-year inflation-protected securities auction at 1:00 PM ET is the day's cleanest test of real-yield demand.
Scenario ranges are analyst judgment. The low-range case runs 29,247 to 29,570, about 0.85 of the 379.30-point average daily range. The most likely case runs 29,200 to 29,570, 370 points or 0.98 of that range, and the tail case spans 28,789.75 to 30,016.75. Session bands run 29,250 to 29,570 overnight and 29,300 to 29,570 through London. The most likely path tests 29,520 to 29,570 early, rejects below 29,603 and rotates toward 29,286.50. A clean loss of the pivot opens 29,247.75, 29,096 and 29,023.25; acceptance above 29,603 shifts focus to 29,737.33 and 29,783.25.
The first resistance band starts 42 points above the evening high, and Friday's quarterly expiration sits one session behind it.
The complete data picture
Every number behind Thursday’s plan, charted first, then the full level map, then the complete numeric reference underneath.
Full numeric reference, every remaining figure from the session review
Level notes
30,016.75, the third pivot resistance. The outer upside extension and a level that requires a full reversal of the policy-session structure.
29,783.25, the second pivot resistance. The formal invalidation area for the short thesis. The stop at 29,785 is placed immediately above it.
29,737.33, 100-day average. The last moving-average barrier above the compressed short-term stack and below the second pivot resistance.
29,603.20, 20-day average. The top of the immediate moving-average grouping. Acceptance above it would improve the rebound and expose the 100-day average.
29,570.95, 50-day average. Only 21.20 points above the completed-session high and inside the preferred short-entry region.
29,549.75, completed-session high. A direct price reference that sits between the first pivot resistance at 29,520.00 and the 50-day average, creating a three-method confluence.
29,520.00, the first pivot resistance. The first formal resistance and the lower boundary of the decision zone.
The immediate ceiling already tested during the evening review.
29,419.05, 5-day average. Reclaimed during the developing session; holding it keeps the rebound organized.
29,286.50, the pivot. The first formal support and the initial target of the primary short.
29,256.75, completed-session settlement. Only 9 points above the developing-session low, so the pair forms one decision shelf.
29,247.75, developing-session low. Loss of this level would erase the evening higher-low sequence.
29,096, 4-hour chart extension. The nearest chart-derived support ahead of the lower pivot ladder.
29,053.00, completed-session low. The defended policy-session extreme and the line between consolidation and renewed downside expansion.
29,023.25, the first pivot support. The second target of the primary setup and the first major computed support beneath the completed-session low.
28,789.75, the second pivot support. The extended third target and the downside boundary just beyond one 14-day ATR from settlement.
28,526.50, the third pivot support. The outer computed extension, relevant only in a renewed policy or yield shock.
2.1 Intraday and Session Review
The completed-session high at 29,549.75 and low at 29,053.00 reproduce the full pivot ladder. The 496.75-point range was about 1.16 times the 14-day average true range of 426.90 and 1.31 times the 14-day average daily range of 379.30, so the policy session delivered genuine expansion rather than an ordinary rotation.
The settlement at 29,256.75 finished 203.75 points above the low, or 41.0 percent of the way up the range. That is not a capitulation close, but it is also not the kind of upper-quartile finish that would establish control by buyers. The completed-session close sits only 29.75 points beneath Thursday's pivot, leaving the new session close enough to reclaim it without resolving the broader structure.
The developing session opened at 29,271.00, 15.50 points below the pivot at 29,286.50, printed 29,247.75 and then rebounded to 29,478.00. On the 15-minute chart, price recovered from near 29,120 into 29,480. The 1-minute chart then balanced between 29,440 and 29,450. The sequence matters: buyers reclaimed the pivot and the 5-day average, but the rebound stopped below the first pivot resistance and both medium-term averages.
2.2 Daily Structure
The settlement remains below the 5-day average at 29,419.05 by 162.30 points, below the 50-day average at 29,570.95 by 314.20 points, below the 20-day average at 29,603.20 by 346.45 points and below the 100-day average at 29,737.33 by 480.58 points. That ordering describes a corrective daily structure in which every nearby average becomes potential supply on a rebound.
The 200-day average at 27,839.79 sits 1,416.96 points beneath settlement. The long-horizon advance is therefore still intact even though the short and intermediate structure is adverse. This separation is why the preferred expression is to sell a defined resistance test rather than chase weakness near 29,250: the market is correcting inside a larger uptrend, not yet breaking its multi-month structure.
2.3 4-Hour and Swing Structure
The 4-hour chart shows repeated defense of the 29,100 to 29,250 region followed by a rebound through 29,400. That defense gives the recovery real structure, but a lower high remains the working interpretation while price stays beneath 29,603 and, more decisively, the second pivot resistance at 29,783.25.
Resistance begins near 29,500, where the rebound meets the first chart shelf, followed immediately by the completed-session high at 29,549.75 and the 50-day average at 29,570.95. The 20-day average at 29,603.20 is the next test. A break below 29,247.75 would erase the developing-session higher low and return focus to 29,096, the first pivot support at 29,023.25 and the completed-session low at 29,053.00.
2.4 Moving Averages
The moving-average stack against the 29,256.75 settlement is:
5-day average 29,419.05: price 162.30 points below; reclaimed during the developing Globex rebound and therefore the first test of whether the repair can hold
50-day average 29,570.95: price 314.20 points below; the middle of the preferred short-entry confluence
20-day average 29,603.20: price 346.45 points below; the level whose reclaim would materially improve the daily structure
100-day average 29,737.33: price 480.58 points below; the final average before the second pivot resistance at 29,783.25 and the larger recovery barrier
200-day average 27,839.79: price 1,416.96 points above; the long-horizon trend reference
The useful feature is compression overhead. The 50-day and 20-day averages are only 32.25 points apart, and the first pivot resistance at 29,520.00 plus the completed-session high at 29,549.75 sit directly below them. A rebound does not encounter one isolated ceiling; it encounters a layered band from 29,520 to 29,603.
2.5 Oscillator and Trend Readings
The 14-day relative strength index is 47.15, below neutral but nowhere near an oversold extreme. The 14-day stochastic reading is 23.86, much closer to the lower end of its range and consistent with the sharp recovery from the 29,100 to 29,250 area. Together they describe a market with room to rebound but without confirmed positive momentum.
The 14-day directional index is 15.38, with positive directional movement at 13.43 and negative directional movement at 23.02. Negative direction is clearly dominant, but the low directional-index reading says that dominance has not produced a strong trend. Historic volatility is 11.17, reinforcing the distinction between a weak directional bias and a mature momentum trend.
The multi-indicator composite is a 56 percent sell with minimum strength and weak direction. That combination favors responsive trade at defined levels rather than momentum pursuit. It supports the short setup only after a resistance rejection; it does not support selling below support merely because the composite is negative.
2.6 Volatility and Expected Range
The 14-day average true range is 426.90 points and the 14-day average daily range is 379.30 points. A one-ATR envelope around the 29,256.75 settlement spans 28,829.85 to 29,683.65. The completed 496.75-point session used about 1.16 ATR and 1.31 ADR, while the developing session's first 230.25 points used about 0.54 ATR.
The distinction matters for Thursday. The upper one-ATR boundary at 29,683.65 sits above the 20-day average but below the 100-day average and the second pivot resistance at 29,783.25. A move into 29,545 to 29,603 is therefore ordinary within one recent true range; a sustained move through 29,785 would be a structural change rather than normal noise. On the downside, the first pivot support at 29,023.25 remains inside one ATR of settlement, while the second pivot support at 28,789.75 sits just beyond it.
4.1 Mag7 Earnings and AI Capex Cycle
NQ's relative strength shows that durable growth exposure remained preferred even as the broader market weakened. That preference is supportive on dips, but it is not enough by itself to overcome the rate channel while the contract remains beneath the 20-day, 50-day and 100-day averages.
4.2 Semiconductor Cycle and Tech Sector Rotation
The Nasdaq cash index finished nearly unchanged while the S&P 500 and Dow declined. That relative strength supports the developing-session rebound and suggests the policy selloff was concentrated more heavily in cyclicals and rate-sensitive broad-market exposure than in the technology core.
4.3 Fed Policy and Real Yields (Duration Sensitivity)
The policy rate increased 25 basis points to 4.00 percent in the first increase in three years, and the vote was unanimous. The published projection path moved above expectations across its horizons, with most officials indicating at least one more increase this year. The 10-year yield held near 5 percent and the dollar strengthened after the decision.
Higher long-end yields reduce the present value assigned to distant cash flows, which raises the hurdle for technology multiples even when earnings expectations do not change. Thursday's 8:30 AM ET data group and 1:00 PM ET inflation-protected securities auction matter because either can move the real-yield path after the policy decision.
4.4 Geopolitical Backdrop
Headline sensitivity remains present through energy, trade and technology-policy channels, but it was not the dominant driver of the evening rebound. The practical implication is to treat an unscheduled headline as a macro override rather than build it into the base case.
4.5 Cross-Asset and Volatility
The broad cash index fell 0.45 percent, the Dow fell 1.21 percent and the technology cash index gained 0.02 percent. The volatility index closed at 17.71 after reaching about 19 intraday, while the 10-year yield held near 5 percent and the dollar index was firm. The split marks meaningful relative resilience in technology, but the volatility and rates combination still argues for wider intraday swings around Thursday's data and auction.
4.6 Institutional Positioning
The fund proxy carried a 704 reference, a modeled threshold at 710, a central concentration at 700, an upper boundary at 720 and a lower boundary at 700. A transition marker sat at 713. These values describe the fund's own positioning surface and are not converted into NQ prices, because contract basis and component weighting do not support a stable one-number translation.
The valid conclusion is directional rather than arithmetic: the proxy sits among several nearby concentrations, so hedging behavior can change quickly as the fund moves through 700 to 713.
Options positioning context
The fund proxy is directionally useful for large-cap technology exposure, but it is supplementary to NQ futures structure. Concentrations around 700 to 713 suggest sensitivity around the current fund price, and the 720 upper boundary frames the proxy's recovery ceiling. Contract basis, daily roll and component weighting prevent direct level translation.
For that reason, the futures trade is built entirely from NQ references: the first pivot resistance at 29,520.00, the completed-session high, the 50-day and 20-day averages, and the second pivot resistance at 29,783.25. The proxy can confirm whether technology hedging is helping or resisting the move; it cannot supply the futures stop.
Night Session (6:00 PM ET September 16 to 3:00 AM ET September 17, Globex/Asia)
Bias is constructive but conditional. The 6:00 PM ET session opened at 29,271.00, 15.50 points below the pivot at 29,286.50, before reclaiming the pivot and the 5-day average. Holding 29,400 favors another 29,478 test and then the first pivot resistance at 29,520. Losing 29,286.50 exposes 29,247.75 and converts the rebound into a failed reclaim. Expected working band is 29,250 to 29,570.
London Session (3:00 AM to 8:00 AM ET September 17)
Bias is two-sided inside resistance. Eurozone CPI at 5:00 AM ET and the Bank of England decision at 7:00 AM ET create the first yield and currency tests. A rise in global yields favors rejection in the 29,520 to 29,603 band; a softer rate response gives the rebound room to test the lower part of that band. Expected working band is 29,300 to 29,570, aligned with the most-likely full-session ceiling.
Morning Session (9:30 AM to 12:00 PM ET September 17, RTH Open)
US claims and housing data arrive at 8:30 AM ET. The first question is whether the data extend the post-decision move in yields. The 9:30 AM ET cash open then determines whether the first pivot resistance at 29,520 becomes support or rejects the rebound. A rejection with weakening technology breadth activates the short setup; acceptance through 29,603 argues for patience until the 100-day average near 29,737.
Afternoon Session (12:00 PM to 4:00 PM ET September 17)
The 10-year inflation-protected securities auction is scheduled at 1:00 PM ET and is the day's cleanest direct test of real-yield demand. A weak auction and rising real yield favor renewed pressure into the 4:00 PM ET close. A well-received auction that lowers the long end would undermine the short and can carry the contract through the 20-day average.
Night Session Forward (6:00 PM ET September 17)
At the 6:00 PM ET reopen, four-hour acceptance above 29,785 would invalidate the short thesis and put 30,016.75 into view. Continued trade below 29,520 keeps 29,286.50 and 29,023.25 active. Friday's quarterly expiration raises the chance that Thursday's closing location carries directly into the next session.
Expected Range (September 17 Full Session)
Low-range scenario: 29,247 to 29,570, a 323-point band equal to about 0.85 times the 14-day average daily range
Mid-range scenario (most likely): 29,200 to 29,570, a 370-point band equal to about 0.98 times the 14-day average daily range
High-range scenario: the second pivot support at 28,789.75 to the third pivot resistance at 30,016.75, a 1,227-point tail band reserved for a material yield or policy shock
The scenario widths are analyst judgment, not calibrated probabilities. The mid-range case is intentionally narrower than one 14-day average true range and keeps the most likely path inside the first resistance grouping and above the first pivot support.
Most Likely Path
Analyst judgment favors an initial test of 29,520 to 29,570, a rejection below 29,603 and a rotation toward the pivot at 29,286.50. The reasoning is structural: the developing session has already reclaimed the pivot and 5-day average, while the next resistance band contains the first pivot resistance, the prior high and both medium-term averages.
If 29,286.50 holds on the first pullback, the session can remain a broad balance between the pivot and 29,603. A clean loss of the pivot shifts the path toward 29,247.75, then 29,096 and the first pivot support at 29,023.25. Acceptance above 29,603 would cancel the first rejection thesis and shift focus toward the 100-day average at 29,737.33 and the second pivot resistance at 29,783.25.
Thursday Economic Calendar
Eurozone CPI is scheduled at 5:00 AM ET and provides the first inflation impulse for global yields. The Bank of England decision follows at 7:00 AM ET, with the rate expected to remain at 3.75 percent and the vote split carrying more information than the unchanged headline.
The US block arrives at 8:30 AM ET: initial jobless claims are expected at 206.5 thousand against 206 thousand prior, continued claims at 1.7795 million, building permits at 1.41 million and housing starts at 1.319 million against 1.239 million prior. Pending home sales follow at 10:00 AM ET with a negative 0.1 percent forecast.
The 10-year inflation-protected securities auction is scheduled at 1:00 PM ET. For NQ, the 8:30 AM ET data group is the first-order scheduled event because it can reset the policy path, while the auction is the direct confirmation or rejection through real yields. Friday's quarterly expiration remains the structural event immediately beyond Thursday.
Primary Trade Setup
Direction: Short
Rationale: The rebound is approaching a layered resistance band containing the first pivot resistance at 29,520.00, the completed-session high at 29,549.75, the 50-day average at 29,570.95 and the 20-day average at 29,603.20 while the daily structure remains corrective. Negative directional movement remains dominant, but trend strength is low enough that entry requires an observed rejection rather than a market order into strength.
Entry Zone: 29,545 to 29,568, on a failed attempt to hold above the completed-session high and 50-day average
Stop Loss: 29,785 (above the second pivot resistance at 29,783.25; a stop-out requires clearing the 100-day average and the entire immediate pivot structure)
Target 1 (T1): 29,286.50 (the pivot)
Target 2 (T2): 29,023.25 (the first pivot support)
Target 3 (T3, extended): 28,789.75 (the second pivot support)
Risk-to-Reward: From the 29,556.50 midpoint, risk to 29,785 is 228.50 points. T1 offers 270 points, approximately 1:1.2; T2 offers 533.25 points, approximately 1:2.3; T3 offers 766.75 points, approximately 1:3.4. From the less favorable 29,545 edge, T1 offers 258.50 points against 240 points of risk.
Invalidation: Four-hour acceptance above 29,785 invalidates the lower-high thesis and opens the third pivot resistance at 30,016.75.
Macro override: A sustained real-yield decline paired with broad large-cap technology strength through 29,785 cancels the short. The same applies if the 8:30 AM ET data materially softens the policy path and the cash open confirms with expanding semiconductor breadth.
Alternate setup: Long only after acceptance above 29,785, with 29,737 to 29,783 holding as support on a retest. The first objective is the third pivot resistance at 30,016.75.
Sources and methodology
This outlook is built from our session review of the December E-mini Nasdaq-100 contract, prepared after Wednesday's close on September 16, 2026. Computed pivot levels come from Wednesday's session high, low and settlement, which reproduce all seven published pivot levels. Fund proxy concentrations are quoted in the fund's own price domain and are never converted into futures prices. Closing figures for the Nasdaq-100, the S&P 500, the Dow and the volatility index were checked against published closing data.
Scenario ranges are analyst judgment; they are not statistically derived and carry no calibration. Contract months are kept separate throughout, and approximate references are labelled wherever they appear.
Wednesday’s outlook for this contract is here. Outlooks for ES, NQ, GC and CL are collected on the market outlook page, and our forward trading record is on the performance statement.



