
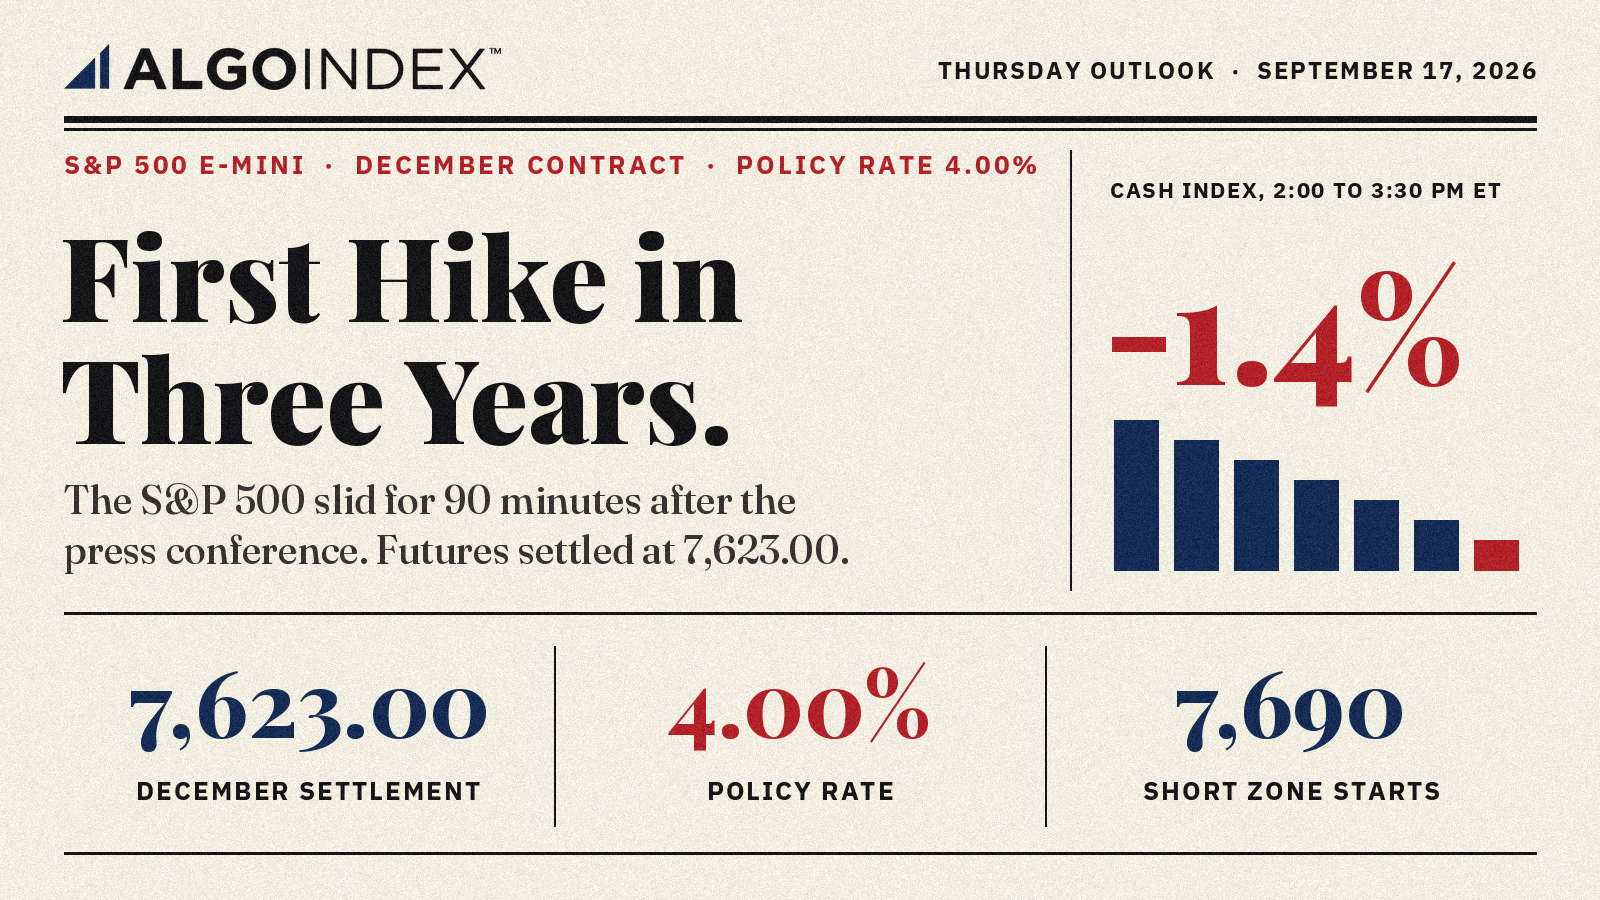
At 2:00 PM ET on Wednesday, the S&P 500 stood at 7,613.32 on our five-minute bar record, higher on the day. The Federal Reserve then raised its policy rate 25 basis points to 4.00 percent, its first increase in three years, on a unanimous vote. The index held for half an hour. The press conference began at 2:30 PM ET, and by 3:30 PM ET the cash index was trading near 7,508, a slide of about 1.4 percent in 90 minutes. It closed at 7,551.81, down 0.45 percent.
December E-mini futures settled at 7,623.00, down 0.43 percent and 48 points above a 7,575.00 session low. The measured premium to the cash close was 71.19 points. After the reopen, futures dipped to 7,617.50 and climbed back to 7,668.00, reclaiming the 7,632.33 pivot and the 7,629.22 100-day average. The contract still trades beneath its 5-day, 50-day and 20-day averages. Thursday's first question sits 22 points above that evening high.
December S&P 500 futures settled at 7,623.00 after the Fed raised rates to 4.00 percent, then rebounded to 7,668.00 in evening trade. Resistance runs from the 7,689.67 first pivot resistance through Wednesday's 7,699.00 high to the 7,704.53 50-day average. Support starts at the 7,632.33 pivot and the 7,629.22 100-day average. The primary setup is a short from 7,690 to 7,698, stop 7,738, targets 7,632.33, 7,584 and 7,565.67.
A short that never filled
Our Wednesday outlook set a short at 7,700 to 7,705 ahead of the decision. The pivot inputs put Wednesday's high at 7,699.00. One point short. The trade never triggered, and the contract then fell to 7,575.00, straight through all three targets we had published. A level that close still earns nothing, and it shaped Thursday's plan: the new entry band starts ten points lower, at 7,690.
The 124-point futures range ran about 1.71 times the 72.50-point average true range. An event day, then. The settlement finished 38.7 percent of the way up that range after a sharp afternoon reversal, and the cash index closed only 43.46 points above its 7,508.35 low inside a 118.08-point range that topped at 7,626.43. Futures and cash printed the same weak closing location.
Fifteen points of resistance
Three references sit inside 15 points. The first pivot resistance is 7,689.67. Wednesday's high is 7,699.00. The 50-day average is 7,704.53. The upper edge of a one-ATR envelope around the settlement, 7,695.50, lands in the middle of that band. The 4-hour chart has printed lower highs from the 7,820 area through 7,750 and 7,715, so a rally into 7,690 would test the latest of those shelves.
Above the band, the 20-day average at 7,732.48 caps the moving-average stack and 7,738 marks where the short idea fails. The second pivot resistance is 7,756.33 and the third 7,813.67. The 5-day average at 7,672.25 is the first average overhead, 49.25 points above the settlement.
Beneath price the map tightens. The 4-hour equilibrium near 7,645 held the evening rebound together. The 7,632.33 pivot and the 7,629.22 100-day average sit 3.11 points apart. The 7,617.50 evening low marks the last higher low of the rebound. Below it come the 7,600 round number, the 7,584 intraday shelf, the 7,565.67 first pivot support, 7,508.33 and 7,441.67. The 200-day average at 7,320.79 sits 302.21 points below the settlement, so the long-horizon advance is intact.
Projections above forecast at every horizon
The increase itself matched the 4.00 percent forecast. The projections did the damage. The median path came in above forecast at every horizon: 4.125 percent next year against 3.875, 3.875 percent in two years against 3.625, 3.625 percent in three years against 3.375 and a 3.25 percent long-run rate against 3.125. Twelve of 18 officials see one more increase this year. Four see two.
Rates and the dollar firmed. The 10-year yield held near 5 percent. The volatility index reached about 19 before closing at 17.71, up 2.97 percent. Participation thinned out. The Dow fell 1.21 percent while the Nasdaq-100 gained 0.02 percent, a 1.23 percentage point split. A higher discount rate compresses multiples across the index and a firmer dollar weighs on multinational earnings, so a rebound led by the same technology names carries less weight than one that pulls in financials, industrials and cyclicals.
Crude eased the pressure slightly. October WTI settled at 102.43, down 3.21 percent, removing one inflation input. End-of-day options commentary described a negative-gamma environment around 7,600 on the cash index, where dealer hedging tends to extend moves, along with defensive demand after the decision.
The trade map for Thursday
The primary setup is a short from 7,690 to 7,698 on a failed attempt to hold above the first pivot resistance and Wednesday's high. The stop sits at 7,738, above the 20-day average at 7,732.48, so a stop-out requires clearing the whole short-term average stack. That is 40 points above the zone. The first target is the 7,632.33 pivot, the second the 7,584 shelf and the third the 7,565.67 first pivot support.
From the 7,694 midpoint the risk is 44 points. The first target returns 61.67 points, about 1.4 times that risk. The second returns 110 points, about 2.5 times, and the third 128.33 points, about 2.9 times. Measured from the less favorable 7,690 edge, the first target still pays 57.67 points against 48 points of risk. Four-hour acceptance above 7,738 ends the thesis and points to 7,756.33. A sustained drop in real yields with broad participation cancels it too, as does 8:30 AM ET data that softens the policy path while breadth improves at the cash open. The alternate is a long only after acceptance above 7,738 and a successful retest of 7,704 to 7,732, aiming at 7,756.33 and then 7,813.67.
Oscillators argue for patience. The 14-day stochastic reads 18.36, stretched enough to feed a rebound, and the 14-day relative strength index is 44.62. The directional index is 16.36, with negative direction at 26.16 against positive at 13.32. Negative leads by almost two to one inside a weak trend. The multi-indicator composite is a 16 percent sell with minimum strength, and historic volatility is 8.70. Nothing in that set supports selling weakness near support, which is why the entry waits for a failed test of resistance.
Thursday's calendar starts early. Eurozone inflation lands at 5:00 AM ET and the Bank of England decision at 7:00 AM ET, with the rate expected to stay at 3.75 percent. At 8:30 AM ET come initial jobless claims, expected at 206.5 thousand against 206 thousand, continued claims at 1.7795 million, building permits at 1.41 million and housing starts at 1.319 million against 1.239 million. Pending home sales follow at 10:00 AM ET with a negative 0.1 percent forecast. A 10-year inflation-protected securities auction at 1:00 PM ET tests real yields directly.
Scenario ranges are analyst judgment. The low-range case runs 7,617 to 7,690. The most likely case runs 7,625 to 7,700, about 1.03 times the average true range, and the tail case spans 7,508.33 to 7,756.33. Session bands run 7,617 to 7,690 overnight and 7,625 to 7,710 through London. The most likely path tests 7,690 to 7,698 early, fails beneath the 50-day and 20-day averages and rotates toward 7,632.33. If the pivot and the 100-day average hold on that pullback, the contract can balance between 7,629 and 7,705. A loss of 7,617.50 opens 7,600 and 7,584.
Friday's quarterly expiration comes next, which makes Thursday's closing location worth more than usual.
The complete data picture
Every number behind Thursday’s plan, charted first, then the full level map, then the complete numeric reference underneath.
Full numeric reference, every remaining figure from the session review
Level notes
7,813.67 ES (SPX 7,742.48), the third pivot resistance. The outer upside extension, relevant only if the policy reversal is fully retraced.
7,756.33 ES (SPX 7,685.14), the second pivot resistance. The first computed objective after invalidation of the primary short.
7,738 ES (SPX 7,666.81), trade invalidation. Placed above the 20-day average to require genuine acceptance rather than a brief probe.
7,732.48 ES (SPX 7,661.29), 20-day average. The top of the immediate average stack and the structural line behind the stop.
7,704.53 ES (SPX 7,633.34), 50-day average. Only 5.53 points above the completed-session high and part of the main resistance confluence.
7,699.00 ES (SPX 7,627.81), completed-session high. A direct price reference inside the entry decision band.
7,689.67 ES (SPX 7,618.48), the first pivot resistance. The primary recovery ceiling and lower edge of the preferred short-entry zone.
7,672.25 ES (SPX 7,601.06), 5-day average.
7,645 ES (SPX 7,573.81), 4-hour equilibrium. Holding above it keeps the developing rebound organized.
7,632.33 ES (SPX 7,561.14), the pivot. The first formal support and the initial target of the primary short.
7,629.22 ES (SPX 7,558.03), 100-day average. Only 3.11 points beneath the pivot, producing a two-method balance area.
7,623.00 ES (SPX 7,551.81), completed-session close pair. The anchor for the measured basis used throughout this outlook.
7,617.50 ES (SPX 7,546.31), developing-session low. Loss of this level would erase the evening higher-low sequence.
7,600 ES (SPX 7,528.81), round-number chart reference. A psychological shelf between the developing low and the first downside target.
7,584 ES (SPX 7,512.81), intraday chart support. The second target of the primary setup and a futures equivalent near the cash-session lower region.
7,565.67 ES (SPX 7,494.48), the first pivot support. The third target and the first formal pivot support beneath the completed-session low.
7,508.33 ES (SPX 7,437.14), the second pivot support. The next computed downside extension.
7,441.67 ES (SPX 7,370.48), the third pivot support. The outer pivot objective, reserved for a renewed policy or yield shock.
2.1 Intraday and Session Review
The completed-session high at 7,699.00 and low at 7,575.00 reproduce the full pivot ladder. The 124-point futures range was about 1.71 times both the 14-day average true range and average daily range of 72.50, confirming an event-sized expansion day rather than an ordinary rotation.
The settlement at 7,623.00 finished 48 points above the low, or 38.7 percent of the way up the range, after a sharp afternoon reversal. SPX cash showed the same weak closing location: the 7,551.81 close sat 43.46 points above the 7,508.35 low inside a 118.08-point cash range. The agreement between futures and cash closing quality strengthens the corrective interpretation.
The developing session opened at 7,624.00, dipped to 7,617.50 and then rebounded to 7,668.00, a 50.50-point first range equal to about 0.70 of a recent average session. Buyers have repaired the immediate policy decline, but the recovery remains below the 5-day average and the first pivot resistance.
2.2 Daily Structure
The settlement is 49.25 points below the 5-day average at 7,672.25, 81.53 points below the 50-day average at 7,704.53 and 109.48 points below the 20-day average at 7,732.48. The 100-day average at 7,629.22 is only 6.22 points above settlement and forms the immediate balance marker. The 200-day average at 7,320.79 remains 302.21 points beneath settlement, so the long-horizon advance has not broken.
The structure is therefore corrective across the short and intermediate windows but intact across the longer window. That separation matters for trade selection: the preferred short is defined at a resistance confluence after a rebound, not pursued near the 100-day average or the cash support zone around 7,500.
2.3 4-Hour and Swing Structure
The 4-hour chart shows lower highs from the 7,820 area through 7,750 and 7,715. The rebound from 7,617.50 reclaimed an equilibrium area around 7,645 and is now approaching overhead supply near 7,680 to 7,700. the first pivot resistance at 7,689.67, the completed-session high at 7,699.00 and the 50-day average at 7,704.53 compress into a 15-point band.
A sustained break above 7,704.53 would interrupt the immediate lower-high sequence, but acceptance above 7,738 is required to clear the 20-day average and invalidate the primary short. A loss of 7,617.50 would erase the developing-session higher low and restore pressure toward 7,600, the 7,584 chart shelf and the first pivot support at 7,565.67.
2.4 Moving Averages
The moving-average stack against the 7,623.00 settlement is:
5-day average 7,672.25: price 49.25 points below; the first average challenged by the developing-session rebound
50-day average 7,704.53: price 81.53 points below; aligned with the completed-session high and immediately above the first pivot resistance
20-day average 7,732.48: price 109.48 points below; the level used to define the protective stop area
100-day average 7,629.22: price only 6.22 points below; reclaimed during the developing session and now the nearest balance marker
200-day average 7,320.79: price 302.21 points above; the long-horizon trend reference
The first four averages span 103.26 points from the 100-day to the 20-day. That is a compact enough grouping that a strong rebound can flip several signals quickly, but until the 20-day average is reclaimed the stack remains overhead supply rather than support.
2.5 Oscillator and Trend Readings
The 14-day relative strength index is 44.62, below neutral but not oversold. The 14-day stochastic reading is 18.36, which is stretched enough to explain the developing-session rebound and warns against selling weakness near support.
The 14-day directional index is 16.36, with positive directional movement at 13.32 and negative directional movement at 26.16. Negative direction is almost twice positive direction, but the low directional-index reading says that this bias has not matured into a strong trend. Historic volatility is 8.70, low in absolute terms even though the policy session expanded well beyond a recent average range.
The multi-indicator composite is a 16 percent sell with minimum strength and weak direction. The evidence supports a corrective market with responsive bounces rather than a strong directional trend. That is why the setup requires a failed test of resistance: the indicator set does not justify chasing price lower after an already expanded session.
2.6 Volatility and Expected Range
The 14-day average true range and average daily range are both 72.50 points. A one-ATR envelope around the 7,623.00 settlement spans 7,550.50 to 7,695.50. The completed-session range used about 1.71 ATR, while the developing session's first 50.50 points used about 0.70 ATR.
The upper envelope at 7,695.50 lies inside the short-entry band and only 3.50 points beneath the completed-session high. The lower envelope at 7,550.50 sits below the first pivot support at 7,565.67 but above the second pivot support at 7,508.33. This alignment makes 7,690 to 7,705 a natural volatility and structure test, while a sustained move through 7,738 would represent more than an ordinary one-range rebound.
4.1 Dollar, Rates, and Fed Policy
The policy rate increased 25 basis points to 4.00 percent in the first increase in three years, and the vote was unanimous. The published projection path moved above expectations across its horizons, with most officials indicating at least one more increase this year. The 10-year yield held near 5 percent and the dollar strengthened after the decision.
For ES, the mechanism is broad rather than sector-specific. A higher discount rate compresses equity multiples, a stronger dollar weighs on multinational earnings translation, and a restrictive path reduces the value of a near-term rebound unless growth data soften. Thursday's labor and housing block can move the expected path; the inflation-protected securities auction provides the direct real-yield confirmation.
4.2 Large-Cap Leadership and Earnings
The Nasdaq cash index finished nearly unchanged while SPX fell 0.45 percent and the Dow fell 1.21 percent. The broad index needs that leadership to widen into financials, industrials and cyclicals before the rebound can be treated as durable rather than narrow.
4.3 Geopolitical Backdrop
Existing headline risk remains secondary to the rates and policy response. It is treated as an unscheduled override rather than a base-case driver.
4.4 Sector Breadth and Rotation
The Dow declined 1.21 percent while Nasdaq cash finished with a 0.02 percent gain. That 1.23-percentage-point split indicates narrow leadership and weak broader participation. A Thursday rebound led only by the same technology core is less convincing than one accompanied by improving breadth and a lower volatility index.
4.5 Cross-Asset and Volatility
The volatility index reached about 19 and closed at 17.71. Crude settled at 102.43 after a 3.21 percent decline, the 10-year yield held near 5 percent and the dollar strengthened. Lower crude reduces one inflation input, but the rate and currency response remained restrictive.
4.6 Institutional Positioning
None of its futures-cash pairs, implied-move boundaries, flow totals or stop anchors is used in this outlook.
The valid positioning conclusion is qualitative only: the accompanying end-of-day commentary described a negative-gamma environment around the 7,600 SPX region and defensive demand after the policy decision.
Options positioning context
SPX closed at 7,551.81 after trading down to 7,508.35, leaving the cash close only 43.46 points above the low.
ES-to-SPX translations use only the measured 71.19-point completed-session basis stated above.
Night Session (6:00 PM ET September 16 to 3:00 AM ET September 17, Globex/Asia)
Bias is constructive inside a corrective structure. The 6:00 PM ET session opened at 7,624.00, 8.33 points below the pivot at 7,632.33, before reclaiming the pivot, the 100-day average and the 7,645 equilibrium. Holding 7,645 favors a test of 7,668, the 5-day average and the first pivot resistance at 7,689.67. Losing 7,632.33 exposes 7,617.50. Expected working band is 7,617 to 7,690.
London Session (3:00 AM to 8:00 AM ET September 17)
Eurozone CPI at 5:00 AM ET and the Bank of England decision at 7:00 AM ET provide the first rate and currency tests. A firm inflation or hawkish-rate response favors rejection at 7,680 to 7,705. A softer response can extend the rebound toward the 20-day average, but 7,738 remains the line that invalidates the short. Expected working band is 7,625 to 7,710.
Morning Session (9:30 AM to 12:00 PM ET September 17, RTH Open)
US claims and housing data arrive at 8:30 AM ET. The first question is whether the release extends the post-decision move in yields. The 9:30 AM ET cash open should then determine whether the rebound accepts above the first pivot resistance at 7,689.67. Rejection with weak breadth activates the primary short; acceptance through 7,704.53 argues for waiting until the 20-day average.
Afternoon Session (12:00 PM to 4:00 PM ET September 17)
The 10-year inflation-protected securities auction is scheduled at 1:00 PM ET. A weak auction and higher real-yield response would favor pressure into the 4:00 PM ET close. A well-received auction that lowers the long end would undermine the short and can carry ES through 7,704.53 toward 7,732.48.
Night Session Forward (6:00 PM ET September 17)
At the 6:00 PM ET reopen, four-hour acceptance above 7,738 would invalidate the short thesis and shift focus toward the second pivot resistance at 7,756.33. Continued trade below 7,690 keeps 7,632.33, 7,584 and 7,565.67 active. Friday's quarterly expiration makes Thursday's closing location particularly important.
Expected Range (September 17 Full Session)
Low-range scenario: 7,617 to 7,690, a 73-point band equal to about one 14-day average true range
Mid-range scenario (most likely): 7,625 to 7,700, a 75-point band equal to about 1.03 times the 14-day average true range
High-range scenario: the second pivot support at 7,508.33 to the second pivot resistance at 7,756.33, a 248-point tail band reserved for a material yield or policy shock
The scenario widths are analyst judgment, not calibrated probabilities. The mid-range case keeps the session around the 100-day average, pivot and first resistance grouping rather than assuming a repeat of Wednesday's 1.71-ATR expansion.
Most Likely Path
Analyst judgment favors an early test of 7,690 to 7,698, where the first pivot resistance and the completed-session high converge, followed by rejection below the 50-day and 20-day averages and a rotation toward the pivot at 7,632.33.
If the pivot and 100-day average hold on the first pullback, ES can remain in a broad balance between 7,629 and 7,705. Loss of 7,617.50 shifts the path toward 7,600 and 7,584. Acceptance above 7,704.53 weakens the first rejection thesis, while four-hour acceptance above 7,738 shifts focus toward the second pivot resistance at 7,756.33.
Thursday Economic Calendar
Eurozone CPI is scheduled at 5:00 AM ET and supplies the first inflation impulse for global yields. The Bank of England decision follows at 7:00 AM ET, with the rate expected to remain at 3.75 percent and the vote split carrying more information than the unchanged headline.
The US block arrives at 8:30 AM ET: initial jobless claims are expected at 206.5 thousand against 206 thousand prior, continued claims at 1.7795 million, building permits at 1.41 million and housing starts at 1.319 million against 1.239 million prior. Pending home sales follow at 10:00 AM ET with a negative 0.1 percent forecast.
The 10-year inflation-protected securities auction is scheduled at 1:00 PM ET. The 8:30 AM ET US data group is the first-order scheduled event because it can reset the post-decision policy path; the auction is the direct confirmation through real yields. Friday's quarterly expiration remains the next structural event.
Primary Trade Setup
Direction: Short
Rationale: The rebound is approaching a layered resistance band containing the first pivot resistance at 7,689.67, the completed-session high at 7,699.00 and the 50-day average at 7,704.53 inside a 4-hour lower-high sequence. The policy and rate backdrop remains restrictive, while the low trend-strength reading requires an observed rejection rather than a blind short.
Entry Zone: 7,690 to 7,698, on a failed attempt to hold above the first pivot resistance and the completed-session high
Stop Loss: 7,738 (above the 20-day average at 7,732.48; a stop-out requires clearing the complete short-term average stack)
Target 1 (T1): 7,632.33 (the pivot)
Target 2 (T2): 7,584 (intraday support above the lower boundary)
Target 3 (T3, extended): 7,565.67 (the first pivot support)
Risk-to-Reward: From the 7,694 midpoint, risk to 7,738 is 44 points. T1 offers 61.67 points, approximately 1:1.4; T2 offers 110 points, approximately 1:2.5; T3 offers 128.33 points, approximately 1:2.9. From the less favorable 7,690 edge, T1 offers 57.67 points against 48 points of risk.
Invalidation: Four-hour acceptance above 7,738 invalidates the lower-high thesis and opens the second pivot resistance at 7,756.33.
Macro override: A sustained real-yield decline paired with broad market participation through 7,738 cancels the short. The same applies if the 8:30 AM ET data materially softens the policy path and the cash open confirms with improving breadth beyond large-cap technology.
Alternate setup: Long only after acceptance above 7,738 and a successful retest of 7,704 to 7,732 as support. The first objective is the second pivot resistance at 7,756.33, followed by the third pivot resistance at 7,813.67.
Sources and methodology
This outlook is built from our session review of the December E-mini S&P 500 contract, prepared after Wednesday's close on September 16, 2026. Computed pivot levels come from Wednesday's session high, low and settlement, which reproduce all seven published pivot levels. Every cash-index equivalent uses one measured basis of 71.19 points, the 7,623.00 settlement less the 7,551.81 cash close. The cash-index path around the decision comes from our own five-minute bar archive, and closing figures for the S&P 500, the Dow, the Nasdaq-100, the volatility index and crude oil were checked against published closing data.
Scenario ranges are analyst judgment; they are not statistically derived and carry no calibration. Contract months are kept separate throughout, and approximate references are labelled wherever they appear.
Wednesday’s outlook for this contract is here. Outlooks for ES, NQ, GC and CL are collected on the market outlook page, and our forward trading record is on the performance statement.



