
At 10:00 AM ET on Tuesday, real-time hedging flow on the S&P 500 read close to zero. By 10:30 AM ET it read about minus 5 billion dollars of delta, and the index was extending lower with it. Price steadied once it reached a pocket of same-day positive gamma between 7,560 and 7,570 on the cash index. That pocket expired at the close. The index finished at 7,585.73, down 0.45 percent. The 10-year Treasury yield closed at 5.006 percent after trading as high as 5.041 percent, its highest level since 2007.
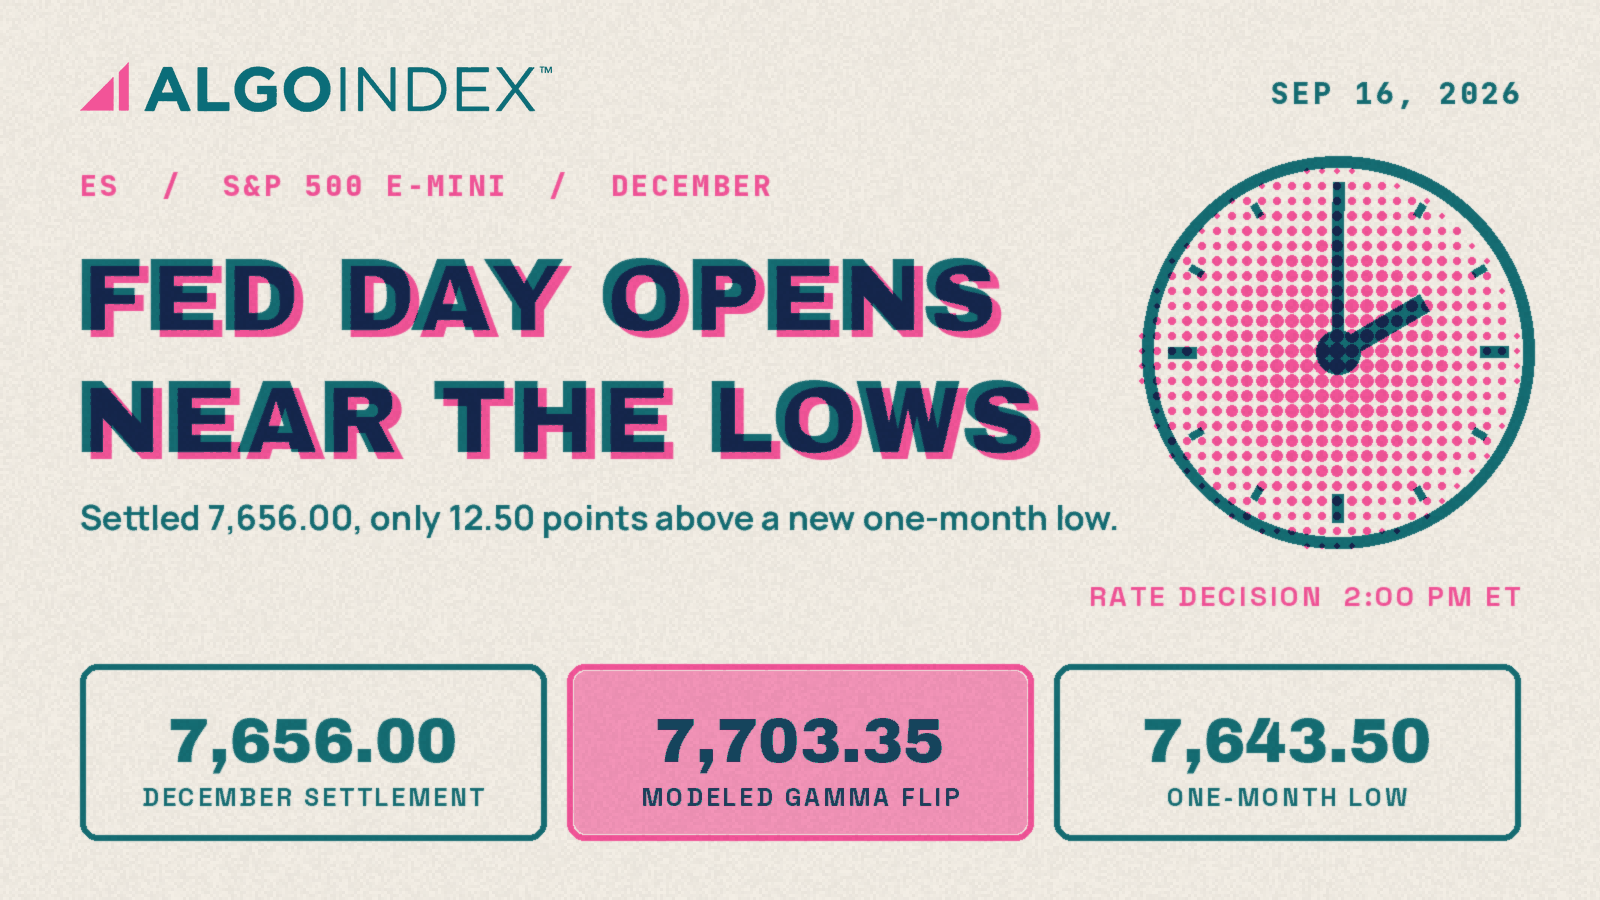
December E-mini futures settled at 7,656.00, 12.50 points above the session low. That low, 7,643.50, is also the one-month low. The settlement sits 47.35 points beneath the modeled gamma-flip level at 7,703.35, where dealer hedging stops amplifying moves and starts absorbing them. Wednesday brings the rate decision and new projections at 2:00 PM ET. A 25 basis point increase is more than 90 percent priced. The guidance carries the risk.
December S&P 500 futures settled at 7,656.00, just above a 7,643.50 one-month low, after the 10-year yield closed above 5 percent and the cash index fell 0.45 percent. The key Wednesday levels are the 7,700 to 7,705 band overhead, where Tuesday's high meets the 7,703.35 modeled gamma-flip level, and the 7,643.50 low beneath. The primary setup is a short from 7,700 to 7,705, stop 7,727, targets 7,666.83, 7,643.50 and 7,626.75, ahead of the 2:00 PM ET decision.
Lean bearish beneath the modeled gamma-flip level. The short from 7,700 to 7,705 is primary, and projections implying a pause retire it.
A low that two methods agree on
Our Tuesday outlook called a close beneath 7,662.75 the first structural break of the week and named the 7,650.75 one-month low as the next stop. December settled at 7,656.00. The one-month low now reads 7,643.50.
That low is the line that matters most on Wednesday. Its cash equivalent near 7,574 lands on the 7,573.5 low of the implied one-day move, and the market spent all of Tuesday inside that band. Two unrelated calculations put a level in the same place. The 50 percent retracement of the 13-week range sits two points higher at 7,645.50, and the computed downside objective at 7,650.78 caps the shelf.
Beneath it the map thickens fast. The first pivot support is 7,632.67. Then comes the pair that decides whether this is still a pullback: one standard deviation support at 7,626.75 and the 100-day average at 7,626.08, only 17.42 points under Tuesday's low. The 2-standard-deviation support at 7,614.63 sits 1.13 points above the 40-day stall reference at 7,613.50. The second pivot support at 7,609.33 sits just above the 3-standard-deviation line at 7,605.34. Deepest of all, the third pivot support at 7,575.17 nearly touches the published put-side support base at 7,570.35, cash 7,500.
Momentum is stretched to the downside. The 14-day stochastic reads 12.51 on its percent K line against 18.77 on percent D, and the 20-day percent K is 11.35. Relative strength runs 40.22, 43.96 and 46.85 on the 9, 14 and 20-day windows. Trend strength is thin, with a 14-day directional index of 14.20 and negative direction at 23.37 against positive at 15.64. The multi-indicator composite reads 16 percent sell, far milder than the Nasdaq's 64 percent. Stretched, then, but not yet trending.
Two points of air at 7,700
Overhead, the computed pivot at 7,666.83 comes first, only 10.83 points above the settlement. The 5-day average at 7,681.15 follows, then the first standard deviation resistance at 7,685.25 and the first pivot resistance at 7,690.17. The next band is the one the whole session turns on. Tuesday's high of 7,701.00 and the modeled gamma-flip level at 7,703.35 sit 2.35 points apart, with the 50-day average at 7,704.04 and the 3-standard-deviation resistance at 7,706.66 packed in behind them.
Clear that, and a second shelf waits. One 14-day average daily range above the settlement reaches 7,720.52, and one average true range reaches 7,722.49. The second pivot resistance at 7,724.33, the 40-day crossing at 7,724.40, the modeled volatility threshold at 7,725.35 and the 9-day crossing at 7,726.06 sit inside two points. The 38.2 percent retracement from the four-week low at 7,737.76, the 20-day average at 7,741.23, the 18-day crossing at 7,743.31 and the third pivot resistance at 7,747.67 close out the map.
Dealer positioning argues against a smooth climb through any of it. On the cash index, estimated gamma notional is minus 286.897 million dollars, with a tilt of 0.966, call gamma of 9 billion and put gamma of minus 3.3 billion. The tracking fund looks worse. Its gamma notional is minus 1.715 billion dollars, its tilt 0.607 and its put gamma minus 7.9 billion. It closed at 758.05, beneath its modeled flip at 765, its volatility threshold at 762 and its put-side base at 760. Puts dominated. Put volume ran 1.42 times call volume, and put open interest stands at 14.631 million contracts against 10.43 million calls.
The volatility surface looks calm by comparison. The volatility index closed at 17.21 and its own volatility gauge at 95. At-the-money implied volatility for Wednesday is 19.0 percent, about 119 basis points, or roughly 90 points on the cash index. The 14-day average true range is only 66.49 points. Options already price an outsized day.
Five percent and a decision already priced
Rates did the damage on Tuesday. The 10-year yield's close above 5 percent capped a run of firm data. Core consumer prices rose 0.3 percent against a 0.2 percent forecast, producer prices ran 5.4 percent year over year against 5.3 percent, and payrolls printed 162,000 against a 55,000 forecast. A long end at those levels compresses equity multiples, and the ordering on the day fit that mechanism. The Nasdaq-100 fell 0.65 percent and the Dow 0.63 percent.
Correction, September 16, 2026, 2:37 AM ET: An earlier version of this article gave the Nasdaq-100's decline on Tuesday as 0.67 percent. It fell 0.65 percent. The figure is corrected throughout, and the Saudi pipeline passage in the numeric reference now also carries the US Energy Secretary's estimate that the outage will be measured in days.
Energy fed the move. October WTI crude settled at 105.83, up 4.38 percent, and crude's supply picture keeps inflation expectations climbing. After the close, industry data showed a 7.14 million barrel crude build against an expected 1.8 million barrel draw. The government report at 10:30 AM ET is forecast to show a 1.5 million barrel draw.
The decision itself is largely discounted. Consensus sits at 4.00 percent against a 3.75 percent prior, and the last meeting's vote was 9 to 3, with all three dissents favoring an increase. Projections implying further increases in October and December would extend the pressure. Projections implying a pause after this move would open a recovery through 7,703 toward 7,725. The next decision is October 28, and the next projection round is December 9.
Earlier tests come first. UK consumer prices at 2:00 AM ET are forecast at 3.1 percent against 2.9 percent. US retail sales at 8:30 AM ET are forecast to rise 0.8 percent after a 0.6 percent decline. A volatility-index expiration at 9:30 AM ET can distort the open. Bank of Canada minutes land at 1:30 PM ET, the press conference at 2:30 PM ET, and a quarterly expiration closes the week on Friday, September 18.
The trade map for Wednesday
The primary setup is a short on a retest of 7,700 to 7,705, where the session high and the modeled flip level meet. The stop sits at 7,727. That level clears the second pivot resistance and the 7,725.35 volatility threshold, so a stop-out requires price to reclaim the stabilizing side of the positioning structure.
| Setup | Primary: short | Alternate: long |
|---|---|---|
| Condition | Retest of Tuesday's high at the modeled flip level | Reclaim of 7,727 with follow-through |
| Entry zone | 7,700 to 7,705 | Above 7,727 |
| Stop | 7,727 | Beneath 7,703 |
| Target 1 | 7,666.83 (computed pivot) | 7,741 |
| Target 2 | 7,643.50 (Tuesday's low, one-month low) | 7,747.67 (third pivot resistance) |
| Target 3 | 7,626.75 (one SD support, 100-day 7,626.08) | None |
| Reward to risk | 1.5, 2.4, 3.1 from 7,702.50, 24.50 points of risk | Smaller size |
| Invalidation | Hourly close above 7,741 to 7,748 | Back beneath 7,703 |
| Override | Projections implying a pause | Projections implying further increases |
From a 7,702.50 midpoint the risk is 24.50 points. The first target at the 7,666.83 pivot returns about 1.5 times that risk, the second at the 7,643.50 low about 2.4 times, and the third at the 7,626.75 standard deviation support about 3.1 times. The third needs momentum through the low on expanding volume. An hourly close above the 7,741 to 7,748 band, where the 20-day average and third pivot resistance sit, ends the idea. A projection round implying a pause ends it sooner. The alternate trade is a long on a reclaim of 7,727, aiming at 7,741 and then 7,747.67 with a stop beneath 7,703, taken at smaller size because it runs against the average stack.
The oversold oscillators are the standing argument against the short. A 14-day percent K of 12.51 at a one-month low is where relief rallies start, and that is why the entry is tied to one confluence instead of weakness in general.
Scenario ranges are analyst judgment. The low-range case, 7,620 to 7,700, fits guidance read as neutral. The mid-range case, the most likely, runs 7,600 to 7,720. The high-range case, 7,560 to 7,760, needs a guidance surprise in either direction. The session bands run 7,640 to 7,690 overnight, 7,635 to 7,695 through London, 7,640 to 7,705 in the morning and 7,600 to 7,730 after the decision. The most likely path lifts into the pivot and the 7,700 to 7,705 band before noon, stalls while participants wait, and expands after 2:00 PM ET. A failure at that band and a retest of 7,643.50 is the higher-conviction outcome.
The cash index closed Tuesday about 14 points beneath 7,600, the line where the positioning model says dealer hedging works against the index into Friday.
The complete data picture
Every figure behind the session for the December E-mini S&P 500: the key readings, the remaining charts, the full level map, then the complete numeric reference.
Complete level map, split at the December settlement 7,656.00. December futures with cash equivalents. Published positioning pairs carry the model’s plus 70.35 point offset; pivots and bands use the measured 70.00 point basis against the 7,585.73 cash close.
| Resistance, top down | Support, top down |
|---|---|
| 8,070.35Primary gamma concentration, cash 8,000 | 7,650.78Computed objective, cash 7,581 |
| 7,905.0052-week and 13-week high | 7,645.5050% of 13-week range, cash 7,576 |
| 7,890.25One-month high | 7,643.50Tuesday low and one-month low |
| 7,870.35Primary call-side ceiling, cash 7,800 | 7,632.671st pivot support, cash 7,563 |
| 7,795.9938.2% retracement from the 4-week high | 7,626.751st SD support, cash 7,557 |
| 7,766.8850% of the 4-week span | 7,626.08100-day average |
| 7,747.673rd pivot resistance, cash 7,678 | 7,614.632nd SD support, cash 7,545 |
| 7,743.3118-day average crossing | 7,613.5040-day stall reference |
| 7,741.2320-day average | 7,609.332nd pivot support, cash 7,539 |
| 7,737.7638.2% from 4-week low | 7,605.343rd SD support |
| 7,726.069-day average crossing | 7,591.48One 14-day daily range below |
| 7,725.35Modeled volatility threshold, cash 7,655 | 7,589.51One 14-day true range below |
| 7,724.4040-day average crossing | 7,575.173rd pivot support, cash 7,505 |
| 7,724.332nd pivot resistance, cash 7,654 | 7,570.35Put-side support base, cash 7,500 |
| 7,722.49One 14-day true range above | 7,386.0013-week low |
| 7,720.52One 14-day daily range above | 7,349.60Year-to-date average |
| 7,706.663rd SD resistance, cash 7,637 | 7,317.85200-day average |
| 7,704.0450-day average | 6,466.0052-week low |
| 7,703.35Modeled gamma-flip level, cash 7,633 | |
| 7,701Tuesday high | |
| 7,690.171st pivot resistance, cash 7,620 | |
| 7,685.251st SD resistance | |
| 7,681.155-day average, cash 7,611 | |
| 7,666.83Computed pivot, cash 7,597 |
Full numeric reference: every figure from the session review
1. Executive Summary
The December S&P 500 E-mini settled Tuesday at 7,656.00 after a 57.50 point session between 7,701.00 and 7,643.50, closing in the lower 22 percent of that range. The low itself is the material fact: 7,643.50 is also the one-month low, so the contract did not merely drift lower, it printed a fresh monthly extreme and then failed to recover into settlement. The cash index closed at 7,586, down about 0.45 percent, while the Dow fell about 0.63 percent and the Nasdaq-100 about 0.65 percent.
The driver was the rates and energy complex rather than anything equity-specific. Benchmark 10-year Treasury yields topped 5 percent, the highest since 2007, and crude rose about 4 percent to trade above 105 dollars, with crude volatility up about 4 percent alongside it. The broad index absorbed this better than the Nasdaq did, which is the expected ordering when the shock is a discount-rate shock, and it shows up in the relative technical position: the December S&P contract still holds above its 100-day average at 7,626.08, while the December Nasdaq contract has already lost that reference.
The structural contradiction is between a deeply oversold short-horizon oscillator set and a destabilizing positioning environment. The 14-day stochastic percent K sits at 12.51 and the 20-day at 11.35, which is the kind of reading that normally precedes a bounce. Against that, the contract settled 47.35 points beneath the modeled gamma-flip level published for this contract at 7,703.35, and beneath that threshold dealer hedging extends moves rather than absorbing them. The multi-indicator composite is only 16 percent sell, far less committed than the Nasdaq's 64 percent, so this is a market that is stretched but not yet trending.
Wednesday resolves it. A 25 basis point increase is more than 90 percent priced into a decision that lands at 2:00 PM ET with a full projection round. The primary setup is a short into a retest of 7,700 to 7,705, where Tuesday's session high at 7,701.00 and the modeled gamma-flip level at 7,703.35 sit within about two points of each other, making that band the single cleanest line on the chart.
2. Price Action and Technical Structure
2.1 Intraday and Session Review
Tuesday's December contract session ran 7,701.00 to 7,643.50, a 57.50 point band, and settled at 7,656.00, just 12.50 points above the low. Those extremes are the completed-session inputs behind the published pivot ladder rather than an independently read bar, and the settle itself is confirmed separately by two sources.
The cash index traded inside a 59 basis point intraday range and closed at 7,586, beneath the level the positioning model had flagged as its pivot for the session at 7,590. The order of events is documented by the flow data. Roughly 17,000 zero-dated 7,560 by 7,555 put spreads opened near 9:40 AM ET, and roughly 11,000 zero-dated 7,620 by 7,625 call spreads opened near 10:00 AM ET. Between 10:00 AM and 10:30 AM ET real-time hedging flow fell sharply from around zero to about negative 5 billion dollars in delta, which coincided with the index extending lower. As price reached the 7,560 to 7,570 positive-gamma pocket, that hedging flow flattened and price stabilized with it. Total hedging flow finished the day near negative 5 billion dollars in delta, of which roughly negative 5.5 billion was zero-dated put flow.
One observation is worth separating from that narrative. The published implied one-day move low at 7,573.5 held through the session, and the market stayed inside the implied band all day. That band was computed from Monday's 7,619 reference, so it governed Tuesday specifically and will be recomputed for Wednesday.
Since the 4:00 PM ET settle and the Globex reopen the contract has traded 7,663.25 at the open with a 7,667.25 high and 7,660.00 low, printing 7,664.75 on about 15,019 contracts. That is 8.75 points above Tuesday's settle, or about 0.11 percent, and is a thin overnight repair rather than a directional statement.
2.2 Daily Structure
The settle sits at the bottom of its monthly distribution: the one-month high is 7,890.25 and the one-month low is 7,643.50, which Tuesday set. The 13-week high and the 52-week high are the same number, 7,905.00, leaving the settle about 3.1 percent beneath the annual peak. The 13-week low is 7,386.00 and the 52-week low is 6,466.00, so the contract remains about 18.4 percent above its annual trough.
The five-day change is negative 44.25 points, or negative 0.57 percent, and the 20-day change is negative 114.75 points, or negative 1.47 percent. Set against a 50-day change of positive 46.75 points and a 100-day change of positive 410.25 points, the picture is a multi-week pullback inside an intact longer advance rather than a reversal.
2.3 4-Hour and Swing Structure
The swing sequence is a clean series of lower highs from the 7,890.25 monthly peak down into the 7,700 area, where Tuesday's high stalled. The 38.2 percent retracement measured from the four-week high sits at 7,795.99 and the 50 percent retracement of the four-week span at 7,766.88, both far above price and neither tested on this leg. The 38.2 percent retracement from the four-week low sits at 7,737.76, which is also above price, confirming the contract is trading below every recovery threshold of its recent range.
Nearer at hand, the 50 percent retracement of the 13-week span sits at 7,645.50, effectively on top of Tuesday's 7,643.50 low. That pairing is the reason the 7,643 to 7,646 area is treated below as the pivotal support shelf rather than merely the session low.
2.4 Moving Averages
The December contract's average stack against the 7,656.00 settle:
- 5-day average 7,681.15, price below by 25.15 points
- 20-day average 7,741.23, price below by 85.23 points
- 50-day average 7,704.04, price below by 48.04 points
- 100-day average 7,626.08, price above by 29.92 points
- 200-day average 7,317.85, price above by 338.15 points
- Year-to-date average 7,349.60, price above by 306.40 points
The single most important line in that table is the 100-day at 7,626.08, because it is the nearest average still beneath price and it sits only about 17 points below Tuesday's low. It is the line that separates an ordinary pullback from a structural change, and it is close enough that Wednesday can reach it. Level-crossing mathematics place the 40-day average crossing at 7,724.40, the 9-day at 7,726.06 and the 18-day at 7,743.31, which packs the overhead average resistance into the 7,724 to 7,743 band.
2.5 Oscillator and Trend Readings
The short-horizon oscillator set is stretched:
- 9-day raw stochastic 11.45 percent, percent K 13.67, percent D 20.46, relative strength 40.22
- 14-day raw stochastic 10.49 percent, percent K 12.51, percent D 18.77, relative strength 43.96
- 20-day raw stochastic 10.49 percent, percent K 11.35, percent D 15.83, relative strength 46.85
- 50-day raw stochastic 53.81 percent, relative strength 51.97
- 100-day raw stochastic 63.56 percent, relative strength 53.45
A 14-day percent K of 12.51 is a genuinely depressed reading, and it is lower than the equivalent Nasdaq figure, so on this measure the broad index is the more stretched of the two even though it has held its 100-day average and the Nasdaq has not.
Trend strength does not corroborate a directional move. The 14-day directional index is 14.20 with the negative directional indicator at 23.37 above the positive at 15.64, and the 9-day directional index is 21.24 with the same ordering. Weak trend strength with negative direction is the configuration in which computed pivots and positioning levels tend to set the boundaries rather than momentum.
Historic volatility is 8.92 percent on the 14-day and 9.21 percent on the 9-day, well beneath the 50-day at 10.92 percent. Realized volatility this compressed ahead of a scheduled policy decision argues for expansion.
The multi-indicator composite reads 16 percent sell overall, with composite strength characterized as minimum and its direction as average. The short-term group is 60 percent sell while the composite trend signal is neutral. That 16 percent headline is a far weaker bearish commitment than the Nasdaq's, and the divergence is the most useful cross-instrument signal available Tuesday evening. These are conviction scores from a bundled indicator set, not calibrated probabilities.
2.6 Volatility and Expected Range
- 9-day average true range 62.59 points, 0.82 percent
- 14-day average true range 66.49 points, 0.87 percent
- 20-day average true range 70.40 points, 0.92 percent
- 9-day average daily range 63.53 points, 0.83 percent
- 14-day average daily range 64.52 points, 0.84 percent
- 20-day average daily range 62.50 points, 0.82 percent
One 14-day average true range around Tuesday's settle projects 7,589.51 to 7,722.49. One 14-day average daily range projects 7,591.48 to 7,720.52. Tuesday's realized 57.50 point range came in below both, leaving unspent range into the decision.
The options surface gives a forward figure. At-the-money implied volatility on the cash index for Wednesday is 19.0 percent, implying roughly 119 basis points of movement, which is about 90 points on the cash index at Tuesday's 7,585.73 close and therefore a comparable magnitude in this contract at the current basis. That is materially wider than the 14-day average true range of 66.49 points, which is the market's own statement that Wednesday is expected to be an outsized session.
3. Key Levels
All levels below are December S&P 500 E-mini futures prices with cash-index equivalents in parentheses. Two different offsets appear in this section and the distinction matters. For pivots, averages and statistical bands the translation uses a measured basis of 70.00 points, taken as Tuesday's 7,656.00 futures settle against the cash close of 7,585.73, rounded to 7,586. For the modeled positioning levels the positioning model publishes its own futures and cash pair directly, carrying its own offset of 70.35 points, and those pairs are quoted as published rather than re-derived.
3.1 Resistance
7,747.67 (SPX 7,678), third pivot resistance. The outer boundary of the computed ladder and the practical ceiling for a session that does not involve a policy surprise.
7,725.35 (SPX 7,655), modeled volatility threshold. A modeled underlying-price threshold published by the positioning model as of Tuesday's close, not an option strike, and not necessarily on a listed strike increment. It sits almost exactly on the second pivot resistance, which makes the 7,724 to 7,726 band the firmest overhead shelf.
7,724.33 (SPX 7,654), second pivot resistance. Reinforced by the 40-day average crossing at 7,724.40 and the 9-day crossing at 7,726.06.
7,706.66 (SPX 7,637), three standard deviation resistance. A statistical extension boundary; a tag without a close above is a fade candidate.
7,703.35 (SPX 7,633), modeled gamma-flip level. The threshold above which dealer hedging becomes stabilizing and below which it becomes destabilizing, published as a modeled underlying price rather than a strike, and current as of Tuesday's close. It sits 2.35 points above Tuesday's session high, which is why this is the decisive line for Wednesday.
7,690.17 (SPX 7,620), first pivot resistance. The one standard deviation resistance at 7,685.25 sits just beneath it, making 7,685 to 7,690 the first real supply band above the settle.
7,681.15 (SPX 7,611), five-day average. The nearest average overhead and the first test any recovery attempt faces.
7,666.83 (SPX 7,597), pivot point. Wednesday's computed pivot, only 10.83 points above the settle, so the contract opens the session essentially at its pivot.
3.2 Support
7,650.78 (SPX 7,581), computed downside objective. A short-horizon projected target from the same computed level set that produces the pivot ladder.
7,645.50 (SPX 7,576), 50 percent retracement of the 13-week span. Sits two points above Tuesday's low and forms the upper edge of the pivotal support shelf.
7,643.50 (SPX 7,574), Tuesday's session low and the one-month low. The most important level on the board. Its cash equivalent also lands on the implied one-day move low of 7,573.5 that held through Tuesday's session, so the level is corroborated by two independent methods.
7,632.67 (SPX 7,563), first pivot support. The first computed level beneath the monthly low.
7,626.75 (SPX 7,557), one standard deviation support with the 100-day average at 7,626.08. The structural line. A sustained break beneath the 100-day average would be the first evidence that this is more than a pullback.
7,614.63 (SPX 7,545), two standard deviation support. Reinforced by the 40-day average stall reference at 7,613.50.
7,609.33 (SPX 7,539), second pivot support. The next computed shelf, with three standard deviation support at 7,605.34 immediately beneath.
7,575.17 (SPX 7,505), third pivot support. The outer boundary of the ladder, effectively coincident with the primary put-side support base published at 7,570.35 (SPX 7,500), which makes 7,570 to 7,575 the deepest structural objective in view.
4. Macro Drivers
4.1 Rates and the Long End
This is the controlling driver. Benchmark 10-year yields topped 5 percent on Tuesday, reaching the highest level since 2007. Equity valuation is a discounted-cash-flow exercise, and a long end at those levels compresses the multiple across the whole index, with the effect concentrated in the longest-duration constituents. That is precisely the observed ordering on the day, with the Nasdaq-100 down about 0.65 percent against the broad index at about 0.45 percent.
The data behind the yield move has been firm and one-directional. Core consumer prices rose 0.3 percent month over month against a 0.2 percent forecast and a 0.2 percent prior. Producer prices rose 5.4 percent year over year against a 5.3 percent forecast, accelerating from a revised 4.8 percent. Nonfarm payrolls printed 162,000 against a 55,000 forecast, with the prior revised up to 21,000 from negative 23,000. Official commentary is split, with one governor citing signs of disinflation and another cautioning that underlying trends have not meaningfully improved.
4.2 The Policy Decision
A 25 basis point increase is more than 90 percent priced for Wednesday, and the published consensus is 4.00 percent against a 3.75 percent prior. The previous meeting's vote was 9 to 3, with three dissents already favouring an increase, so the committee was leaning this way before the recent data. A senior White House economic adviser argued publicly on Tuesday afternoon that raising rates would be a mistake, and at least one investment-bank note argued for holding until tariff and revision noise clears.
Because the increase itself is so heavily discounted, the decision is not the event. The projection round and the guidance are. A projection set implying further increases in October and December is a materially different outcome from the same increase delivered with a signal to pause, and the two point in opposite directions for the index.
4.3 Energy and the Inflation Channel
Crude rose about 4 percent to trade above 105 dollars. The supply side carries a genuine risk premium: a crucial Saudi pipeline struck earlier in the month is out of service, with regional officials estimating three to five weeks of repairs and the US Energy Secretary saying he expects the outage to be measured in days, a Saudi refinery was hit in earlier strikes, explosions were reported on Iran's Kharg Island on September 8, and an explosion was reported in Erbil in northern Iraq on Tuesday evening. Saudi civil defense issued and then cleared warnings in two areas during the session.
Offsetting that, industry inventory data released after the close showed a crude build of 7.1 million barrels against a 1.8 million draw forecast, a bearish supply print. The official government inventory report follows at 10:30 AM ET Wednesday. Energy matters to the index here mainly through the inflation expectations channel that drives the long end.
4.4 Geopolitical Backdrop
Beyond energy infrastructure, a senior US official stated that Iran is occasionally firing on commercial vessels while also saying the United States is not engaged in aggressive operations, and separately indicated openness to determining whether the United States engages. Press reports also indicated that US trade negotiators are pressing Mexico to encourage more North American content in servers, chips and related equipment. None of these moved the index on the day; they are standing sources of headline risk rather than active drivers.
4.5 Cross-Asset and Volatility
The volatility surface is the most interesting asymmetry in the setup. The broad-market volatility index closed in the 17 handle at 17.21 and the volatility-of-volatility index at 95, which is a calm equity-volatility reading against a rates and energy backdrop that is anything but calm. Fixed-strike implied volatility did rise across the board, with this week's expirations up roughly 1 to 2.5 volatility points versus Monday, so the surface is repricing, but from a low base. Bitcoin slid after the Senate blocked a crypto market-structure bill, removing a marginal risk-appetite support.
4.6 Institutional Positioning
The positioning data available Tuesday evening is index-level and points to de-grossing rather than capitulation. Commitment of Traders data through September 8 showed elevated non-dealer length in Nasdaq futures, with about 7.1 billion dollars net sold between September 1 and September 8. A crowded long being reduced into a policy decision supplies ready selling into failed rallies, and while that reading is Nasdaq-specific it describes the same investor base that sets the broad index bid.
5. Options Flow and Dealer Positioning Context
Unlike the Nasdaq, the S&P complex is the native domain for this positioning model: it publishes levels for the cash index, the exchange-traded fund and this very futures contract side by side, so no proxy translation is required and the futures values below are the model's own published pairs.
For the December contract the model publishes a modeled gamma-flip level at 7,703.35, a modeled volatility threshold at 7,725.35, a primary call-side ceiling at 7,870.35, a primary put-side support base at 7,570.35 and a primary gamma concentration at 8,070.35. The corresponding cash-index values are 7,633, 7,655, 7,800, 7,500 and 8,000. Those futures figures carry the model's own offset of 70.35 points rather than the 70.00 point measured basis; the two agree closely, which is itself a useful check.
The decisive relationship is that the contract settled at 7,656.00, which is 47.35 points beneath the modeled gamma-flip level of 7,703.35. Beneath that threshold dealer hedging amplifies direction instead of damping it, and the note accompanying the data states the cash index is in a negative-gamma condition below 7,600 into Friday. The zero-dated positive gamma pocket at 7,560 to 7,570 that stabilized Tuesday afternoon expired at the close, so that particular cushion is gone for Wednesday.
The supporting measures are mixed in an instructive way. For the cash index, estimated gamma notional is negative 286.897 million dollars with a gamma tilt of 0.966, call gamma of 9 billion against put gamma of negative 3.3 billion, and next-expiration gamma of 8.42 percent. For the exchange-traded fund the same measures are far more negative: gamma notional of negative 1.715 billion dollars, a gamma tilt of 0.607, call gamma of 3.6 billion against put gamma of negative 7.9 billion, and next-expiration gamma of 12.58 percent. The fund closed at 758.05, down 0.36 percent from 760.77, beneath its own modeled gamma-flip level of 765, beneath its modeled volatility threshold of 762, and beneath its primary put-side support base of 760. A market trading under its principal put-side concentration has less mechanical support beneath it than a level list alone implies.
Options activity leaned to the downside without being extreme. Cash-index put volume of 1.054 million against call volume of 740,491 is a ratio near 1.42, and put open interest of 14.631 million against call open interest of 10.43 million is a ratio near 1.40. Referenced cash-index levels are 8,000, 7,700, 7,600 and 7,000; referenced fund levels are 770, 765, 760 and 750.
Two structural expirations frame the week: a volatility-index expiration at 9:30 AM ET Wednesday and a quarterly expiration on Friday, September 18.
6. Forecast
Scenario weightings below are analyst judgment, not statistically derived frequencies.
Night Session (6:00 PM ET Tuesday to 3:00 AM ET Wednesday, Globex/Asia)
Mild upward drift on thin participation. The contract reopened at 7,663.25 and has printed 7,664.75, 8.75 points above settle on about 15,019 contracts. Asian trade will take its cue from the US yield complex rather than from regional data. Expected Globex band 7,640 to 7,690, with a move back beneath 7,643.50 the signal that Tuesday's low is being tested rather than defended.
London Session (3:00 AM to 8:00 AM ET Wednesday)
Two-way with an inflation tilt. UK consumer prices at 2:00 AM ET are forecast at 3.1 percent year over year against a 2.9 percent prior, with services prices at 3.5 percent and input producer prices at 5.4 percent. A firm UK print lifts global long-end yields, which transmits straight into equity valuation. Eurozone industrial production at 5:00 AM ET is forecast modestly negative. Expected band 7,635 to 7,695.
Morning Session (9:30 AM to 12:00 PM ET Wednesday, RTH Open)
The cash open at 9:30 AM ET sets the session's first directional test, and it coincides with a volatility-index expiration at 9:30 AM ET that can distort early pricing. Retail sales at 8:30 AM ET is the morning's substantive input, forecast at 0.8 percent month over month against a negative 0.6 percent prior, with the core measure at 0.6 percent against negative 0.3 percent. A strong print reinforces the case for the increase and pressures the index. The level map is compact: the pivot at 7,666.83 is barely above the settle, the 7,700 to 7,705 band is the ceiling that matters, and 7,643.50 is the line whose loss opens the 100-day average at 7,626.08. Expected morning band 7,640 to 7,705.
Afternoon Session (12:00 PM to 4:00 PM ET Wednesday)
This is the session. The decision, the rate statement and the projection round all land at 2:00 PM ET, with the press conference at 2:30 PM ET. Pricing is likely to be disorderly between 2:00 PM and 2:45 PM ET. Government crude inventories at 10:30 AM ET, forecast at a 1.5 million barrel draw, feed the energy channel earlier, and Bank of Canada minutes at 1:30 PM ET are a minor input. Expected afternoon band 7,600 to 7,730, the widest of the day.
Night Session Forward (6:00 PM ET Wednesday)
Residual direction follows the projection round. Guidance implying further increases in October and December, with the long end holding above 5 percent, sustains pressure toward 7,626 and then 7,609. Guidance implying a pause after this increase is the condition for a recovery through 7,703 toward 7,725. Japanese consumer prices at 7:30 PM ET Thursday and a Bank of Japan decision late Thursday, where consensus looks for 1.25 percent against a 1.00 percent prior, keep the global tightening theme alive into the end of the week.
Expected Range (Wednesday Full Session)
- Low-range scenario: 7,620 to 7,700, an 80 point band, roughly 1.2 times the 14-day average true range of 66.49, if the guidance reads as neutral
- Mid-range scenario (most likely): 7,600 to 7,720, a 120 point band, roughly 1.8 times the 14-day average true range
- High-range scenario: 7,560 to 7,760, a 200 point band, roughly 3.0 times the 14-day average true range, on a guidance surprise in either direction
Most Likely Path
The base case is an attempt higher into the pivot at 7,666.83 and then toward the 7,700 to 7,705 confluence during the morning, compression through midday as participants decline to carry risk into the release, and expansion after 2:00 PM ET. With the contract beneath its modeled gamma-flip level, beneath its 5-day, 20-day and 50-day averages, and with negative directional indicators dominant, the higher-conviction resolution is a failure at that confluence and a retest of 7,643.50. The genuine two-sided risk is the oscillator set: a 14-day percent K of 12.51 sitting on a one-month low is the configuration from which relief rallies start, and a dovish projection round is the catalyst that would trigger one.
7. Wednesday Economic Calendar
The overnight block opens at 2:00 AM ET with the UK inflation set: consumer prices forecast at 3.1 percent year over year against a 2.9 percent prior, core at 2.6 percent against 2.6 percent, services at 3.5 percent against 3.4 percent, and producer input prices at 5.4 percent against 4.9 percent. The European morning brings the ECB wage tracker and final Italian harmonised prices at 4:00 AM ET, then eurozone industrial production at 5:00 AM ET, forecast at negative 0.1 percent year over year.
The US morning opens at 8:30 AM ET with retail sales, forecast at 0.8 percent month over month against a negative 0.6 percent prior, core retail sales at 0.6 percent against negative 0.3 percent, and import prices at 0.5 percent against negative 0.4 percent. Canadian housing starts and an ECB speaker share the 8:15 AM ET slot, and Canadian building permits accompany the 8:30 AM ET block. At 10:00 AM ET the housing market index is forecast at 34 against a 35 prior and business inventories at 0.8 percent. Government crude inventories follow at 10:30 AM ET, forecast at a 1.5 million barrel draw against a 0.391 million draw prior.
The afternoon carries the decisive events. Bank of Canada minutes arrive at 1:30 PM ET. The US interest rate decision, the rate statement and the Summary of Economic Projections all land at 2:00 PM ET, with consensus at 4.00 percent against a 3.75 percent prior, and the press conference begins at 2:30 PM ET. New Zealand growth data follows at 6:45 PM ET.
The single first-order event is the 2:00 PM ET decision and projection release. Everything before it is positioning and everything after it is reaction. Structurally, a volatility-index expiration at 9:30 AM ET and Friday's quarterly expiration on September 18 frame the week. Looking one day further, Thursday brings a Bank of England decision at 7:00 AM ET, US jobless claims and the Philadelphia Fed index at 8:30 AM ET, a 10-year inflation-protected auction at 1:00 PM ET, and a Bank of Japan decision late in the session. The next policy decision after Wednesday is October 28, and the following projection round is December 9, which is the horizon any guidance about October and December increases refers to.
8. Primary Trade Setup
Direction: Short
Rationale: The contract settled in the lower 22 percent of its range at a fresh one-month low, beneath its 5-day, 20-day and 50-day averages, with negative directional indicators dominant and the settle 47.35 points beneath the modeled gamma-flip level, into a decision where a 25 basis point increase is more than 90 percent priced and the long end has cleared 5 percent. Tuesday's session high at 7,701.00 and that modeled flip level at 7,703.35 sit within 2.35 points of each other, giving an unusually precise place to define risk.
Entry Zone: 7,700 to 7,705, on a retest of Tuesday's session high where the modeled gamma-flip level sits.
Stop Loss: 7,727 (above both the second pivot resistance at 7,724.33 and the modeled volatility threshold at 7,725.35, so a stop-out requires reclaiming the stabilizing side of the positioning structure rather than merely tagging it)
Target 1 (T1): 7,666.83 (the computed pivot point)
Target 2 (T2): 7,643.50 (Tuesday's session low and the one-month low, whose cash equivalent coincides with the implied one-day move low that held through Tuesday)
Target 3 (T3, extended): 7,626.75 (one standard deviation support, with the 100-day average at 7,626.08; only if momentum extends through T2 on expanding volume)
Risk-to-Reward: From a 7,702.50 entry midpoint against the 7,727 stop, risk is 24.50 points. T1 returns 35.67 points, roughly 1.5 to 1. T2 returns 59.00 points, roughly 2.4 to 1. T3 returns 75.75 points, roughly 3.1 to 1.
Invalidation: A sustained move above 7,727, and in particular an hourly close above the 7,741 to 7,748 band where the 20-day average and third pivot resistance sit, negates the short thesis.
Macro override: A projection round implying a pause after this increase is the scenario that invalidates this setup in real time and can carry the contract back through 7,725 toward 7,747. The mirror case, projections implying further increases in October and December, accelerates the downside and argues for holding T3 rather than covering at T2. The oscillator set is the standing counter-argument: a 14-day percent K of 12.51 at a one-month low means this short is being taken into an already-stretched market, which is why the entry is defined at a specific confluence rather than sold into weakness.
Alternate setup: Long on a reclaim of 7,727 with follow-through, targeting 7,741 first and 7,747.67 second, stop beneath 7,703. Size smaller than the primary, since this trades against the average stack.
Sources and methodology
This outlook is built from our session review of the December E-mini S&P 500 contract, prepared after Tuesday's close on September 15, 2026. Computed pivot, standard-deviation and retracement levels come from Tuesday's session high, low and settlement. The session high and low are the inputs behind the published pivot ladder rather than an independently read bar, and the 7,643.50 low matches the separately published one-month low.
Positioning-model levels are quoted in the pairs the model publishes, which carry a 70.35-point offset between futures and cash. Other conversions use the measured 70.00-point basis between the 7,656.00 settlement and the 7,585.73 cash close. Modeled levels such as the gamma-flip level and the volatility threshold are thresholds produced by a positioning model, not listed option strikes, and they move as positioning changes.
Closing figures for the S&P 500, the Dow, the Nasdaq-100, crude oil and the 10-year Treasury yield, the industry inventory estimate and the Saudi pipeline repair estimates were checked against published reports. Scenario ranges are analyst judgment; they are not statistically derived and carry no calibration.
Published sources include the Seoul Economic Daily market close report, Nasdaq-100 daily history, the Associated Press report on the pipeline repairs and the Reuters report on the Energy Secretary's estimate.
Outlooks for ES, NQ, GC and CL are collected on the market outlook page, and our forward trading record, recomputed from the record itself, is on the performance statement.
View pricing →


